Geotextile Market Size and Share
Market Overview
| Study Period | 2021 - 2031 |
|---|---|
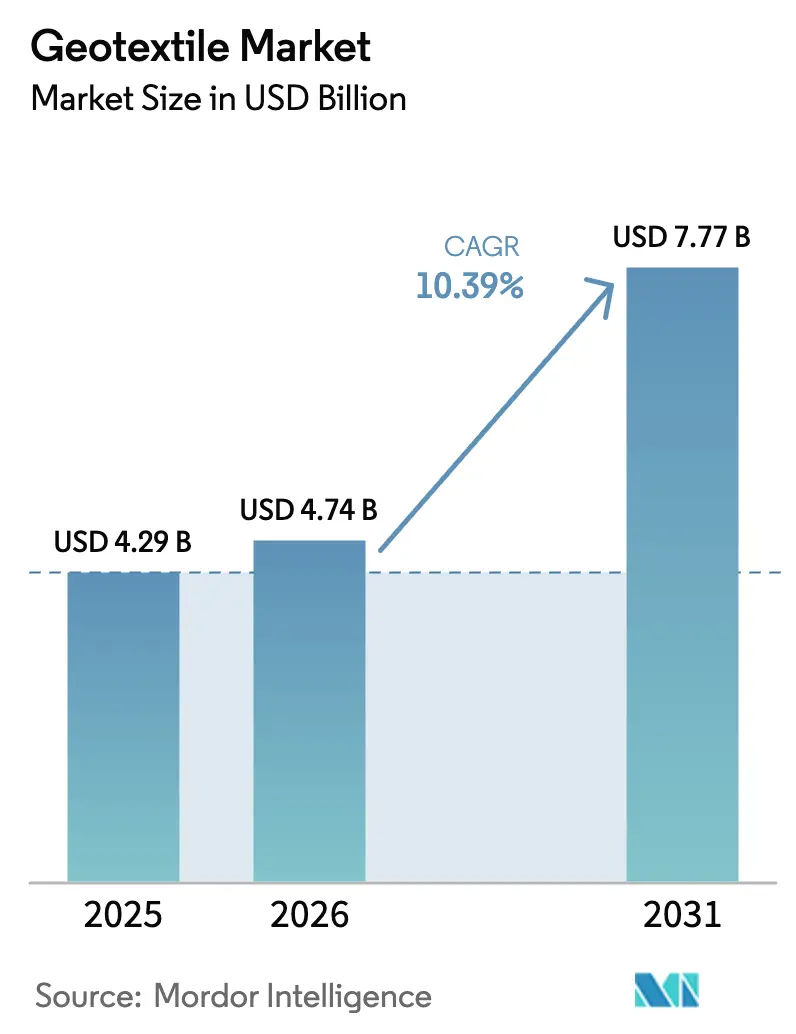
| Market Size (2026) | USD 4.74 Billion |
| Market Size (2031) | USD 7.77 Billion |
| Growth Rate (2026 - 2031) | 10.39% CAGR |
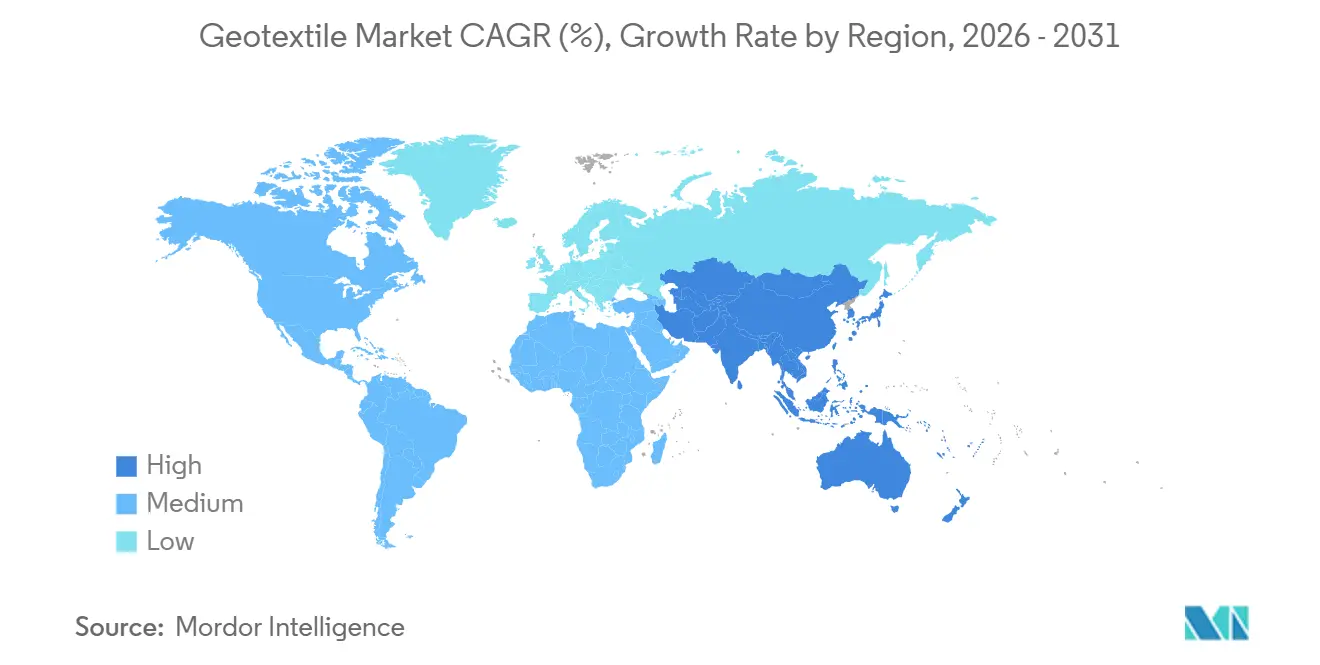
| Fastest Growing Market | Asia Pacific |
| Largest Market | Asia Pacific |
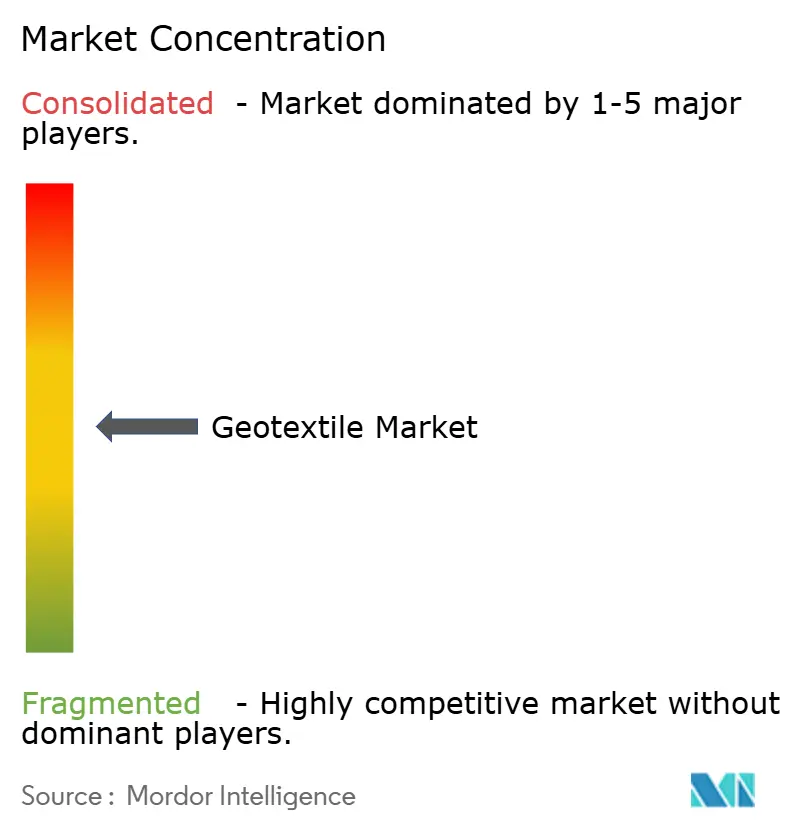
| Market Concentration | Medium |
Major Players *Disclaimer: Major Players sorted in no particular order Image © Mordor Intelligence. Reuse requires attribution under CC BY 4.0. | |
Geotextile Market Analysis by Mordor Intelligence
The Geotextile Market size is expected to grow from USD 4.29 billion in 2025 to USD 4.74 billion in 2026 and is forecast to reach USD 7.77 billion by 2031 at 10.39% CAGR over 2026-2031. Growth rests on highway and landfill regulations that reward engineered separation and drainage fabrics, while competitive pricing for polypropylene continues to outweigh sustainability preferences. Procurement norms now emphasize verified performance, prompting suppliers to integrate design software, bio-based polymers, and digital monitoring into their bids to secure long-term contracts. Surging demand from the U.S. Infrastructure Investment and Jobs Act, China’s National Highway Network Plan, and the EU Landfill Directive underpins a steady pipeline of road, mining, and waste-management projects. Volatile feedstock prices and tightening rPET availability temper margins, yet the shift toward value-added advisory services supports price resilience. Regional converters remain relevant in tailings-dam liners and agricultural drainage where just-in-time delivery outweighs brand scale, keeping the overall market moderately fragmented.
Key Report Takeaways
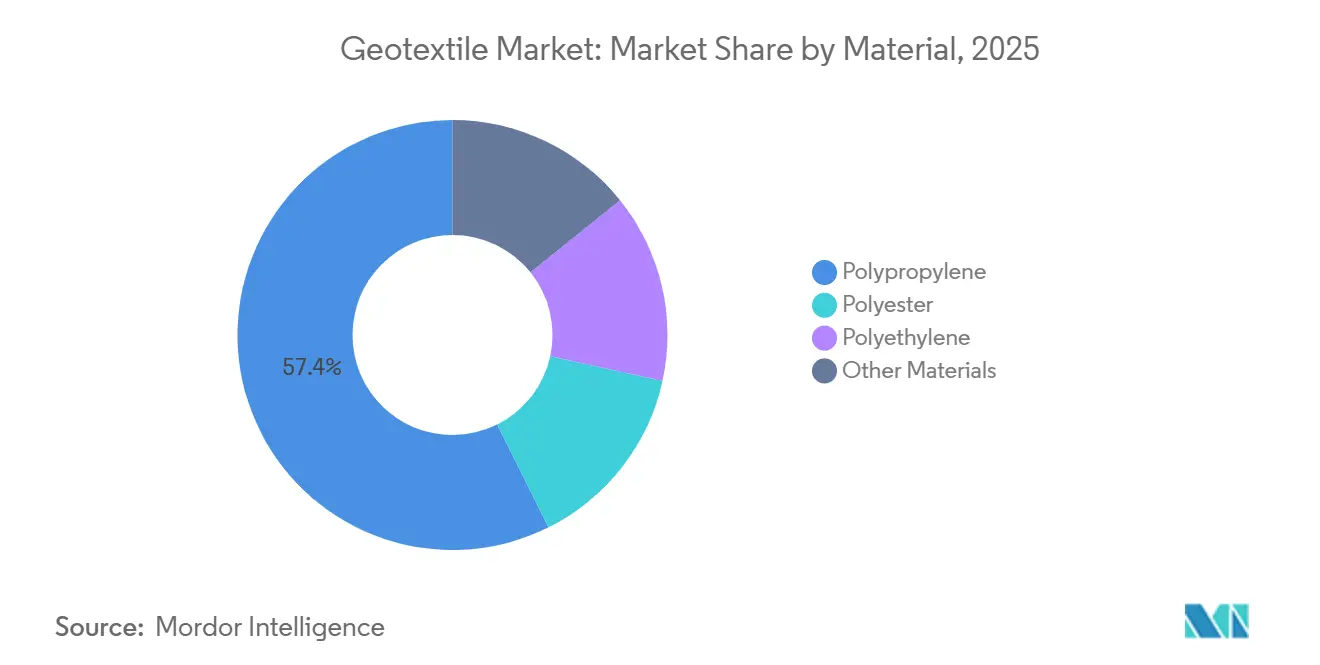
- By material, polypropylene held 57.38% of geotextile market share in 2025 and is forecast to expand at an 11.33% CAGR through 2031.
- By fabric type, woven captured 45.26% revenue share in 2025; non-woven fabrics are advancing at an 11.54% CAGR to 2031.
- By function, separation commanded 30.12% of the geotextile market size in 2025 and is progressing at a 12.24% CAGR through 2031.
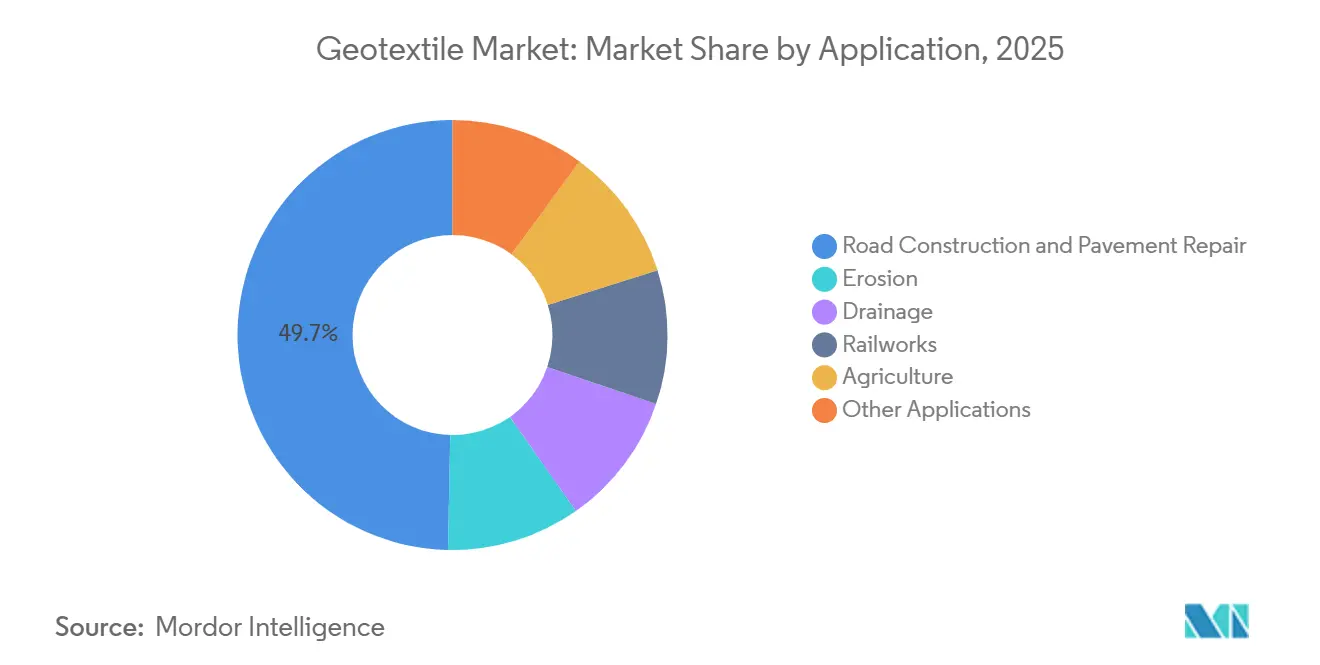
- By application, road construction and pavement repair led with 49.67% of revenue in 2025 and the segment is projected to record the fastest CAGR at 12.57% to 2031.
- By geography, Asia-Pacific led with 39.58% of revenue in 2025 and is projected to record the fastest CAGR at 11.89% to 2031.
Note: Market size and forecast figures in this report are generated using Mordor Intelligence’s proprietary estimation framework, updated with the latest available data and insights as of January 2026.
Global Geotextile Market Trends and Insights
Drivers Impact Analysis*
| Driver | (~) % Impact on CAGR Forecast | Geographic Relevance | Impact Timeline |
|---|---|---|---|
| Growing Adoption in Road and Highway Infrastructure Projects | +3.2% | Global, with concentration in Asia-Pacific (China, India, ASEAN) and North America | Medium term (2-4 years) |
| Rising Demand for Filtration and Drainage in Water-Management Assets | +2.1% | Global, with early gains in Europe, North America, and water-stressed APAC regions | Long term (≥ 4 years) |
| Stricter Global Landfill and Wastewater Regulations | +1.8% | Europe (EU Landfill Directive), North America (EPA Subtitle D), emerging enforcement in APAC | Short term (≤ 2 years) |
| Accelerating Investment in Mining Tailings-Dam De-Risking | +1.5% | Global, with focus on Chile, Peru, Australia, Canada, South Africa | Medium term (2-4 years) |
| Mandatory Capping Layers Under EU Landfill Directive | +1.4% | Europe (EU-27), with spillover to UK and candidate countries | Short term (≤ 2 years) |
| Source: Mordor Intelligence | |||
Growing Adoption in Road and Highway Infrastructure Projects
The FY2026 U.S. federal budget earmarks USD 111.3 billion for highways, including USD 7.2 billion for bridge replacement, cementing a multi-year pull for separation and reinforcement fabrics. India awarded 8,500 kilometers of national highways during 2025, embedding geotextile layers to curb settlement in monsoon regions. China cleared 4,200 kilometers of expressways in early 2026 and now mandates soil-reinforcement geosynthetics for soft-clay corridors in Jiangsu and Zhejiang. Across ASEAN, connectivity corridors use non-woven filtration layers beneath crushed-stone bases to stem fines migration. Contracts have shifted from lowest bid to performance-based deals that bundle warranties and remote monitoring, favoring suppliers with integrated design platforms.
Rising Demand for Filtration and Drainage in Water-Management Assets
EU utilities spent EUR 18 billion on stormwater upgrades in 2025, codifying geotextile-wrapped perforated pipes in German and Dutch drainage norms to prolong service life to 50 years. The U.S. EPA disbursed USD 6.8 billion under the Clean Water State Revolving Fund in 2025, with many plants adopting geotextile filtration layers in constructed wetlands to meet suspended-solids limits. India’s Jal Jeevan Mission scales infiltration galleries lined with geotextiles across arid states, while Australia’s Murray-Darling Basin modernization finances subsurface drains wrapped in needle-punched fabrics to curb salinity. These programs reposition geotextiles as engineered systems that deliver measurable OPEX reductions rather than generic textile inputs.
Stricter Global Landfill and Wastewater Regulations
The 2024 EU Landfill Directive amendment compels multi-layer caps featuring drainage geotextiles, raising demand to 40–50 million m² for retrofits alone[1]European Commission, “EU Landfill Directive Amendment 2024,” ec.europa.eu . California’s Title 27 revision now specifies 2,200 N minimum puncture resistance, a 15% hike that favors calendered polypropylene. China updated its landfill code in 2025 to enforce separation layers in leachate systems, adding up to 10 million m² yearly. Compliance pushes fabricators to invest in heat-setting lines while recycling and testing documentation becomes procurement gatekeepers across the Atlantic.
Accelerating Investment in Mining Tailings-Dam De-Risking
GISTM adoption across 80 miners mandates independent dam reviews by 2028, accelerating retrofits that install drainage blankets to relieve pore pressure[2]International Council on Mining and Metals, “GISTM Implementation Report 2025,” icmm.com . Vale earmarked USD 1.8 billion in 2025 for Brazilian dam decommissioning that specifies geotextile-wrapped drains to expedite consolidation. BHP’s Escondida commits USD 450 million for tailings expansion in 2026 using reinforced lifts that leverage woven fabrics rated at 100 kN/m tensile strength. South Africa’s draft rules mirror this, forecasting 4 million m² incremental demand. Large miners lock multi-year buying frameworks, while juniors buy spot, fostering a two-tier pricing environment.
Restraints Impact Analysis*
| Restraint | (~) x`% Impact on CAGR Forecast | Geographic Relevance | Impact Timeline |
|---|---|---|---|
| Crude Oil Linked Volatility in Polypropylene and Polyester Prices | -1.6% | Global, with acute impact in import-dependent regions (ASEAN, Middle-East, Africa) | Short term (≤ 2 years) |
| rPET Diversion to Beverage Packaging Tightening PET Supply | -0.9% | Europe (EU Plastics Strategy), North America (California SB 54), emerging in APAC | Medium term (2-4 years) |
| Design-Engineering Talent Gap in Emerging Markets | -0.7% | APAC (excluding Japan, South Korea), Latin America, Sub-Saharan Africa | Long term (≥ 4 years) |
| Source: Mordor Intelligence | |||
Crude-Oil-Linked Volatility in Polypropylene and Polyester Prices
Polypropylene is projected at USD 1,150/ton in Asia during Q1 2026, 18% above Q4 2025 after OPEC+ cuts squeezed naphtha supply. European polyester staple fiber hit EUR 1,420/ton (USD 1,530) on refinery outages and high gas prices. Fabricators lock customer prices for 12–18 months but procure resin monthly, eroding margins when spikes exceed 15%. Smaller converters without hedging instruments face cash-flow stress, leading to project delays or downgraded fabric specs.
rPET Diversion to Beverage Packaging Tightening PET Supply
The EU Plastics Strategy mandates 30% recycled content in PET bottles by 2030, diverting roughly 1.2 million tons of rPET from industrial outlets. California’s SB 54 enforces 25% rPET by 2027, pushing North American spot prices to USD 1,680 / ton, a 35% premium to virgin PET. Geotextile producers either absorb cost or revert to virgin polyester, undermining sustainability claims and elevating polypropylene as a cheaper substitute.
*Our forecasts treat driver/restraint impacts as directional, not additive. The impact forecasts reflect baseline growth, mix effects, and variable interactions.
Segment Analysis
By Material: Polypropylene Continues to Dominate on Cost and Chemical Resistance
Polypropylene held 57.38% of 2025 revenue and is growing at an 11.33% CAGR to 2031 as transportation agencies prioritize alkaline-soil resistance over recycled content. Polyester is constrained by rPET scarcity and remains indispensable for high-tensile applications like tailings-dam reinforcement. Polyethylene occupies niche in UV-intensive landfill caps where conformability justifies its premium. Natural fibers such as coir and jute fill in short-term erosion control across South Asia and East Africa. Bio-based polypropylene pilots target 30% renewable feedstock by 2028, yet must close a 25% cost gap before scaling.
Polypropylene’s hydrophobicity prevents moisture-induced subgrade weakening, extending pavement life by up to 20 years on Chinese and Indian motorways. Polyester’s elongation at break above 50% retains traction in embankment lifts requiring extreme strain absorption. Polyethylene’s UV stability secures use in exposed coastal revetments where service life exceeds 50 years. Natural fibers meet biodegradable mandates on gentle slopes but remain limited by tensile ceilings below 20 kN/m.


By Fabric Type: Non-Woven Uptake Mirrors Conformability Needs
Woven commanded 45.26% revenue in 2025 for high-load reinforcement of unpaved roads and rail beds that demand more than 1,400 N grab tensile strength. Non-wovens are the fastest risers at 11.54% CAGR through 2031, answering landfill and drainage specs that require more than 1×10⁻³ m/s permeability. Knitted geotextiles handle specialized revetments where 3-D interlocking boosts soil retention. Hybrid lines combining woven yarn grids with non-woven filter webs emerge to meet ballast and soft-soil dual requirements.
EU landfill caps effectively prescribe non-woven drainage layers, creating sticky demand through 2030. Asia-Pacific miners are upgrading to woven fabrics rated at ≥100 kN/m for tailings dams, a strength unattainable for standard needle-punched webs. India’s 2025 pavement guidance, however, opens light-traffic roads to spunbond non-wovens, triggering a cost-down swing for rural corridors.
By Function: Separation Leads as Agencies Eye Pavement Longevity
Separation topped 30.12% of 2025 revenue and is racing at a 12.24% CAGR to 2031 because agencies find it extends overlays by up to two decades. Drainage is growing due to robust water-utility spending, while filtration is growing due to wetlands and irrigation schemes. Reinforcement drives demand as mining, haul roads, and embankments rely on high-tensile woven fabrics. Protection layers occupy the balance, cushioning geomembranes in landfills and reservoirs.
The Federal Highway Administration’s 2025 guidance effectively mainstreamed separation fabrics across 45% of soft-soil interstate miles. Water utilities retrofit storm drains with geotextile-wrapped pipes to hit TSS discharge caps, bumping drainage demand. Reinforcement uptake is concentrated in Chilean copper and Australian iron ore mines where heavy haul dictates more than 100 kN/m tensile specs.
By Application: Road Construction Anchored by Fiscal Stimulus
Road construction and pavement repair contributed 49.67% of 2025 revenue and grow at a compelling 12.57% CAGR on the USD 350 billion U.S. stimulus and Asia-Pacific highway booms. Erosion is expanding as coastal states armor shorelines against extreme weather. Agricultural subsurface systems in Australia and India fuel drainage. Railworks grow due to China’s high-speed network and India’s Dedicated Freight Corridor. Mining, coastal containment, and other applications of tailings liner failures are linked to compliance with the Global Industry Standard on Tailings Management (GISTM).
Geography Analysis
Asia-Pacific generated 39.58% of 2025 revenue and is outpacing peers at 11.89% CAGR on China’s expressway surge and India’s Bharatmala builds that standardize polypropylene separation layers. Southeast Asia invested USD 18 billion in 2025 for cross-border highways, specifying non-woven filtration fabrics to minimize fines migration. Japan and South Korea, with limited greenfield land, pivot to rehabilitation and coastal erosion works that prefer high-strength woven polyester.
North America is buoyed by the Infrastructure Investment and Jobs Act and Canada’s CAD 33.5 billion allocation. FY2026 budgets earmark USD 111.3 billion for U.S. highways, sustaining long-cycle demand despite labor and permitting delays that push some procurement into 2027. Mexico bundles geotextile supply into turnkey EPC deals to compress timelines on federal corridors.
Europe mandates add 40–50 million m² of drainage layers through 2030. Germany’s UBA pushes permeability thresholds that tilt demand toward needle-punched webs, while the UK enforces protection layers to block root and rodent puncture. South America is led by Brazil’s BRL 45 billion PAC roads and coastal ports. The Middle-East and Africa is paced by Saudi Arabia’s NEOM highway grid and UAE desert road stabilization.

Competitive Landscape
Top suppliers - Freudenberg, Solmax, HUESKER, Naue, and Fibertex - held 44% revenue in 2025, leaving ample runway for regional entities. Freudenberg’s 2025 bio-based polypropylene pilot targets 30% renewable feedstock by 2028. Solmax acquired a 120,000 m² Indian plant in February 2026, adding 15 million m² annual woven capacity for Bharatmala tenders. HUESKER landed a EUR 28 million landfill-retrofit contract covering 45 German sites through 2027.
Digital differentiation rises as Solmax and Naue deploy cloud design tools that cut over-specification by up to 15% and embed suppliers early in project scoping. Patent activity centers on multi-functional needle-punched webs that deliver drainage and filtration simultaneously. Chinese converters undercut EU makers by 20% on FOB terms, pushing incumbents toward high-certification niches such as mining liners and hazardous-waste containment. Overall rivalry is moderate; switching costs are anchored in lab approvals and contractor familiarity, preserving stable mid-single-digit EBITDA margins for top players.
Geotextile Industry Leaders
HUESKER International
Naue GmbH & Co. KG
Fibertex Nonwovens A/S
Solmax
Freudenberg Performance Materials
- *Disclaimer: Major Players sorted in no particular order

Recent Industry Developments
- February 2025: Naue GmbH & Co. KG developed GlacierProtect geotextile, a solution designed to enhance glacier protection and preserve snow reserves in ski resorts. The material was composed of Naue Secutex Green, a nonwoven fabric made entirely from renewable and biodegradable raw materials.
- December 2024: Solmax consolidated its European nonwoven geotextile production at a new facility near Paris. The company plans to close its plants in Linz, Austria, and Bezons, France, over the two years to enhance efficiency, improve quality, and increase supply chain agility for landfill projects and BABA-compliant exports.


Research Methodology Framework and Report Scope
Market Definitions and Key Coverage
Our study defines the geotextile market as revenue earned from permeable synthetic or natural textiles that are laid directly against soil, rock, or waste to separate, filter, drain, reinforce, or protect civil and environmental works worldwide. We include woven, non-woven, and knitted sheets produced from polypropylene, polyester, polyethylene, jute, and coir for roads, railways, drainage, erosion control, farming, and allied infrastructure.
Scope exclusion: All non-textile geosynthetics, including geomembranes, geogrids, geofoams, and geocomposites, sit outside this baseline.
Segmentation Overview
- By Material
- Polypropylene
- Polyester
- Polyethylene
- Other Materials
- By Fabric Type
- Woven
- Non-woven
- Knitted
- By Function
- Separation
- Drainage
- Filtration
- Reinforcement
- Protection
- By Application
- Road Construction and Pavement Repair
- Erosion
- Drainage
- Railworks
- Agriculture
- Other Applications (Mining Operations, Coastal and Waterway Protection, etc.)
- By Geography
- Asia-Pacific
- China
- India
- Japan
- South Korea
- Thailand
- Malaysia
- Indonesia
- Vietnam
- Rest of Asia-Pacific
- North America
- United States
- Canada
- Mexico
- Europe
- Germany
- France
- United Kingdom
- Italy
- Spain
- NORDIC Countries
- Rest of Europe
- South America
- Brazil
- Argentina
- Colombia
- Rest of South America
- Middle-East and Africa
- Saudi Arabia
- United Arab Emirates
- Qatar
- South Africa
- Nigeria
- Egypt
- Rest of Middle-East and Africa
- Asia-Pacific
Detailed Research Methodology and Data Validation
Primary Research
We spoke with procurement engineers, laboratory directors, and distributors across Asia-Pacific, North America, Europe, and the Gulf. Their feedback on bid prices, fabric weights, and regulatory acceptance sharpened every assumption.
Desk Research
Mordor analysts first mined volume and price series from bodies such as the Federal Highway Administration, Eurostat, China's Ministry of Transport, and UN Comtrade codes 5603/5902. We overlaid functional demand pools with asphalt pavement, landfill, and irrigation statistics released by the American Society of Civil Engineers, the European Geosynthetics Association, and the World Bank, thereby mapping end-use intensity. Company 10-K filings, tender portals on Tenders Info, D&B Hoovers revenue tables, and patent counts from Questel then helped us refine supplier capacity and average selling prices. The list is illustrative; many other open datasets and news archives were reviewed for context and anomaly checks.
Market-Sizing & Forecasting
Country level lane-kilometers paved, new rail track, permitted landfill area, and irrigated hectares provide the top-down demand pool, which is then multiplied by geotextile usage coefficients gathered in interviews. Supplier roll-ups of sampled output give a bottom-up sense check. Key drivers in the model include polypropylene contract prices, public works capital outlay, rainfall-based erosion indices, and India's PM-Gati Shakti pipeline. We deploy multivariate regression plus scenario analysis to roll forecasts through 2030, adjust with primary consensus on ASP trends, and convert to USD using IMF rates.
Data Validation & Update Cycle
Each figure passes anomaly scans, peer review, and senior sign-off. Models refresh yearly, with interim updates for material policy shifts or major corporate events.
Why Mordor's Global Geotextiles Market Baseline Commands Reliability
Published estimates diverge because firms choose different product baskets, price ladders, and refresh cadences. We flag these factors so buyers see the full picture.
Largest gaps arise when others bundle geomembranes, apply single global ASPs, or extrapolate short-term trade spikes without interviews. Mordor Intelligence limits scope to finished textile sheets, applies region-specific prices, and insists on yearly primary calls.
Benchmark comparison
| Market Size | Anonymized source | Primary gap driver |
|---|---|---|
| USD 4.70 B (2025) | Mordor Intelligence | |
| USD 3.62 B (2024) | Regional Consultancy A | Excludes Asia freight-in costs and natural fibers |
| USD 7.10 B (2022) | Trade Journal B | Combines geomembranes and uses constant 2015 dollars |
| USD 8.58 B (2024) | Global Consultancy C | Applies single global ASP and adds installed labor |
The comparison shows that, by selecting the right scope and validating every input, Mordor delivers a balanced, transparent baseline clients can trust.


Key Questions Answered in the Report
How fast is the geotextile market expected to grow through 2031?
The market is projected to progress at a 10.39% CAGR, reaching USD 7.77 billion by 2031.
Which material accounts for the largest share of current demand?
Polypropylene holds 57.38% of 2025 revenue due to cost effectiveness and chemical resistance.
What drives non-woven geotextile uptake?
Landfill and drainage regulations that require high permeability and conformability push non-woven adoption at an 11.54% CAGR.
Which region offers the strongest growth outlook?
Asia-Pacific leads with an 11.89% CAGR through 2031 as China and India finance large highway programs.
Page last updated on:


