Market Overview
| Study Period | 2020 - 2031 |
|---|---|
| Forecast Data Period | 2026 - 2031 |
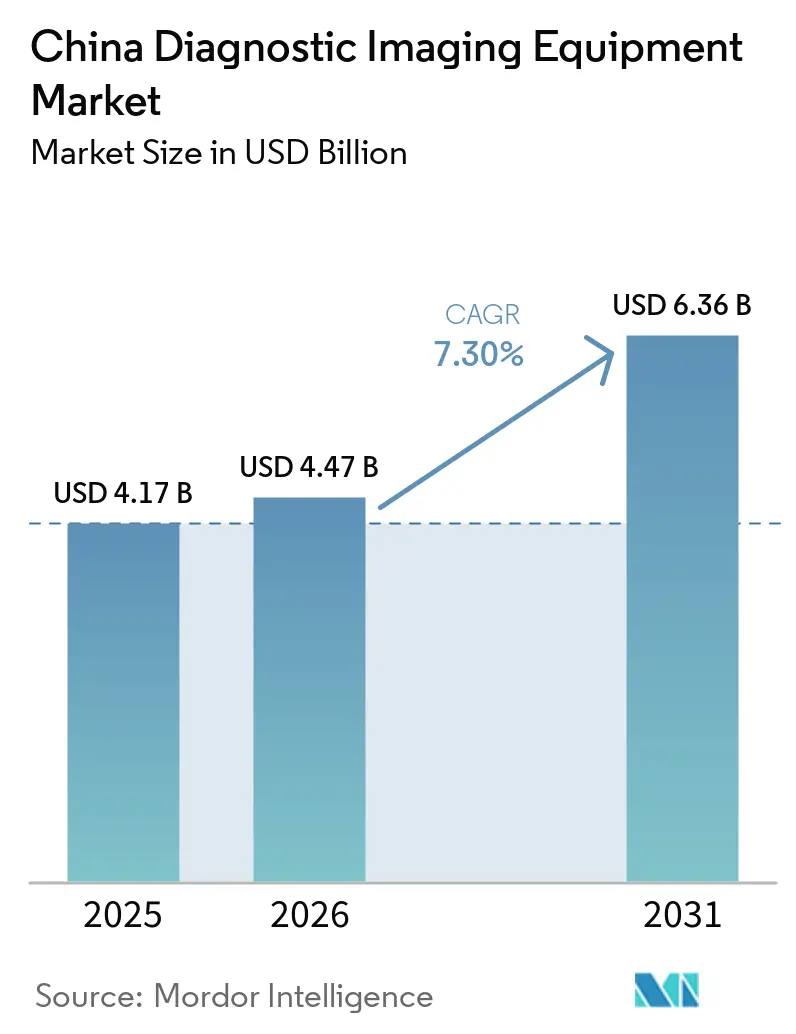
| Base Year Market Size (2025) | USD 4.17 Billion |
| Market Size (2026) | USD 4.47 Billion |
| Market Size (2031) | USD 6.36 Billion |
| Growth Rate (2026 - 2031) | 7.30% CAGR |
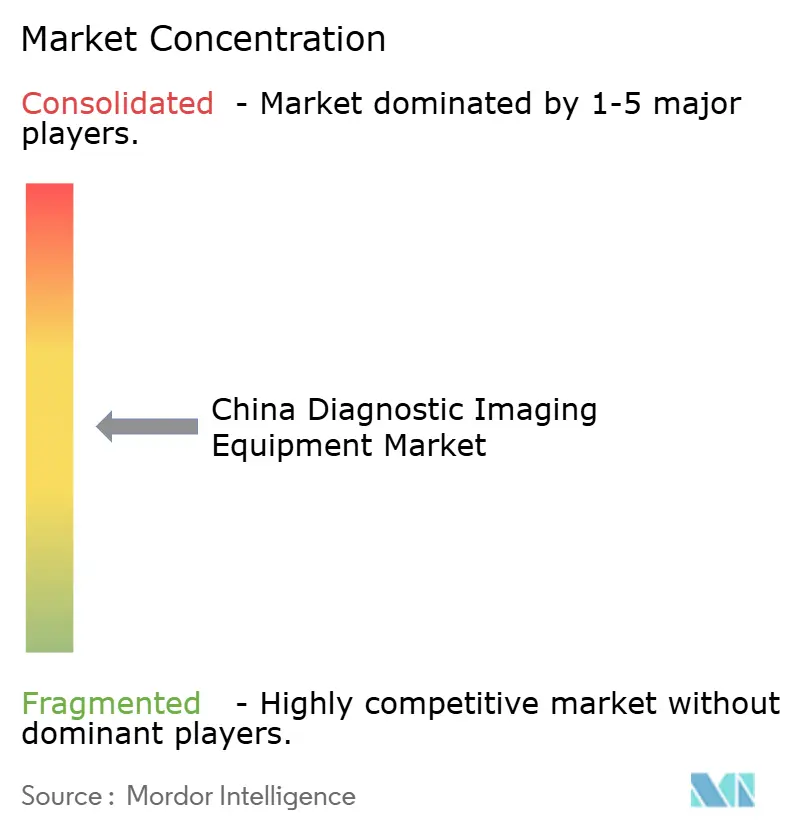
| Market Concentration | Medium |
Major Players *Disclaimer: Major Players sorted in no particular order Image © Mordor Intelligence. Reuse requires attribution under CC BY 4.0. | |
China Diagnostic Imaging Equipment Market Analysis by Mordor Intelligence
The China diagnostic imaging equipment market size is projected to expand from USD 4.17 billion in 2025 and USD 4.47 billion in 2026 to USD 6.36 billion by 2031, registering a 7.30% CAGR between 2026 and 2031. Intensifying disease burdens, accelerating regulatory approvals, and subsidy-backed equipment upgrades are reinforcing steady capital expenditure despite pricing pressure. County-level hospitals that previously lacked computed-tomography (CT) and magnetic-resonance-imaging (MRI) systems now qualify for 50% procurement subsidies, while tertiary centers invest in photon-counting CT and ultra-high-field MRI to capture oncology and neurology referrals. Volume-Based Procurement (VOBP) has triggered 20%–30% price cuts on mid-range hardware, pushing manufacturers toward recurring software revenue. Artificial-intelligence (AI) diagnostic aids that reduce radiologist reading time by up to 50% support larger daily volumes and strengthen the business case for premium scanners.
Key Report Takeaways
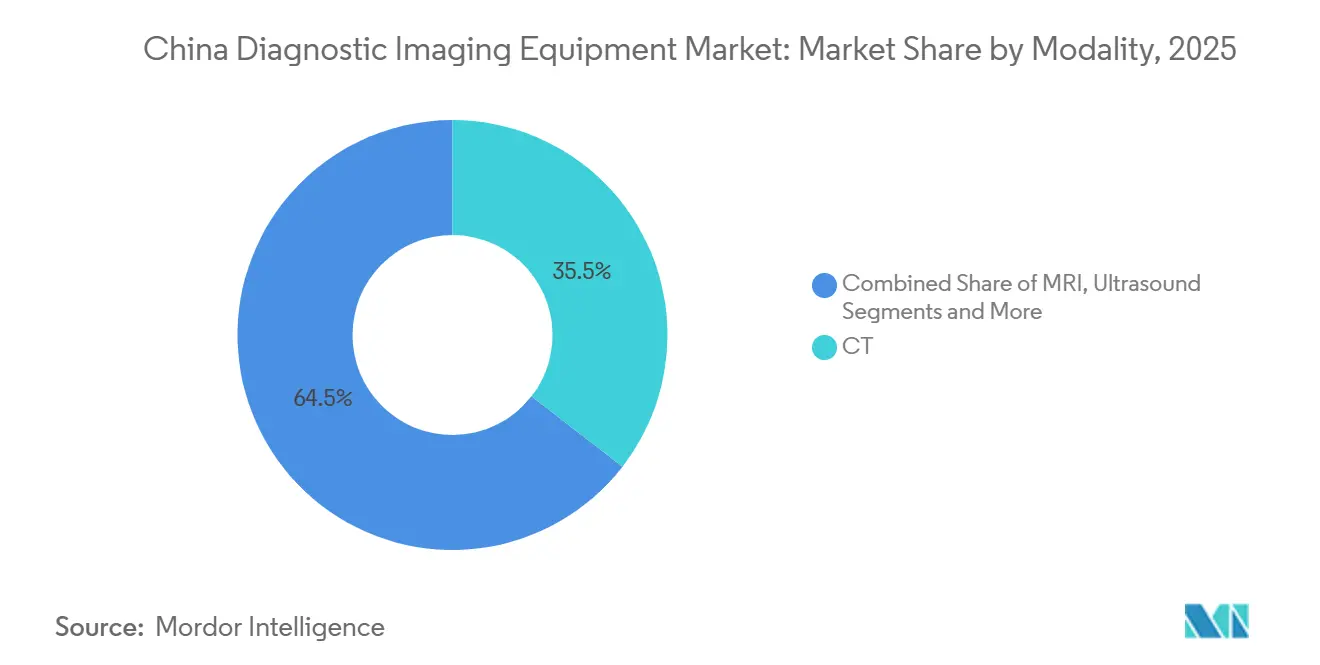
- By modality, CT led with 35.55% of the China diagnostic imaging equipment market share in 2025, while MRI is projected at a 10.25% CAGR through 2031.
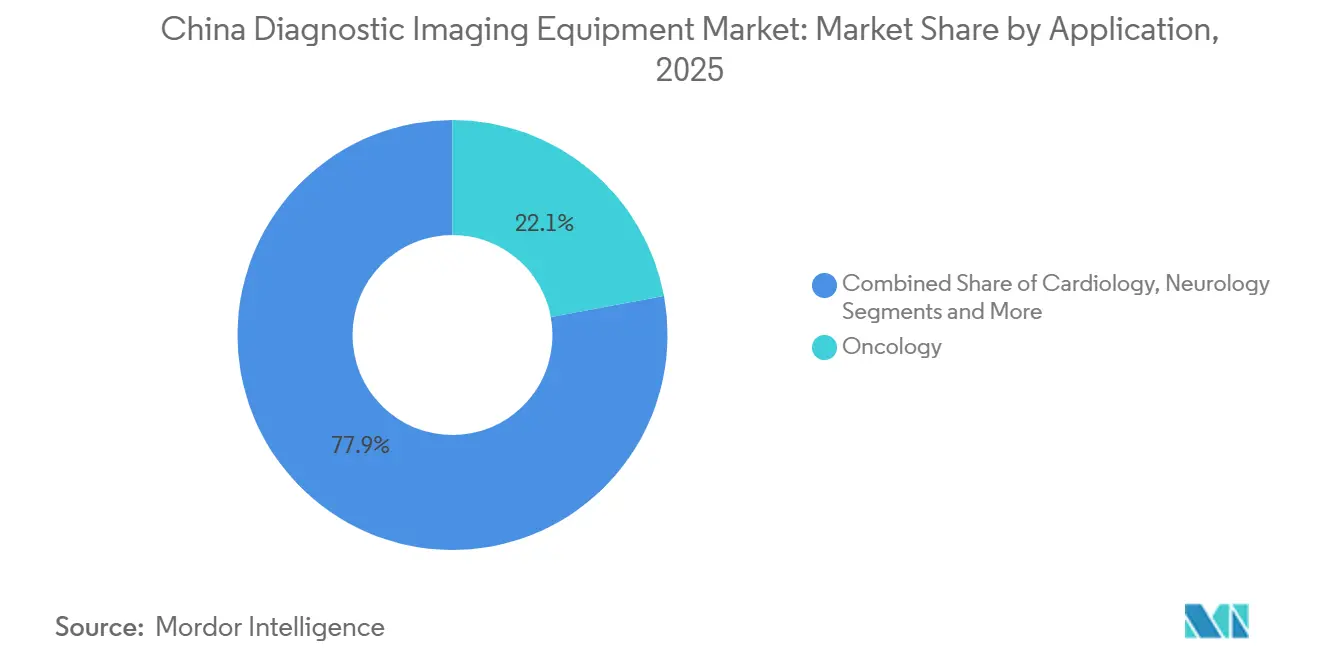
- By application, oncology reported a 22.15% share in 2025, whereas emergency medicine is forecast to post the fastest 10.82% CAGR through 2031.
- By portability, fixed systems retained 60.53% share of the China diagnostic imaging equipment market size in 2025, while handheld ultrasound is advancing at a 10.75% CAGR.
- By end user, hospitals commanded 67.65% spending in 2025, whereas diagnostic imaging centers are expanding at an 8.32% CAGR.
Note: Market size and forecast figures in this report are generated using Mordor Intelligence’s proprietary estimation framework, updated with the latest available data and insights as of 2026.
China Diagnostic Imaging Equipment Market Trends and Insights
Drivers Impact Analysis*
| Driver | (~) % Impact on CAGR Forecast | Geographic Relevance | Impact Timeline |
|---|---|---|---|
| Rise in prevalence of chronic diseases | +1.8% | National, with concentration in eastern urban centers (Beijing, Shanghai, Guangzhou) | Medium term (2-4 years) |
| Growing geriatric population | +1.5% | National, accelerating in Jiangsu, Zhejiang, and Sichuan provinces | Long term (≥ 4 years) |
| Government equipment-upgrade subsidies & DRG roll-out | +2.0% | National, prioritizing county-level hospitals in Tier-3 cities and rural areas | Short term (≤ 2 years) |
| AI-driven productivity gains easing radiologist shortage | +1.2% | National, early adoption in Tier-1 hospital networks (Beijing, Shanghai, Shenzhen) | Medium term (2-4 years) |
| National AI imaging pilot reimbursements | +0.6% | Provincial pilots in Zhejiang, Guangdong, and Shanghai | Medium term (2-4 years) |
| Domestic photon-counting CT breakthroughs enabling import substitution | +0.9% | National, led by Tier-1 and Tier-2 city tertiary hospitals | Short term (≤ 2 years) |
| Source: Mordor Intelligence | |||
Rise In Prevalence Of Chronic Diseases
China recorded 3.25 million new cancer cases and 330 million cardiovascular patients in 2024, anchoring a vast, recurrent imaging requirement[1]National Cancer Center, “2024 Cancer Statistics Report,” cicams.ac.cn. Annual low-dose CT for high-risk lung-cancer cohorts and 24/7 stroke-center CT availability hardwire imaging into clinical pathways. Procedure volumes underscore scale: 1.421 million percutaneous-coronary interventions and 1.539 million coronary angiographies in 2024 each demanded pre-procedural CT angiography or fluoroscopy guidance. Serial PET/CT for immunotherapy monitoring and iterative trauma follow-up sustain equipment utilization, while national oncology-screening guidelines institutionalize demand.
Growing Geriatric Population
Seniors aged 60 and above numbered 297 million (21.1% of population) in 2025 and will exceed 400 million by 2035. Multimorbidity among older adults drives orthopedic X-ray, brain MRI, and carotid ultrasound orders. The Healthy Aging Action Plan embeds imaging into preventive care, mandating annual mammography, low-dose lung CT, and ultrasound vascular checks. Provinces already above 20% elderly share are channeling subsidies into low-field MRI suites and portable ultrasound fleets to serve frail patients.
Government Equipment-Upgrade Subsidies & DRG Roll-Out
The State Council’s March 2024 upgrade initiative opened a CNY 5 trillion (USD 700 billion) domestic replacement pool, reimbursing half the sticker price for qualifying China-made devices. Diagnosis-Related Group (DRG) payments reward high-throughput scanners that cut length of stay; hospitals rushing to meet DRG cost ceilings now prefer dual-energy CT and AI-assisted MRI that reduce rescans. Subsidies skew procurement toward United Imaging, Mindray, and Neusoft, reshaping competitive order.
AI-Driven Productivity Gains Easing Radiologist Shortage
Radiologist density remains 1.5 per 10,000 people, far below the U.S. benchmark of 4.2. Fifty-nine NMPA-cleared AI algorithms cut reading time by 30%–50% and lift diagnostic accuracy up to 15%, enabling radiologists to process 20%–30% more studies per shift. Vendors bundle AI subscriptions, Siemens’ AI-Rad Companion, GE’s Edison, with scanners, converting one-off hardware deals into annuity revenue.
Restraints Impact Analysis*
| Restraint | (~) % Impact on CAGR Forecast | Geographic Relevance | Impact Timeline |
|---|---|---|---|
| High acquisition & lifetime ownership costs | -1.0% | National, acute in Tier-3 cities and county hospitals with limited capital budgets | Short term (≤ 2 years) |
| Radiation / contrast-agent safety concerns | -0.4% | National, heightened scrutiny in pediatric and obstetric imaging protocols | Medium term (2-4 years) |
| VOBP price compression squeezing OEM margins | -0.8% | National, affecting all device categories under centralized procurement | Short term (≤ 2 years) |
| Inter-provincial inequality of device availability | -0.5% | Western and central provinces (Gansu, Guizhou, Ningxia) with lower per-capita health spending | Long term (≥ 4 years) |
| Tightening data-residency rules on cloud-PACS suppliers | -0.3% | National, with enforcement concentrated in Tier-1 cities and sensitive healthcare data hubs | Medium term (2-4 years) |
| Source: Mordor Intelligence | |||
High acquisition and lifetime ownership costs
Buying a top tier scanner is expensive. A 3-Tesla MRI or a photon-counting CT typically costs more than USD 1 million, and the bills do not end there. When hospitals add ten years of service contracts, consumables and room renovations, the total spend can reach three times the sticker price. County hospitals feel this squeeze the most because their per-bed budgets are roughly one-third of what large urban centers can spend. Day-to-day running costs add fresh pressure. A standard MRI magnet uses about 1,500 liters of liquid helium each year, and with prices at CNY 200 (USD 28) per liter the annual helium bill alone is nearly CNY 300,000 (USD 42,000). Philips introduced a helium-free 1.5-Tesla MRI in 2025 that removes this expense, yet the unit itself is priced about 15% higher than older helium-based models. Flexible financing would help, but fewer than 10% of Chinese scanners are leased, compared with roughly 30% in Western Europe, so smaller institutions have limited options. Government subsidies offset part of the upfront price, however the programs favor domestic brands and exclude refurbished systems, which narrows choice and keeps aging fleets in service longer.
Radiation and contrast-agent safety concerns
Regulators set dose reference levels for every CT exam, yet a 2024 audit found that 18% of scans still exceeded the limits, most often in pediatric and emergency cases where protocols are harder to tailor. Repeated exposure adds up. Cancer patients and trauma victims who undergo many follow-up studies face a higher lifetime radiation risk, so the National Health Commission released new guidelines that emphasize iterative reconstruction and automatic exposure control to keep doses low. Contrast media bring their own issues. Iodinated dyes used in CT angiography cause kidney injury in 2%–5% of patients, especially those who are elderly or have diabetes, and evidence of gadolinium deposits in the brain prompted an advisory to switch from linear to macrocyclic MRI agents. Hospitals are turning to spectral CT and AI denoising software that allow lower kilovoltage or fewer projections, but the extra validation work and higher purchase prices slow adoption. Legal exposure is also rising. Malpractice claims linked to contrast reactions grew 12% in 2024, so many procurement teams now wait for longer safety data before upgrading scanners, which lengthens replacement cycles.
*Our forecasts treat driver/restraint impacts as directional, not additive. The impact forecasts reflect baseline growth, mix effects, and variable interactions.
Segment Analysis
By Modality: Photon-Counting CT And Ultra-High-Field MRI Redefine Premium Tiers
CT captured 35.55% of the China diagnostic imaging equipment market share in 2025 as photon-counting technology elevates diagnostic precision. High-slice and spectral capabilities compress scan times from 15 to 8 minutes, freeing capacity and lowering DRG costs. MRI is projected to grow at a 10.25% CAGR, with ultra-high-field platforms revealing microstructural pathology that 1.5-Tesla systems miss. Siemens’ new 7-Tesla MRI and Philips’ multinuclear MR7700 are piloting cardiology and neurology protocols[2]Philips, “MR-7700 Launch Press Release,” philips.com . Low-field MRI continues serving claustrophobic or pediatric cohorts, maintaining balanced modality mix.
The segment focuses on various imaging modalities, including ultrasound, X-ray, nuclear medicine, and fluoroscopy. Notably, digital radiography dominates with a majority share of new installations. Meanwhile, the growth of PET imaging closely follows the pace of approvals for novel tracers. Dual-modality PET/CT fills oncology and cardiology gaps, and 3-D breast tomosynthesis meets dose-optimization rules. Vendors that pair modality hardware with AI analytics defend margins against commoditizing mid-range segments.


By Portability: Handheld Ultrasound Disrupts Fixed-System Economics
Fixed scanners held 60.53% of the China diagnostic imaging equipment market size in 2025, but handheld and mobile platforms are poised for a 10.75% CAGR through 2031. Residency curricula mandating point-of-care ultrasound generate 5,000 newly certified users each year, expanding orders for Butterfly iQ+ and Mindray Resona handhelds.
Hospitals still rely on fixed 3-Tesla MRI suites that process 25 patients daily at scale, while mobile CT trailers service rural screening and disaster relief. Modular designs such as GE’s Venue series let providers migrate from cart-based to pocket-sized probes without workflow upheaval.
By Application: Emergency Medicine Outpaces Oncology Growth
Oncology retained 22.15% share in 2025, yet emergency medicine will rise fastest at 10.82% CAGR as stroke-center standards require sub-20-minute door-to-imaging times. County hospitals failing audits are procuring dual-source CT and rapid-sequence MRI to comply, enlarging the China diagnostic imaging equipment market.
Cardiology shifts toward coronary CT angiography, while neurology expands with dementia imaging and amyloid-PET adoption. Orthopedics, gastroenterology, and obstetrics round out diversified demand; 3-D/4-D prenatal ultrasound volumes continue climbing under updated fetal-imaging protocols.
By End User: Diagnostic Imaging Centers Gain Private-Capital Momentum
Hospitals contributed 67.65% of 2025 spending, but private imaging centers are scaling 8.32% annually on radiology-as-a-service models. Independent chains offer chest CT for CNY 300 versus hospital rates of CNY 500, leveraging extended hours and AI triage to cut wait times from 2 weeks to 3 days.
DRG reform that equalizes reimbursement across venues will accelerate volume migration to centers equipped with photon-counting CT and 3-Tesla MRI. Tele-radiology partnerships blur boundaries: county hospitals own scanners yet outsource reads to city-based centers, expanding the China diagnostic imaging equipment industry ecosystem.
Geography Analysis
Eastern provinces deploy 6.4 CT scanners per million residents versus 2.1 in western regions, mirroring MRI gaps of 3.8 to 1.2 units. Tier-1 cities host Siemens Naeotom Alpha and GE Revolution Apex installations, funded by DRG efficiency gains. Tier-2 strongholds such as Hangzhou and Chengdu gravitate toward lower-priced domestic photon-counting CT that undercuts imports by 30%.
Western provinces receive CNY 10 billion in subsidies for 64-slice CT and 1.5-Tesla MRI, yet procurement plus training stretches impact to 2026-plus. Central provinces bridge extremes, relying on AI algorithms to offset radiologist shortages. Coastal Zhejiang pilots AI imaging reimbursement at CNY 50–100 per study, paving the way for national adoption and geographically balancing demand.
Competitive Landscape
Multinationals, Siemens Healthineers, GE HealthCare, Philips, anchor premium tiers through installed-base lock-in, yet domestic leaders, United Imaging, Mindray, Neusoft, expand share via price-performance and subsidy alignment. Siemens invested CNY 1 billion in Shenzhen production in January 2025 to gain “Made in China” status[3]Siemens Healthineers, “Shenzhen Manufacturing Expansion,” siemens-healthineers.com. GE opened a CNY 500 million MRI R&D hub in Tianjin in December 2025, targeting local workflow customization.
Strategic whitespace lies in AI subscriptions and handheld ultrasound where penetration is below 5%. Compliance with data-residency mandates raises barriers for foreign cloud-PACS suppliers, advantaging Neusoft and Winning Health with domestic data centers.
China Diagnostic Imaging Equipment Industry Leaders
Canon Medical Systems Corporation
Koninklijke Philips N.V.
Siemens Healthineers AG
GE HealthCare
Shenzhen Mindray Bio-Medical Electronics Co., Ltd
- *Disclaimer: Major Players sorted in no particular order

Recent Industry Developments
- December 2025: GE HealthCare opened a CNY 500 million MRI R&D center in Tianjin to speed localized product cycles.
- August 2025: Neusoft Medical won NMPA clearance for its NeuViz Epoch photon-counting CT, China’s first domestic system in this class.


China Diagnostic Imaging Equipment Market Report Scope
As per the scope of the report, diagnostic imaging captures images of the internal structure of the human body using electromagnetic radiation for an accurate diagnosis. There are various types of medical imaging, the most common ones being CT scanners, MRI systems, etc.
The China diagnostic imaging equipment market is segmented by modality, portability, application, and end user. By modality, the market is categorized into MRI (low/mid-field <1.5 T, high-field 1.5–3 T, and ultra-high-field >3 T), CT (low-slice <32, mid-slice 32–128, and high-slice >128 & photon-counting), ultrasound (2-D, 3-D/4-D, and hand-held & POCUS), X-ray (analog and digital DR/CR), nuclear imaging (PET and SPECT), fluoroscopy, and mammography. By portability, the market is divided into fixed systems and mobile & hand-held systems. By application, the market includes cardiology, oncology, neurology, orthopedics, gastroenterology, gynecology & obstetrics, emergency medicine, and other applications. By end user, the market is segmented into hospitals, diagnostic imaging centers, and other end-users. The report offers the market size and forecasts in value (USD) for the above segments.
By Modality
| MRI | Low / Mid-field (<1.5 T) |
| High-field (1.5-3 T) | |
| Ultra-high-field (>3 T) | |
| CT | Low-slice (<32) |
| Mid-slice (32-128) | |
| High-slice (>128 & photon-counting) | |
| Ultrasound | 2-D |
| 3-D / 4-D | |
| Hand-held & POCUS | |
| X-ray | Analog |
| Digital (DR / CR) | |
| Nuclear Imaging | PET |
| SPECT | |
| Fluoroscopy | |
| Mammography |
By Portability
| Fixed Systems |
| Mobile & Hand-held Systems |
By Application
| Cardiology |
| Oncology |
| Neurology |
| Orthopedics |
| Gastroenterology |
| Gynecology & Obstetrics |
| Emergency Medicine |
| Other Applications |
By End User
| Hospitals |
| Diagnostic Imaging Centres |
| Other End-users |
| By Modality | MRI | Low / Mid-field (<1.5 T) |
| High-field (1.5-3 T) | ||
| Ultra-high-field (>3 T) | ||
| CT | Low-slice (<32) | |
| Mid-slice (32-128) | ||
| High-slice (>128 & photon-counting) | ||
| Ultrasound | 2-D | |
| 3-D / 4-D | ||
| Hand-held & POCUS | ||
| X-ray | Analog | |
| Digital (DR / CR) | ||
| Nuclear Imaging | PET | |
| SPECT | ||
| Fluoroscopy | ||
| Mammography | ||
| By Portability | Fixed Systems | |
| Mobile & Hand-held Systems | ||
| By Application | Cardiology | |
| Oncology | ||
| Neurology | ||
| Orthopedics | ||
| Gastroenterology | ||
| Gynecology & Obstetrics | ||
| Emergency Medicine | ||
| Other Applications | ||
| By End User | Hospitals | |
| Diagnostic Imaging Centres | ||
| Other End-users | ||


Key Questions Answered in the Report
What is the projected value of the China diagnostic imaging equipment market by 2031?
It is forecast to reach USD 6.36 billion by 2031.
Which modality currently leads sales in China?
CT systems, with a 35.55% share in 2025.
Why are handheld ultrasound devices growing quickly?
Residency training requirements and lower unit prices are driving a 10.75% CAGR through 2031 for handheld ultrasound.
How does DRG payment reform influence equipment demand?
DRG bundles reward high-throughput scanners, prompting hospitals to buy faster CT and MRI systems for cost containment.
Which companies are disrupting the premium CT segment?
United Imaging and Neusoft with newly cleared photon-counting CT systems priced 30%-40% below imports.
What regulatory trend affects cloud-based image storage?
Data-residency laws require in-country servers and multi-level protection certification, favoring domestic PACS vendors.
Page last updated on:


