China Dairy Market Size
Market Overview
| Study Period | 2017 - 2030 |
| Base Year For Estimation | 2024 |
| Forecast Data Period | 2025 - 2030 |
| Market Size (2025) | USD 74.18 Billion |
| Market Size (2030) | USD 91.11 Billion |
| Growth Rate (2025 - 2030) | 4.20% CAGR |
| Market Concentration | Medium |
Major Players*Disclaimer: Major Players sorted in no particular order Image © Mordor Intelligence. Reuse requires attribution under CC BY 4.0. |
|

China Dairy Market Analysis
The China Dairy Market size is estimated at 74.18 billion USD in 2025, and is expected to reach 91.11 billion USD by 2030, growing at a CAGR of 4.20% during the forecast period (2025-2030).
The China Dairy Industry is experiencing significant transformation driven by evolving retail infrastructure and changing consumer preferences. Supermarkets and hypermarkets dominate the distribution landscape, accounting for 64% of the value share in 2023, supported by their extensive network of over 24,685 retail outlets across the country. The retail sector's modernization is further evidenced by the aggressive expansion of international chains like Walmart, which operates more than 400 stores in China, while domestic players like Meiyijia have established a formidable presence with approximately 30,000 stores as of January 2023. This retail evolution has created a more sophisticated and accessible dairy market, offering consumers unprecedented product variety and convenience.
The foodservice sector has emerged as a crucial growth driver for dairy consumption, particularly through quick-service restaurants and café chains. The market's dynamics are shaped by an extensive network of foodservice establishments, with major players like KFC operating over 8,100 outlets, Starbucks maintaining 6,000 locations, and McDonald's running 4,500 stores across China. These establishments have become significant channels for dairy products consumption, particularly for products like cheese, butter, and dairy desserts, contributing to the projected 9.7% growth in on-trade channel sales by 2025 compared to 2022.
Digital transformation is revolutionizing dairy product distribution and consumption patterns in China. The e-commerce channel has gained substantial traction, with approximately 54% of Chinese consumers preferring online platforms for food product purchases, including dairy items. This shift is driving substantial investment in digital infrastructure and cold chain logistics, with major platforms like Tmall Global, JD Worldwide, and Pinduoduo expanding their dairy product offerings through various marketing initiatives including group buying schemes and live streaming promotions.
The market is witnessing a notable shift in consumer preferences towards premium and specialized dairy products. Traditional retail channels are adapting to this trend by dedicating specialized sections for dairy products and implementing advanced refrigeration systems to maintain product quality. This evolution is particularly evident in the milk category, which dominates off-trade retail channels with a 54.5% share of the total category in 2022. The trend is further supported by the expansion of specialty stores and premium retail outlets that focus on providing high-quality dairy products and personalized customer experiences, catering to increasingly sophisticated consumer demands for premium dairy offerings.
China Dairy Market Trends
Growing health awareness in the country boosting the consumption of dairy and dairy products
- Consumer preference is influenced by food-based dietary guidelines, which suggest the consumption requirements of dairy. The Dietary Guidance for Chinese Residents recommends a daily intake of 300 grams of dairy products on a fluid milk basis, indicating the potential for continued growth in dairy consumption in the country. Raw milk production is mainly concentrated in northern China, followed by southern and eastern China. Cheese is popular among the dairy products consumed due to strong demand from restaurants as there is an inclination toward Western-style food like pizza, burgers, pasta, sandwiches, and tacos. The per capita consumption of cheese is estimated to increase by 7.10% from 2023 to 2024.
- Growing health consciousness among consumers is also boosting dairy consumption in China, especially post the COVID-19 outbreak. China Customs indicated that China bought 176,000 metric tons of cheese from foreign countries in 2021, up by 36.3% from 2020, with New Zealand, Australia, and Denmark as the top three exporters. Owing to the increasing per capita yogurt consumption, companies are focusing on developing yogurt products with gluten-free and non-GMO claims. Plain yogurts are also available in non-fat, low-fat, and whole-milk variants, as per consumer choice, and can be used in dips, smoothies, and baked foods. Pasteurized milk and yogurt were added to the National School Milk Program in 2021, which supports the demand for these products. The changing lifestyles of consumers and eating habits are boosting the demand for ready-to-use products such as milk powder due to the associated convenience factor. The per capita consumption of milk powder is estimated to increase by 1.14% from 2023 to 2024.

OTHER KEY INDUSTRY TRENDS COVERED IN THE REPORT
- Increasing demand for local ingredients from food manufacturers boosts butter production in the country
- China's milk production is increasing due to large domestic production, a slowing economy, and relatively high global dairy prices.
- Growth in the nation's cheese production due to the significant milk production growth
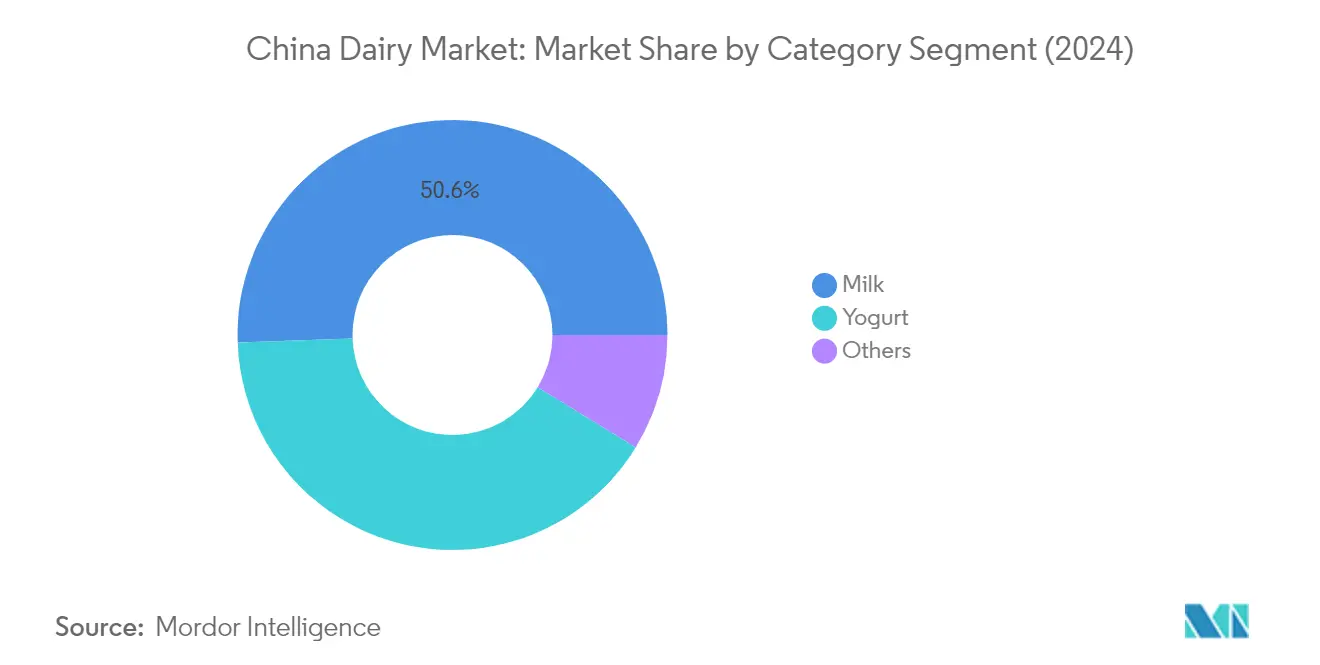
Segment Analysis: Category
Milk Segment in China Dairy Market
The milk segment continues to dominate the China dairy market, accounting for approximately 51% of the total market value in 2024. This substantial market share can be attributed to milk being one of the primary grocery staples in Chinese households and its significant role in daily nutrition. The government's implementation of strict food safety regulations has strengthened customer reliance on dairy products, supporting the expansion of domestic production. Large dairy farms contribute about 60-70% of China's fluid milk production, with middle-sized and smaller dairy farms producing the remaining 30-40%. The segment's strong position is further reinforced by the increasing adoption of various milk types, including UHT milk, flavored milk, and fresh dairy, catering to diverse consumer preferences and lifestyle needs.
Cheese Segment in China Dairy Market
The cheese segment is emerging as the most dynamic category in China's dairy market, projected to achieve remarkable growth during 2024-2029. This growth is primarily driven by the increasing adoption of Western dietary habits and the rising popularity of cheese-based foods in urban areas. The segment's expansion is particularly notable in processed cheese products, which are gaining traction among younger consumers. Major food manufacturers are actively developing cheese products tailored to local tastes, while also introducing international cheese varieties to the Chinese market. The growth is further supported by the expanding quick-service restaurant sector and the increasing use of cheese in various Chinese culinary applications, marking a significant shift in traditional dietary patterns.
Remaining Segments in China Dairy Market
The other segments in China's dairy market, including yogurt, cream, dairy desserts, and butter, each play distinct roles in shaping the overall market landscape. Yogurt stands as a significant contributor, particularly popular among health-conscious consumers and benefiting from the growing probiotic food trend. The cream segment serves both retail and foodservice sectors, especially gaining momentum with the rising home-baking trend. Dairy desserts cater to the growing demand for premium and innovative dairy products, while the butter segment primarily serves the commercial baking industry and household consumption. These segments collectively contribute to the market's diversity and cater to evolving consumer preferences across different demographic groups.
Segment Analysis: Distribution Channel
Off-trade Segment in China Dairy Market
The off-trade segment dominates the Chinese dairy market, commanding approximately 92% of the total market value in 2024. This substantial market share is primarily driven by the extensive network of supermarkets and hypermarkets, which account for nearly 64% of off-trade sales. Consumer preference for these channels is influenced by seasonal offers, bulk purchase discounts, and access to diversified products through dedicated dairy sections. The segment's growth is further supported by the rapid expansion of modern retail formats across China, with supermarkets maintaining a strong position due to their wide selection of brands, considerable shelf space, and frequent price promotions. Additionally, the emergence of online retail channels and the increasing adoption of e-commerce platforms have significantly contributed to the segment's dominance, with major dairy brands expanding their online presence to capture a larger market share. The segment is projected to maintain its leading position with an expected growth rate of around 4% during 2024-2029, driven by the increasing penetration of organized retail and the growing trend of online grocery shopping.
On-trade Segment in China Dairy Market
The on-trade segment plays a crucial role in the Chinese dairy market, particularly through foodservice establishments such as cafes, restaurants, and quick-service restaurants (QSRs). The segment's significance is underscored by the extensive presence of major chains like Starbucks, which operates over 10,000 outlets, and Costa Coffee with more than 450 locations across China. These establishments drive the consumption of various dairy products, including milk for beverages, cheese for food preparation, and dairy desserts. The segment's growth is further supported by the expanding network of QSR chains, with KFC leading the category with more than 8,100 outlets, followed by Starbucks and McDonald's with 6,000 and 4,500 locations respectively. The continuous expansion of these foodservice chains, coupled with the growing trend of eating out and the increasing popularity of dairy-based beverages, positions the on-trade segment for sustained growth in the Chinese market.
China Dairy Industry Overview
Top Companies in China Dairy Market
The Chinese dairy market is led by major players, including Inner Mongolia Yili Industrial Group, China Mengniu Dairy Company, Bright Food Group, Want Want Holdings, Nestlé, and Danone. These Chinese dairy companies are actively pursuing product innovation through the introduction of functional dairy products, fortified formulations, and novel flavors to meet evolving consumer preferences. Operational agility is demonstrated through investments in advanced dairy manufacturing facilities, cold chain infrastructure, and digital transformation initiatives. Strategic moves focus on strengthening distribution networks, particularly in tier 2 and tier 3 cities, while expanding e-commerce presence through partnerships with major platforms. Companies are also emphasizing sustainability through initiatives in packaging reduction, responsible sourcing, and carbon footprint management, while simultaneously expanding production capacity through new facility investments and modernization of existing plants.
Local Giants Dominate Consolidated Dairy Market
The Chinese dairy market exhibits a high level of consolidation, with domestic players holding dominant positions, particularly in the liquid milk and yogurt segments. Local dairy giants have leveraged their deep understanding of consumer preferences, established distribution networks, and strong brand recognition to maintain market leadership. These companies benefit from government support in modernizing dairy farming practices and implementing food safety standards, while global players like Nestlé and Danone maintain their presence through premium positioning and specialized product offerings.
The market has witnessed significant merger and acquisition activity aimed at vertical integration and geographical expansion. Leading domestic players are acquiring smaller regional dairy companies to expand their production capacity and market reach, while also investing in overseas acquisitions to secure quality milk supply and access advanced dairy technology. International players are pursuing joint ventures with local companies to overcome market entry barriers and leverage established distribution networks, contributing to further market consolidation.
Innovation and Distribution Drive Market Success
Success in the Chinese dairy market increasingly depends on companies' ability to innovate across product categories while maintaining strong quality standards and food safety compliance. Market leaders are investing heavily in research and development to create differentiated dairy products targeting specific consumer segments, from health-conscious urban professionals to children and elderly consumers. Building robust cold chain infrastructure and expanding distribution reach, particularly in lower-tier cities and rural areas, remains crucial for maintaining market share. Companies are also focusing on developing direct-to-consumer channels through digital platforms while strengthening relationships with traditional retail partners.
Future market success will require companies to navigate increasing regulatory scrutiny around food safety and environmental sustainability while adapting to changing consumer preferences. Contenders looking to gain market share must focus on building trust through transparency in sourcing and production processes, while developing unique value propositions in niche segments. The ability to manage raw material costs through strategic supplier relationships and efficient dairy processing processes will become increasingly important as competition intensifies. Companies must also prepare for potential regulatory changes regarding environmental protection and animal welfare standards, while maintaining flexibility to respond to shifts in consumer behavior and market dynamics.
China Dairy Market Leaders
-
Bright Food (Group) Co. Ltd
-
China Mengniu Dairy Company Limited
-
Inner Mongolia Yili Industrial Group Co. Ltd
-
Nestlé SA
-
Want Want Holdings Limited
- *Disclaimer: Major Players sorted in no particular order

China Dairy Market News
- September 2023: China Mengniu acquired organic infant formula producer Bellamy's Australia for USD 1 billion.
- July 2022: In order to produce fresh milk, infant formula, and cheese, Yili opened a dairy hub in the area where the business is based, in North China.
- March 2022: Inner Mongolia Yili Industrial Group Co., Ltd. introduced China's first zero-carbon milk, Satine A2β-casein Organic Pure Milk. The product received the PAS 2060 certification on carbon neutrality from Bureau Veritas.
Free With This Report
We provide a comprehensive and exhaustive set of data pointers for global, regional, and country-level metrics that illustrate the fundamentals of the dairy industry. With the help of 45+ free charts, clients can access in-depth market analysis based on per capita consumption numbers and production data of raw materials for dairy, through granular-level segmental information supported by a repository of market data, trends, and expert analysis. Data and analysis on dairy, categories of dairy products, product types, etc., are available in the form of comprehensive reports as well as excel based data worksheets.


List of Tables & Figures
- Figure 1:
- PER CAPITA CONSUMPTION OF MILK, BUTTER, CHEESE, KG, CHINA, 2017 - 2029
- Figure 2:
- PRODUCTION OF BUTTER, METRIC TONNES, CHINA, 2017 - 2021
- Figure 3:
- PRODUCTION OF CHEESE, METRIC TONNES, CHINA, 2017 - 2021
- Figure 4:
- PRODUCTION OF MILK, METRIC TONNES, CHINA, 2017 - 2021
- Figure 5:
- VOLUME OF DAIRY, METRIC TONNES, BY CHINA, 2017 - 2029
- Figure 6:
- VALUE OF DAIRY, USD, BY CHINA, 2017 - 2029
- Figure 7:
- VOLUME OF DAIRY MARKET BY CATEGORY, METRIC TONNES, CHINA, 2017 - 2029
- Figure 8:
- VALUE OF DAIRY MARKET BY CATEGORY, USD, CHINA, 2017 - 2029
- Figure 9:
- VOLUME SHARE OF DAIRY MARKET, BY CATEGORY , %, CHINA, 2017 VS 2023 VS 2029
- Figure 10:
- VALUE SHARE OF DAIRY MARKET, BY CATEGORY , %, CHINA, 2017 VS 2023 VS 2029
- Figure 11:
- VOLUME OF BUTTER MARKET BY PRODUCT TYPE, METRIC TONNES, CHINA, 2017 - 2029
- Figure 12:
- VALUE OF BUTTER MARKET BY PRODUCT TYPE, USD, CHINA, 2017 - 2029
- Figure 13:
- VOLUME SHARE OF BUTTER MARKET BY PRODUCT TYPE, %, CHINA, 2017 VS 2023 VS 2029
- Figure 14:
- VALUE SHARE OF BUTTER MARKET BY PRODUCT TYPE, %, CHINA, 2017 VS 2023 VS 2029
- Figure 15:
- VOLUME OF CULTURED BUTTER MARKET, METRIC TONNES, CHINA, 2017 - 2029
- Figure 16:
- VALUE OF CULTURED BUTTER MARKET, USD, CHINA, 2017 - 2029
- Figure 17:
- VALUE SHARE OF CULTURED BUTTER MARKET, BY DISTRIBUTION CHANNEL , %, CHINA, 2022 VS 2029
- Figure 18:
- VOLUME OF UNCULTURED BUTTER MARKET, METRIC TONNES, CHINA, 2017 - 2029
- Figure 19:
- VALUE OF UNCULTURED BUTTER MARKET, USD, CHINA, 2017 - 2029
- Figure 20:
- VALUE SHARE OF UNCULTURED BUTTER MARKET, BY DISTRIBUTION CHANNEL , %, CHINA, 2022 VS 2029
- Figure 21:
- VOLUME OF CHEESE MARKET BY PRODUCT TYPE, METRIC TONNES, CHINA, 2017 - 2029
- Figure 22:
- VALUE OF CHEESE MARKET BY PRODUCT TYPE, USD, CHINA, 2017 - 2029
- Figure 23:
- VOLUME SHARE OF CHEESE MARKET BY PRODUCT TYPE, %, CHINA, 2017 VS 2023 VS 2029
- Figure 24:
- VALUE SHARE OF CHEESE MARKET BY PRODUCT TYPE, %, CHINA, 2017 VS 2023 VS 2029
- Figure 25:
- VOLUME OF NATURAL CHEESE MARKET, METRIC TONNES, CHINA, 2017 - 2029
- Figure 26:
- VALUE OF NATURAL CHEESE MARKET, USD, CHINA, 2017 - 2029
- Figure 27:
- VALUE SHARE OF NATURAL CHEESE MARKET, BY DISTRIBUTION CHANNEL , %, CHINA, 2022 VS 2029
- Figure 28:
- VOLUME OF PROCESSED CHEESE MARKET, METRIC TONNES, CHINA, 2017 - 2029
- Figure 29:
- VALUE OF PROCESSED CHEESE MARKET, USD, CHINA, 2017 - 2029
- Figure 30:
- VALUE SHARE OF PROCESSED CHEESE MARKET, BY DISTRIBUTION CHANNEL , %, CHINA, 2022 VS 2029
- Figure 31:
- VOLUME OF CREAM MARKET BY PRODUCT TYPE, METRIC TONNES, CHINA, 2017 - 2029
- Figure 32:
- VALUE OF CREAM MARKET BY PRODUCT TYPE, USD, CHINA, 2017 - 2029
- Figure 33:
- VOLUME SHARE OF CREAM MARKET BY PRODUCT TYPE, %, CHINA, 2017 VS 2023 VS 2029
- Figure 34:
- VALUE SHARE OF CREAM MARKET BY PRODUCT TYPE, %, CHINA, 2017 VS 2023 VS 2029
- Figure 35:
- VOLUME OF DOUBLE CREAM MARKET, METRIC TONNES, CHINA, 2017 - 2029
- Figure 36:
- VALUE OF DOUBLE CREAM MARKET, USD, CHINA, 2017 - 2029
- Figure 37:
- VALUE SHARE OF DOUBLE CREAM MARKET, BY DISTRIBUTION CHANNEL , %, CHINA, 2022 VS 2029
- Figure 38:
- VOLUME OF SINGLE CREAM MARKET, METRIC TONNES, CHINA, 2017 - 2029
- Figure 39:
- VALUE OF SINGLE CREAM MARKET, USD, CHINA, 2017 - 2029
- Figure 40:
- VALUE SHARE OF SINGLE CREAM MARKET, BY DISTRIBUTION CHANNEL , %, CHINA, 2022 VS 2029
- Figure 41:
- VOLUME OF WHIPPING CREAM MARKET, METRIC TONNES, CHINA, 2017 - 2029
- Figure 42:
- VALUE OF WHIPPING CREAM MARKET, USD, CHINA, 2017 - 2029
- Figure 43:
- VALUE SHARE OF WHIPPING CREAM MARKET, BY DISTRIBUTION CHANNEL , %, CHINA, 2022 VS 2029
- Figure 44:
- VOLUME OF OTHERS MARKET, METRIC TONNES, CHINA, 2017 - 2029
- Figure 45:
- VALUE OF OTHERS MARKET, USD, CHINA, 2017 - 2029
- Figure 46:
- VALUE SHARE OF OTHERS MARKET, BY DISTRIBUTION CHANNEL , %, CHINA, 2022 VS 2029
- Figure 47:
- VOLUME OF DAIRY DESSERTS MARKET BY PRODUCT TYPE, METRIC TONNES, CHINA, 2017 - 2029
- Figure 48:
- VALUE OF DAIRY DESSERTS MARKET BY PRODUCT TYPE, USD, CHINA, 2017 - 2029
- Figure 49:
- VOLUME SHARE OF DAIRY DESSERTS MARKET BY PRODUCT TYPE, %, CHINA, 2017 VS 2023 VS 2029
- Figure 50:
- VALUE SHARE OF DAIRY DESSERTS MARKET BY PRODUCT TYPE, %, CHINA, 2017 VS 2023 VS 2029
- Figure 51:
- VOLUME OF CHEESECAKES MARKET, METRIC TONNES, CHINA, 2017 - 2029
- Figure 52:
- VALUE OF CHEESECAKES MARKET, USD, CHINA, 2017 - 2029
- Figure 53:
- VALUE SHARE OF CHEESECAKES MARKET, BY DISTRIBUTION CHANNEL , %, CHINA, 2022 VS 2029
- Figure 54:
- VOLUME OF FROZEN DESSERTS MARKET, METRIC TONNES, CHINA, 2017 - 2029
- Figure 55:
- VALUE OF FROZEN DESSERTS MARKET, USD, CHINA, 2017 - 2029
- Figure 56:
- VALUE SHARE OF FROZEN DESSERTS MARKET, BY DISTRIBUTION CHANNEL , %, CHINA, 2022 VS 2029
- Figure 57:
- VOLUME OF ICE CREAM MARKET, METRIC TONNES, CHINA, 2017 - 2029
- Figure 58:
- VALUE OF ICE CREAM MARKET, USD, CHINA, 2017 - 2029
- Figure 59:
- VALUE SHARE OF ICE CREAM MARKET, BY DISTRIBUTION CHANNEL , %, CHINA, 2022 VS 2029
- Figure 60:
- VOLUME OF MOUSSES MARKET, METRIC TONNES, CHINA, 2017 - 2029
- Figure 61:
- VALUE OF MOUSSES MARKET, USD, CHINA, 2017 - 2029
- Figure 62:
- VALUE SHARE OF MOUSSES MARKET, BY DISTRIBUTION CHANNEL , %, CHINA, 2022 VS 2029
- Figure 63:
- VOLUME OF OTHERS MARKET, METRIC TONNES, CHINA, 2017 - 2029
- Figure 64:
- VALUE OF OTHERS MARKET, USD, CHINA, 2017 - 2029
- Figure 65:
- VALUE SHARE OF OTHERS MARKET, BY DISTRIBUTION CHANNEL , %, CHINA, 2022 VS 2029
- Figure 66:
- VOLUME OF MILK MARKET BY PRODUCT TYPE, METRIC TONNES, CHINA, 2017 - 2029
- Figure 67:
- VALUE OF MILK MARKET BY PRODUCT TYPE, USD, CHINA, 2017 - 2029
- Figure 68:
- VOLUME SHARE OF MILK MARKET BY PRODUCT TYPE, %, CHINA, 2017 VS 2023 VS 2029
- Figure 69:
- VALUE SHARE OF MILK MARKET BY PRODUCT TYPE, %, CHINA, 2017 VS 2023 VS 2029
- Figure 70:
- VOLUME OF CONDENSED MILK MARKET, METRIC TONNES, CHINA, 2017 - 2029
- Figure 71:
- VALUE OF CONDENSED MILK MARKET, USD, CHINA, 2017 - 2029
- Figure 72:
- VALUE SHARE OF CONDENSED MILK MARKET, BY DISTRIBUTION CHANNEL , %, CHINA, 2022 VS 2029
- Figure 73:
- VOLUME OF FLAVORED MILK MARKET, METRIC TONNES, CHINA, 2017 - 2029
- Figure 74:
- VALUE OF FLAVORED MILK MARKET, USD, CHINA, 2017 - 2029
- Figure 75:
- VALUE SHARE OF FLAVORED MILK MARKET, BY DISTRIBUTION CHANNEL , %, CHINA, 2022 VS 2029
- Figure 76:
- VOLUME OF FRESH MILK MARKET, METRIC TONNES, CHINA, 2017 - 2029
- Figure 77:
- VALUE OF FRESH MILK MARKET, USD, CHINA, 2017 - 2029
- Figure 78:
- VALUE SHARE OF FRESH MILK MARKET, BY DISTRIBUTION CHANNEL , %, CHINA, 2022 VS 2029
- Figure 79:
- VOLUME OF POWDERED MILK MARKET, METRIC TONNES, CHINA, 2017 - 2029
- Figure 80:
- VALUE OF POWDERED MILK MARKET, USD, CHINA, 2017 - 2029
- Figure 81:
- VALUE SHARE OF POWDERED MILK MARKET, BY DISTRIBUTION CHANNEL , %, CHINA, 2022 VS 2029
- Figure 82:
- VOLUME OF UHT MILK MARKET, METRIC TONNES, CHINA, 2017 - 2029
- Figure 83:
- VALUE OF UHT MILK MARKET, USD, CHINA, 2017 - 2029
- Figure 84:
- VALUE SHARE OF UHT MILK MARKET, BY DISTRIBUTION CHANNEL , %, CHINA, 2022 VS 2029
- Figure 85:
- VOLUME OF YOGURT MARKET BY PRODUCT TYPE, METRIC TONNES, CHINA, 2017 - 2029
- Figure 86:
- VALUE OF YOGURT MARKET BY PRODUCT TYPE, USD, CHINA, 2017 - 2029
- Figure 87:
- VOLUME SHARE OF YOGURT MARKET BY PRODUCT TYPE, %, CHINA, 2017 VS 2023 VS 2029
- Figure 88:
- VALUE SHARE OF YOGURT MARKET BY PRODUCT TYPE, %, CHINA, 2017 VS 2023 VS 2029
- Figure 89:
- VOLUME OF FLAVORED YOGURT MARKET, METRIC TONNES, CHINA, 2017 - 2029
- Figure 90:
- VALUE OF FLAVORED YOGURT MARKET, USD, CHINA, 2017 - 2029
- Figure 91:
- VALUE SHARE OF FLAVORED YOGURT MARKET, BY DISTRIBUTION CHANNEL , %, CHINA, 2022 VS 2029
- Figure 92:
- VOLUME OF UNFLAVORED YOGURT MARKET, METRIC TONNES, CHINA, 2017 - 2029
- Figure 93:
- VALUE OF UNFLAVORED YOGURT MARKET, USD, CHINA, 2017 - 2029
- Figure 94:
- VALUE SHARE OF UNFLAVORED YOGURT MARKET, BY DISTRIBUTION CHANNEL , %, CHINA, 2022 VS 2029
- Figure 95:
- VOLUME OF DAIRY MARKET BY DISTRIBUTION CHANNEL, METRIC TONNES, CHINA, 2017 - 2029
- Figure 96:
- VALUE OF DAIRY MARKET BY DISTRIBUTION CHANNEL, USD, CHINA, 2017 - 2029
- Figure 97:
- VOLUME SHARE OF DAIRY MARKET, BY DISTRIBUTION CHANNEL , %, CHINA, 2017 VS 2023 VS 2029
- Figure 98:
- VALUE SHARE OF DAIRY MARKET, BY DISTRIBUTION CHANNEL , %, CHINA, 2017 VS 2023 VS 2029
- Figure 99:
- VOLUME OF DAIRY MARKET BY SUB DISTRIBUTION CHANNELS, METRIC TONNES, CHINA, 2017 - 2029
- Figure 100:
- VALUE OF DAIRY MARKET BY SUB DISTRIBUTION CHANNELS, USD, CHINA, 2017 - 2029
- Figure 101:
- VOLUME SHARE OF DAIRY MARKET, BY SUB DISTRIBUTION CHANNELS , %, CHINA, 2017 VS 2023 VS 2029
- Figure 102:
- VALUE SHARE OF DAIRY MARKET, BY SUB DISTRIBUTION CHANNELS , %, CHINA, 2017 VS 2023 VS 2029
- Figure 103:
- VOLUME OF DAIRY MARKET SOLD VIA CONVENIENCE STORES, METRIC TONNES, CHINA, 2017 - 2029
- Figure 104:
- VALUE OF DAIRY MARKET SOLD VIA CONVENIENCE STORES, USD, CHINA, 2017 - 2029
- Figure 105:
- VALUE SHARE OF DAIRY MARKET, SOLD VIA CONVENIENCE STORES, BY CATEGORY , %, CHINA, 2022 VS 2029
- Figure 106:
- VOLUME OF DAIRY MARKET SOLD VIA ONLINE RETAIL, METRIC TONNES, CHINA, 2017 - 2029
- Figure 107:
- VALUE OF DAIRY MARKET SOLD VIA ONLINE RETAIL, USD, CHINA, 2017 - 2029
- Figure 108:
- VALUE SHARE OF DAIRY MARKET, SOLD VIA ONLINE RETAIL, BY CATEGORY , %, CHINA, 2022 VS 2029
- Figure 109:
- VOLUME OF DAIRY MARKET SOLD VIA SPECIALIST RETAILERS, METRIC TONNES, CHINA, 2017 - 2029
- Figure 110:
- VALUE OF DAIRY MARKET SOLD VIA SPECIALIST RETAILERS, USD, CHINA, 2017 - 2029
- Figure 111:
- VALUE SHARE OF DAIRY MARKET, SOLD VIA SPECIALIST RETAILERS, BY CATEGORY , %, CHINA, 2022 VS 2029
- Figure 112:
- VOLUME OF DAIRY MARKET SOLD VIA SUPERMARKETS AND HYPERMARKETS, METRIC TONNES, CHINA, 2017 - 2029
- Figure 113:
- VALUE OF DAIRY MARKET SOLD VIA SUPERMARKETS AND HYPERMARKETS, USD, CHINA, 2017 - 2029
- Figure 114:
- VALUE SHARE OF DAIRY MARKET, SOLD VIA SUPERMARKETS AND HYPERMARKETS, BY CATEGORY , %, CHINA, 2022 VS 2029
- Figure 115:
- VOLUME OF DAIRY MARKET SOLD VIA OTHERS (WAREHOUSE CLUBS, GAS STATIONS, ETC.), METRIC TONNES, CHINA, 2017 - 2029
- Figure 116:
- VALUE OF DAIRY MARKET SOLD VIA OTHERS (WAREHOUSE CLUBS, GAS STATIONS, ETC.), USD, CHINA, 2017 - 2029
- Figure 117:
- VALUE SHARE OF DAIRY MARKET, SOLD VIA OTHERS (WAREHOUSE CLUBS, GAS STATIONS, ETC.), BY CATEGORY , %, CHINA, 2022 VS 2029
- Figure 118:
- VOLUME OF DAIRY MARKET SOLD VIA ON-TRADE, METRIC TONNES, CHINA, 2017 - 2029
- Figure 119:
- VALUE OF DAIRY MARKET SOLD VIA ON-TRADE, USD, CHINA, 2017 - 2029
- Figure 120:
- VALUE SHARE OF DAIRY MARKET, SOLD VIA ON-TRADE, BY CATEGORY , %, CHINA, 2022 VS 2029
- Figure 121:
- MOST ACTIVE COMPANIES BY NUMBER OF STRATEGIC MOVES, COUNT, CHINA, 2017 - 2029
- Figure 122:
- MOST ADOPTED STRATEGIES, COUNT, CHINA, 2017 - 2029
- Figure 123:
- VALUE SHARE OF MAJOR PLAYERS, %, CHINA
China Dairy Industry Segmentation
Butter, Cheese, Cream, Dairy Desserts, Milk, Yogurt are covered as segments by Category. Off-Trade, On-Trade are covered as segments by Distribution Channel.| Category | Butter | By Product Type | Cultured Butter | |
| Uncultured Butter | ||||
| Cheese | By Product Type | Natural Cheese | ||
| Processed Cheese | ||||
| Cream | By Product Type | Double Cream | ||
| Single Cream | ||||
| Whipping Cream | ||||
| Others | ||||
| Dairy Desserts | By Product Type | Cheesecakes | ||
| Frozen Desserts | ||||
| Ice Cream | ||||
| Mousses | ||||
| Others | ||||
| Milk | By Product Type | Condensed milk | ||
| Flavored Milk | ||||
| Fresh Milk | ||||
| Powdered Milk | ||||
| UHT Milk | ||||
| Yogurt | By Product Type | Flavored Yogurt | ||
| Unflavored Yogurt | ||||
| Distribution Channel | Off-Trade | Convenience Stores | ||
| Online Retail | ||||
| Specialist Retailers | ||||
| Supermarkets and Hypermarkets | ||||
| Others (Warehouse clubs, gas stations, etc.) | ||||
| On-Trade | ||||
| Butter | By Product Type | Cultured Butter |
| Uncultured Butter | ||
| Cheese | By Product Type | Natural Cheese |
| Processed Cheese | ||
| Cream | By Product Type | Double Cream |
| Single Cream | ||
| Whipping Cream | ||
| Others | ||
| Dairy Desserts | By Product Type | Cheesecakes |
| Frozen Desserts | ||
| Ice Cream | ||
| Mousses | ||
| Others | ||
| Milk | By Product Type | Condensed milk |
| Flavored Milk | ||
| Fresh Milk | ||
| Powdered Milk | ||
| UHT Milk | ||
| Yogurt | By Product Type | Flavored Yogurt |
| Unflavored Yogurt |
| Off-Trade | Convenience Stores |
| Online Retail | |
| Specialist Retailers | |
| Supermarkets and Hypermarkets | |
| Others (Warehouse clubs, gas stations, etc.) | |
| On-Trade |
Market Definition
- Butter - Butter is a yellow-to-white solid emulsion of fat globules, water, and inorganic salts produced by churning the cream from cows’ milk
- Dairy - Dairy product include milk and any of the foods made from milk, including butter, cheese, ice cream, yogurt, and condensed and dried milk.
- Frozen Desserts - Frozen dairy dessert means and includes products containing milk or cream and other ingredients which are frozen or semi-frozen prior to consumption, such as ice milk or sherbet, including frozen dairy desserts for special dietary purposes, and sorbet
- Sour Milk Drinks - Sour milk is thick, curdled milk, with a sour taste, obtained from the fermentation of milk. Sour milk drinks such as kefir, laban, buttermilk have been considered in the study
| Keyword | Definition |
|---|---|
| Cultured Butter | Cultured butter is prepared by having the raw butter go through chemical processing and has been added with certain emulsifiers and foreign ingredients. |
| Uncultured Butter | This type of butter is one which has not been processed in any way |
| Natural Cheese | The type of cheese in its most natural form. It is made from natural and simple products and ingredients, including fresh and natural salts, natural colors, enzymes, and high-quality milk. |
| Processed Cheese | Processed cheese undergoes the same processes as natural cheese; however, it requires more steps and many different forms of ingredients. Making processed cheese involves melting natural cheese, emulsifying it, and adding preservatives and other artificial ingredients or colorings. |
| Single Cream | Single cream contains around 18% fat. It’s a single layer of cream that appears over boiled milk. |
| Double Cream | Double cream contains 48% fat, more than double the amount of fat of single cream. It’s heavier and thicker than single cream |
| Whipping Cream | This has a much higher fat percentage than single cream (36%). Used to top cakes, pies, and puddings and as a thickener for sauces, soups, and fillings. |
| Frozen Desserts | Desserts that are meant to be eaten in frozen condition. E.g., sherbets, sorbets, frozen yogurts |
| UHT Milk (Ultra-high temperature milk) | Milk heated at a very high temperature. Ultra-high-temperature processing (UHT) of milk involves heating for 1–8 sec at 135–154°C. which kills the spore-forming pathogenic microorganism, resulting in a product with a shelf-life of several months. |
| Non-dairy butter/Plant-based butter | Butter made from plant-derived oil such as coconut, palm, etc. |
| Non-dairy Yogurt | Yogurt made from typically made from nuts, like almonds, cashews, coconuts, and even other foods like soybeans, plantains, oats, and peas |
| On-trade | It refers to restaurants, QSRs, and bars. |
| Off-trade | It refers to supermarkets, hypermarkets, on-line channels, etc. |
| Neufchatel cheese | One of the oldest kinds of cheese in France. It is a soft, slightly crumbly, mold-ripened, bloomy-rind cheese made in the Neufchâtel-en-Bray region of Normandy. |
| Flexitarian | It refers to a consumer preferring a semi-vegetarian diet, that is centered on plant foods with limited or occasional inclusion of meat. |
| Lactose Intolerance | Lactose intolerance is a reaction in digestive system to lactose, the sugar in milk. It causes uncomfortable symptoms in response to the consumption of dairy products. |
| Cream Cheese | Cream cheese is a soft and creamy fresh cheese with a tangy taste made from milk and cream. |
| Sorbets | Sorbet is a frozen dessert made using ice combined with fruit juice, fruit purée, or other ingredients, such as wine, liqueur, or honey. |
| Sherbet | Sherbet is a sweetened frozen dessert made with fruit and some sort of dairy product such as milk or cream. |
| Shelf stable | Foods that can be safely stored at room temperature, or "on the shelf," for at least one year and do not have to be cooked or refrigerated to eat safely. |
| DSD | Direct Store Delivery is the process in supply chain management wherein the product is delivered from manufacturing plant directly to the retailer. |
| OU Kosher | Orthodox Union Kosher is a kosher certification agency based in New York City. |
| Gelato | Gelato is a frozen creamy dessert made with milk, heavy cream and sugar. |
| Grass-fed Cows | Grass-fed cows are allowed to graze in pastures, where they eat a variety of grasses and clover. |
Research Methodology
Mordor Intelligence follows a four-step methodology in all our reports.
- Step-1: Identify Key Variables: In order to build a robust forecasting methodology, the variables and factors identified in Step 1 are tested against available historical market numbers. Through an iterative process, the variables required for market forecast are set, and the model is built on the basis of these variables.
- Step-2: Build a Market Model: Market-size estimations for the forecast years are in nominal terms. Inflation is not a part of the pricing, and the average selling price (ASP) is kept constant throughout the forecast period for each country.
- Step-3: Validate and Finalize: In this important step, all market numbers, variables, and analyst calls are validated through an extensive network of primary research experts from the market studied. The respondents are selected across levels and functions to generate a holistic picture of the market studied.
- Step-4: Research Outputs: Syndicated Reports, Custom Consulting Assignments, Databases & Subscription Platforms


