China Dairy Market Size and Share
Market Overview
| Study Period | 2021 - 2031 |
|---|---|
| Forecast Data Period | 2026 - 2031 |
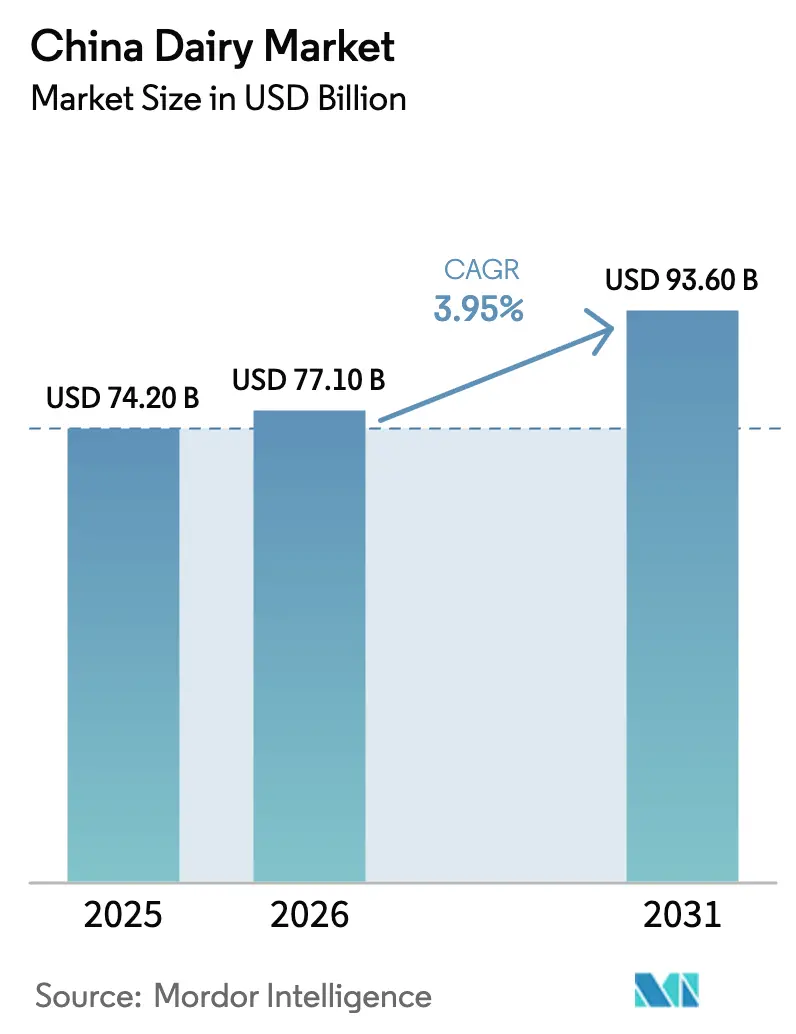
| Base Year Market Size (2025) | USD 74.20 Billion |
| Market Size (2026) | USD 77.10 Billion |
| Market Size (2031) | USD 93.60 Billion |
| Growth Rate (2026 - 2031) | 3.95% CAGR |
| Market Concentration | Medium |
Major Players
*Disclaimer: Major Players sorted in no particular order Image © Mordor Intelligence. Reuse requires attribution under CC BY 4.0. |
|
China Dairy Market Analysis by Mordor Intelligence
The China dairy market size is projected to be USD 74.2 billion in 2025, USD 77.11 billion in 2026, and reach USD 93.59 billion by 2031, growing at a CAGR of 3.95% from 2026 to 2031. Government-backed initiatives to consolidate herds are slashing on-farm costs, channeling funds into shelf-stable research and development. Meanwhile, a looming ban in September 2025 on powder reconstitution in sterilized milk is heightening entry barriers and hastening consolidation among processors capable of investing in new equipment[1]Source: United States Department of Agriculture, "Dairy and Products Annual, China, " apps.fas.usda.gov. These changes are expected to reshape the competitive landscape, favoring larger players with greater financial resources. Concurrently, anti-subsidy duties ranging from 21.9% to 42.7% on EU dairy imports are shifting demand towards New Zealand suppliers and local brands. Cold-chain instant-retail platforms are expanding beyond major cities, tripling chilled-storage capacity in county markets and cutting delivery times to under 30 minutes. This expansion is broadening household access to fluid milk and yogurt. The rapid growth of these platforms is also driving innovation in last-mile delivery solutions to meet rising consumer expectations. While compliance costs are climbing due to a stringent two-hour incident-reporting rule, this heightened oversight is bolstering consumer trust in tier-1 brands, securing their premium shelf positions.
Key Report Takeaways
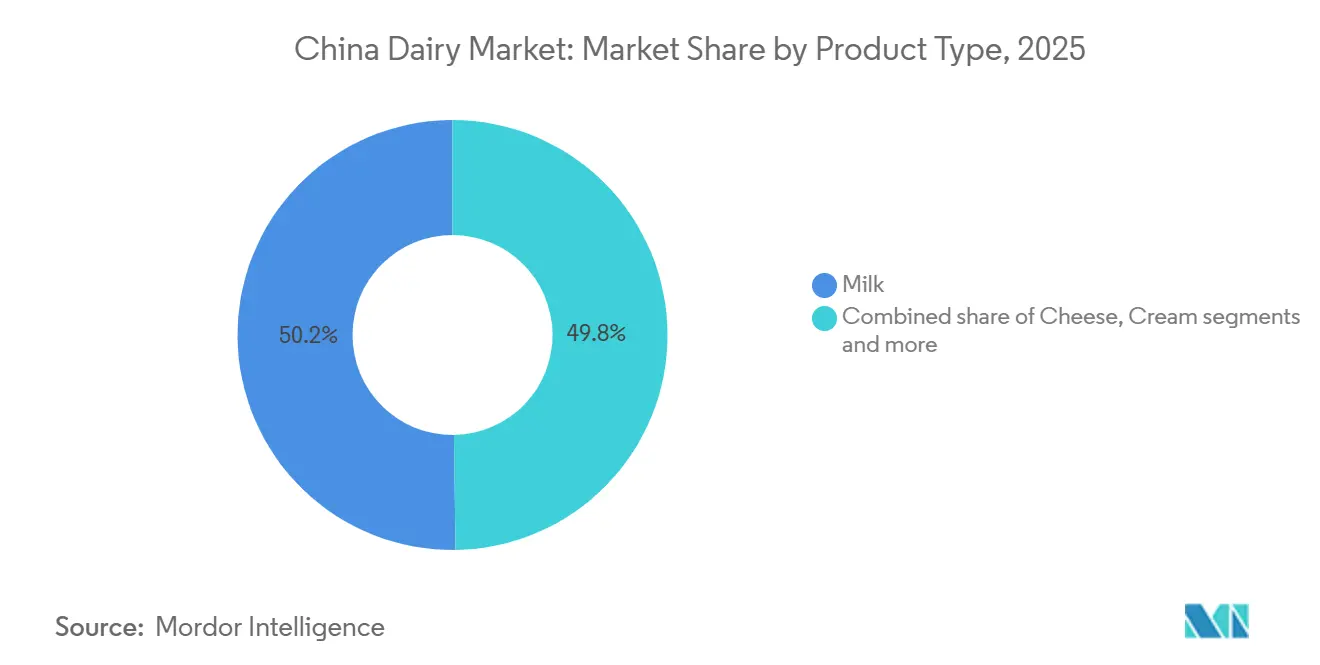
- Milk retained the largest share at 48.22% of 2025 revenue, while cheese recorded the fastest projected growth at a 5.28% CAGR through 2031.
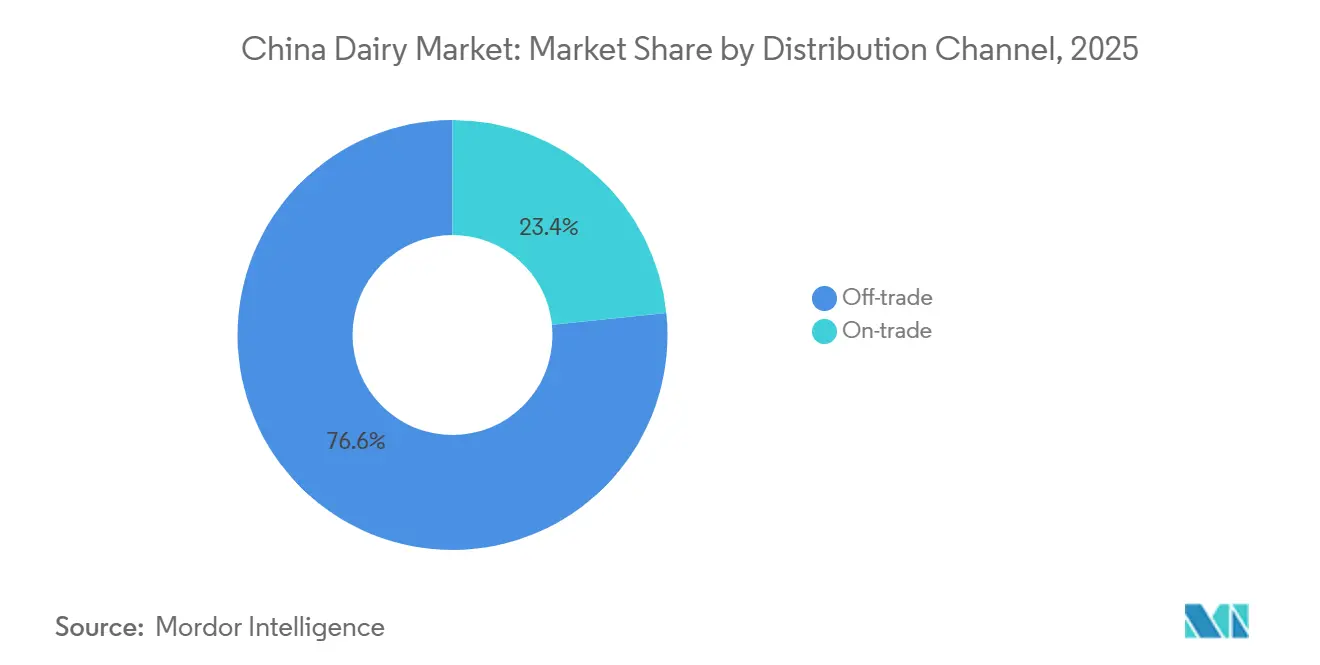
- Off-trade sales captured 91.63% of 2025 value, yet on-trade venues have the highest forecast expansion at a 4.62% CAGR to 2031.
Note: Market size and forecast figures in this report are generated using Mordor Intelligence’s proprietary estimation framework, updated with the latest available data and insights as of 2026.
China Dairy Market Trends and Insights
Drivers Impact Analysis*
| Driver | (~) % Impact on CAGR Forecast | Geographic Relevance | Impact Timeline |
|---|---|---|---|
| Rising demand for high-protein, fortified, and functional dairy products | +0.8% | National, with early gains in Beijing, Shanghai, Guangzhou, Shenzhen | Medium term (2-4 years) |
| Growth in health consciousness and focus on nutrition among Chinese consumers | +0.7% | National, accelerating in Tier 1 and Tier 2 cities | Long term (≥ 4 years) |
| Expansion of premium dairy segments, including specialty cheeses and yogurts | +0.6% | Tier 1 cities, spreading to provincial capitals | Medium term (2-4 years) |
| Rapid adoption of cold-chain instant-retail formats in lower-tier cities | +0.5% | Tier 3 and Tier 4 cities, county-level markets | Short term (≤ 2 years) |
| Government herd-consolidation subsidies unlocking research and development budgets for shelf-stable beverages | +0.4% | National, concentrated in Inner Mongolia, Heilongjiang, Hebei | Medium term (2-4 years) |
| Duty-free Hong Kong re-exports enabling micro-batch test-marketing of novel imported cheeses | +0.2% | Hong Kong SAR, Pearl River Delta spillover | Short term (≤ 2 years) |
| Source: Mordor Intelligence | |||


Rising demand for high-protein, fortified, and functional dairy products
Urban millennials are redefining dairy's role, now viewing it as a post-workout recovery aid instead of just a breakfast item. Yili's Ambrosial Greek yogurt, boasting 15 g of protein per serving, contributed to a 5.5% year-on-year boost in the firm's Q1 2024 net profit. Mengniu's Pure Zhen high-calcium milk, marketed for its bone-health benefits, resonated with older consumers, driving an 8.1% revenue increase in Q1 2024. Government nutrition surveys highlighting vitamin D and calcium deficiencies are prompting processors to fortify their products, enabling them to command premium prices. Tier 1 consumers are willing to pay 20-30% more for products boasting "high-protein" or "probiotic" labels, benefiting companies that can validate these claims through clinical studies. With the expansion of functional claims, processors collaborating with sports associations and fitness influencers are achieving heightened shelf visibility.
Growth in health consciousness and focus on nutrition among chinese consumers
In 2024-2025, low-fat yogurt, organic milk, and lactose-free products surged ahead of the average in China's dairy market. Beijing allocated CNY 1 billion in 2025 to subsidize herd consolidation and cushion farmers against 29 straight months of milk-price declines[2]Source: United States Department of Agriculture, "Dairy and Products Annual, China, " apps.fas.usda.gov. Public-school nutrition campaigns are bolstering early adoption, ensuring these habits stick into adulthood. As disposable incomes climb, county-level supermarkets are allocating more cooler space to premium SKUs. Yet, during economic slowdowns, shoppers often pivot to mid-tier brands. Processors with a tiered pricing strategy successfully cater to both premium and value segments, all while safeguarding their brand equity. Additionally, the growing awareness of health benefits associated with these products is driving their demand further. The increasing penetration of e-commerce platforms is also expanding the accessibility of these premium and health-focused dairy products to a broader consumer base.
Expansion of premium dairy segments, including specialty cheeses and yogurts
China's premium dairy segment is experiencing substantial expansion as consumer culinary preferences become more sophisticated, driven by the increasing influence of Western dining culture in major metropolitan cities[3]Source: China Customs, “Import and Export Data Analysis January 2025,” customs.gov.cn. Cheese is evolving from a specialty ingredient in Western cuisine to a staple in bakeries and quick-service restaurants. In 2024-2025, chains like Pizza Hut, Dicos, and various independent cafés reported a surge in mozzarella sales, prompting processors to bolster domestic production. Yili's inauguration of a 10,000-metric-ton cheese plant in Hohhot in 2024 underscores its faith in the local cheesemaking landscape. Premium yogurt variants, including skyr and Greek styles, now fetch a 40-50% price premium over standard products, thanks to their thicker textures and enhanced satiety. Meanwhile, innovations in fermentation technology are successfully reducing sugar content, addressing regulatory pressures without compromising on taste. By emphasizing differentiation, cheese and premium yogurt offerings provide processors with a buffer against fluctuations in raw milk prices.
Rapid adoption of cold-chain instant-retail formats in lower-tier cities
In 2024, instant-retail platforms achieved a gross merchandise value exceeding USD 110 billion, with projections indicating a tripling by 2030, prominently featuring dairy as a key replenishment category. JD.com handles a staggering 25 million food orders daily, while Meituan, boasting 770 million annual users, relies on micro-warehouses ensuring chilled milk deliveries within a swift 30-minute window. Freshippo's 420 omnichannel stores, with over 60% of revenue generated online, exemplify the successful fusion of traditional and digital retail. Sam's Club, having expanded to 60 stores by the end of 2025, is strategically targeting county-level populations, leveraging membership fees to foster loyalty and encourage bulk purchases of dairy products. With advancements in cold-chain infrastructure, spoilage rates have diminished, shelf life has extended, and the dairy market in China is flourishing, even in regions previously devoid of dependable refrigeration.
Restraints Impact Analysis*
| Restraint | (~) % Impact on CAGR Forecast | Geographic Relevance | Impact Timeline |
|---|---|---|---|
| Rising competition from plant-based and nut-based "milk" products | -0.5% | National, strongest in Tier 1 and Tier 2 cities | Medium term (2-4 years) |
| Stringent regulatory standards leading to frequent product recalls | -0.3% | National, enforced by SAMR | Short term (≤ 2 years) |
| Revised sterilized-milk standard banning powder reconstitution, raising small-processor capex | -0.4% | National, acute in Hebei, Shandong, Shaanxi | Short term (≤ 2 years) |
| Persistent raw-milk oversupply depressing farm-gate prices and shrinking small farms | -0.6% | National, concentrated in Inner Mongolia, Heilongjiang, Xinjiang | Long term (≥ 4 years) |
| Source: Mordor Intelligence | |||
Rising competition from plant-based and nut-based “milk” products
Oat, almond, and soy beverages are increasingly popular among lactose-intolerant consumers and flexitarians. Between 2024 and 2025, shelf space for oat-milk products surged by 20% in Tier 1 supermarkets, coinciding with baristas offering oat-milk substitutions at no added cost. Brands like Oatly, an international giant, and domestic player Vitasoy, leverage carbon-footprint messaging to appeal to eco-conscious shoppers. In response, traditional processors are promoting lactose-free milk and emphasizing higher protein content. However, they're grappling with shrinking margins as consumers explore non-dairy alternatives. This challenge is most pronounced in the ready-to-drink coffee and tea segment, where plant-based options enhance flavor profiles. The growing demand for plant-based beverages highlights a significant shift in consumer preferences toward sustainable and health-conscious choices.
Stringent regulatory standards leading to frequent product recalls
In 2024-2025, several regional dairy brands faced penalties for microbiological lapses, eroding consumer trust and exposing operational weaknesses, especially among smaller players. To stay ahead of audits, industry leaders are adopting blockchain traceability and automated pathogen detection, further widening the cost gap with their sub-scale rivals. The collective memory of the 2008 melamine crisis looms large, turning any lapse into a significant reputational risk. As a result, compliance investments are emerging as a quasi-barrier, benefiting well-capitalized incumbents. Under SAMR regulations, dairy firms are now mandated to report safety incidents within a two-hour window, leading to compressed recall timelines and heightened compliance costs. These developments underscore the growing importance of technological advancements in ensuring food safety and regulatory adherence.
*Our forecasts treat driver/restraint impacts as directional, not additive. The impact forecasts reflect baseline growth, mix effects, and variable interactions.
Segment Analysis
By Product Type: Cheese Outpaces Traditional Categories
Milk maintained its position as the largest segment in the China dairy market, accounting for 48.22% of revenue in 2025. It serves as the consumption anchor for daily breakfast routines, children’s nutrition, and widespread household use, particularly in coastal metros. Steady demand is supported by its affordability and cultural entrenchment across urban and semi-urban areas. Retail availability through modern trade and traditional channels ensures milk’s enduring volume leadership. However, brewers must navigate raw milk price volatility while sustaining this core category’s scale.
Cheese represents the fastest-growing segment, projected to expand at a 5.28% CAGR through 2031. Quick-service restaurants and bakeries are driving adoption with increased use of mozzarella, cream cheese, and other value-added formats. Rising mid-income consumers seek premium Western-inspired dishes like sandwiches and salads, boosting demand for cheddar and gouda alongside localized innovations such as mala-spiced string cheese. Investments like Yili’s new 10,000-metric-ton plant enhance domestic production capacity and reduce import dependency. This premiumization trend elevates the overall China dairy market size for higher-margin processed products.


By Distribution Channel: Off-Trade Dominance Masks On-Trade Recovery
In 2025, off-trade channels led China's dairy market, capturing 91.63% of total sales. Supermarkets, hypermarkets, and instant-retail platforms cater to consumers prioritizing convenience and price. Membership warehouses, like Sam’s Club and Metro, foster loyalty with bulk formats and curated selections, even expanding into county-level cities for a larger share. Convenience stores meet on-the-go demands with single-serve flavored milk and yogurt. E-commerce giants JD.com and Tmall, leveraging hyperlocal logistics, handle a staggering 25 million daily orders. Additionally, flash-sale promotions on Taobao create volume surges, especially for yogurt during special events. The dominance of off-trade channels underscores their ability to adapt to evolving consumer preferences and technological advancements.
On-trade channels are emerging as the fastest-growing segment, projected to grow at a 4.62% CAGR through 2031. As hotels, cafés, and restaurants return to normalcy, they're not only restoring procurement volumes but also diversifying their product offerings. Chains like Luckin Coffee, boasting over 10,000 outlets, are ramping up their fresh milk and cream usage. In Tier 1 cities, premium hotel buffets are opting for imported cheeses and butter, while local bakeries are standardizing mozzarella for their pizzas and pastries. This resurgence signals a ripe opportunity for processors eyeing foodservice partnerships with robust unit economics. The growth of on-trade channels reflects the increasing demand for premium and diverse dairy products in foodservice settings.
Geography Analysis
China's dairy demand is distinctly regional. Despite housing a smaller population, Tier 1 cities command a significant share of premium dairy spending. In Beijing and Shanghai, consumers willingly pay a 20-30% premium for organic milk, Greek yogurt, and imported specialty cheese, bolstering the market's high-margin layers. While provincial capitals like Chengdu and Wuhan are catching up on the premium trend, they're more price-sensitive, leaning towards mid-tier domestic brands that mirror Tier 1 product features. Meanwhile, Tier 3 and Tier 4 cities, along with county markets, are poised to drive future volumes. Sam's Club's expansion into these areas, combined with rising disposable incomes and newly established cold-chain capacities, is tapping into previously uncharted shopper demographics.
Inner Mongolia, Heilongjiang, and Xinjiang stand as the milk-production powerhouses, buoyed by forage subsidies that ease feed costs and ensure a steady supply. However, a persistent structural oversupply is keeping farm-gate prices low, putting pressure on smallholders and driving industry consolidation. The primary consumption hubs are located further south and east. The Yangtze River Delta and Pearl River Delta lead the way in importing and experimenting with cheese, thanks to their advanced logistics and wealthy populations. Additionally, Hong Kong's duty-free re-export system channels small batches of European cheeses to boutique retailers in Shenzhen and Shanghai, allowing for immediate consumer feedback. On the other hand, provinces like Gansu and Guizhou, lacking refrigeration infrastructure, continue to rely on ultra-high-temperature milk until their facilities catch up.
The government's rural revitalization initiative envisions refrigerated transit routes and regional cold-storage centers, with a goal to level the playing field in five years. If successful, this could shift some consumption towards inland areas and reduce logistic cost differences. Concurrently, duties on EU subsidies are redirecting imports towards New Zealand and motivating domestic processors to delve deeper into cheese and whey ingredient production, reshaping trade patterns and regional supplier relationships.
Competitive Landscape
In China's dairy market, which exhibits moderate concentration, the top four domestic players, Yili, Mengniu, Bright Dairy, and Junlebao, hold significant shares, yet the landscape remains open for regional specialists. Yili, buoyed by its Ambrosial Greek yogurt, reported a net profit of CNY 1.16 billion for Q1 2024. Meanwhile, Mengniu's revenue reached CNY 10.1 billion, driven by its calcium-fortified milk. Both giants manage their upstream herds, streamlining compliance with fresh-milk mandates and mitigating ingredient risks. Bright Dairy capitalizes on its premium Fresh Milk Station model, dominating eastern metropolitan areas. In contrast, Junlebao, rooted in Hebei's farming base, targets the value and mid-price segments.
Foreign entities like Danone and Nestlé focus on specialized nutrition areas, such as medical formulas, hypoallergenic infant nutrition, and probiotic supplements, where brand trust translates to premium pricing. Fonterra, on the other hand, provides bulk ingredients such as whole-milk powder and whey protein, primarily feeding retailer private-label lines and fortifying its business-to-business stronghold. The swift rise of instant retailing pressures all players to establish micro-warehouses close to consumption hubs, complicating last-mile logistics and benefiting those with robust logistics capabilities.
Investment in technology is paramount. Industry leaders harness blockchain for comprehensive traceability, preempting potential recalls, and employ AI-driven demand forecasting to minimize waste. Conversely, smaller processors, unable to invest in sterilization or digital traceability, find their shelf space dwindling and become attractive acquisition targets. While direct-to-consumer brands hold a modest sub-3% market share, they're making waves. Utilizing platforms like WeChat mini-programs and Douyin live streams, they're building a loyal following for niche products like grass-fed and A2-protein milk. Yet, these startups grapple with challenges, particularly in adhering to the two-hour incident-reporting rule without automated quality systems.
China Dairy Industry Leaders
-
Yili Group
-
Mengniu Dairy
-
Bright Dairy & Food
-
Junlebao Dairy Group
-
Danone SA
- *Disclaimer: Major Players sorted in no particular order

Recent Industry Developments
- October 2025: SGS and Yili Group have teamed up to elevate quality and sustainability in the dairy industry. Their focus spans global production standards, rigorous testing, and ambitious zero-carbon initiatives. This partnership offers a suite of integrated solutions, encompassing certification, advanced digital systems, and comprehensive training. These efforts aim to bolster Yili's esteemed reputation for reliability and innovation within China's dynamic dairy landscape.
- September 2025: Sanyuan made its debut in Beijing's fresh milk market with the introduction of "Sanyuan Beijing Fresh Milk," its inaugural product in the low-temperature segment. This launch not only broadens Sanyuan's product lineup but also underscores the company's dedication to catering to the region's surging appetite for fresh dairy offerings.
- June 2025: New Hope Dairy is set to dive into China's burgeoning beverage scene, introducing contemporary milk-based drinks. This move comes as the company seeks fresh revenue avenues in light of waning milk sales. With an eye on evolving consumer tastes, New Hope will spotlight chilled offerings, emphasizing favored flavors and weight management.


China Dairy Market Report Scope
Butter, Cheese, Cream, Dairy Desserts, Milk, and Yogurt are covered as segments by Category. Off-Trade and On-Trade are covered as segments by Distribution Channel.
| Butter | Salted Butter | |
| Unsalted Butter | ||
| Cheese | Natural Cheese | Cheddar |
| Cottage | ||
| Ricotta | ||
| Parmesan | ||
| Others | ||
| Processed Cheese | ||
| Cream | Fresh Cream | |
| Cooking Cream | ||
| Whippng Cream | ||
| Others | ||
| Dairy Desserts | Ice Cream | |
| Cheesecakes | ||
| Frozen Desserts | ||
| Others | ||
| Milk | Condensed milk | |
| Flavored Milk | ||
| Fresh Milk | ||
| UHT Milk | ||
| Powdered Milk | ||
| Yogurt | Drinkable | |
| Spoonable | ||
| Sour Milk Drinks | ||
| On-trade | |
| Off-trade | Convenience Stores |
| Specialist Retailers | |
| Supermarkets and Hypermarkets | |
| Online Retail | |
| Others |
| By Product Type | Butter | Salted Butter | |
| Unsalted Butter | |||
| Cheese | Natural Cheese | Cheddar | |
| Cottage | |||
| Ricotta | |||
| Parmesan | |||
| Others | |||
| Processed Cheese | |||
| Cream | Fresh Cream | ||
| Cooking Cream | |||
| Whippng Cream | |||
| Others | |||
| Dairy Desserts | Ice Cream | ||
| Cheesecakes | |||
| Frozen Desserts | |||
| Others | |||
| Milk | Condensed milk | ||
| Flavored Milk | |||
| Fresh Milk | |||
| UHT Milk | |||
| Powdered Milk | |||
| Yogurt | Drinkable | ||
| Spoonable | |||
| Sour Milk Drinks | |||
| By Distribution Channel | On-trade | ||
| Off-trade | Convenience Stores | ||
| Specialist Retailers | |||
| Supermarkets and Hypermarkets | |||
| Online Retail | |||
| Others | |||


Market Definition
- Butter - Butter is a yellow-to-white solid emulsion of fat globules, water, and inorganic salts produced by churning the cream from cows’ milk
- Dairy - Dairy product include milk and any of the foods made from milk, including butter, cheese, ice cream, yogurt, and condensed and dried milk.
- Frozen Desserts - Frozen dairy dessert means and includes products containing milk or cream and other ingredients which are frozen or semi-frozen prior to consumption, such as ice milk or sherbet, including frozen dairy desserts for special dietary purposes, and sorbet
- Sour Milk Drinks - Sour milk is thick, curdled milk, with a sour taste, obtained from the fermentation of milk. Sour milk drinks such as kefir, laban, buttermilk have been considered in the study
| Keyword | Definition |
|---|---|
| Cultured Butter | Cultured butter is prepared by having the raw butter go through chemical processing and has been added with certain emulsifiers and foreign ingredients. |
| Uncultured Butter | This type of butter is one which has not been processed in any way |
| Natural Cheese | The type of cheese in its most natural form. It is made from natural and simple products and ingredients, including fresh and natural salts, natural colors, enzymes, and high-quality milk. |
| Processed Cheese | Processed cheese undergoes the same processes as natural cheese; however, it requires more steps and many different forms of ingredients. Making processed cheese involves melting natural cheese, emulsifying it, and adding preservatives and other artificial ingredients or colorings. |
| Single Cream | Single cream contains around 18% fat. It’s a single layer of cream that appears over boiled milk. |
| Double Cream | Double cream contains 48% fat, more than double the amount of fat of single cream. It’s heavier and thicker than single cream |
| Whipping Cream | This has a much higher fat percentage than single cream (36%). Used to top cakes, pies, and puddings and as a thickener for sauces, soups, and fillings. |
| Frozen Desserts | Desserts that are meant to be eaten in frozen condition. E.g., sherbets, sorbets, frozen yogurts |
| UHT Milk (Ultra-high temperature milk) | Milk heated at a very high temperature. Ultra-high-temperature processing (UHT) of milk involves heating for 1–8 sec at 135–154°C. which kills the spore-forming pathogenic microorganism, resulting in a product with a shelf-life of several months. |
| Non-dairy butter/Plant-based butter | Butter made from plant-derived oil such as coconut, palm, etc. |
| Non-dairy Yogurt | Yogurt made from typically made from nuts, like almonds, cashews, coconuts, and even other foods like soybeans, plantains, oats, and peas |
| On-trade | It refers to restaurants, QSRs, and bars. |
| Off-trade | It refers to supermarkets, hypermarkets, on-line channels, etc. |
| Neufchatel cheese | One of the oldest kinds of cheese in France. It is a soft, slightly crumbly, mold-ripened, bloomy-rind cheese made in the Neufchâtel-en-Bray region of Normandy. |
| Flexitarian | It refers to a consumer preferring a semi-vegetarian diet, that is centered on plant foods with limited or occasional inclusion of meat. |
| Lactose Intolerance | Lactose intolerance is a reaction in digestive system to lactose, the sugar in milk. It causes uncomfortable symptoms in response to the consumption of dairy products. |
| Cream Cheese | Cream cheese is a soft and creamy fresh cheese with a tangy taste made from milk and cream. |
| Sorbets | Sorbet is a frozen dessert made using ice combined with fruit juice, fruit purée, or other ingredients, such as wine, liqueur, or honey. |
| Sherbet | Sherbet is a sweetened frozen dessert made with fruit and some sort of dairy product such as milk or cream. |
| Shelf stable | Foods that can be safely stored at room temperature, or "on the shelf," for at least one year and do not have to be cooked or refrigerated to eat safely. |
| DSD | Direct Store Delivery is the process in supply chain management wherein the product is delivered from manufacturing plant directly to the retailer. |
| OU Kosher | Orthodox Union Kosher is a kosher certification agency based in New York City. |
| Gelato | Gelato is a frozen creamy dessert made with milk, heavy cream and sugar. |
| Grass-fed Cows | Grass-fed cows are allowed to graze in pastures, where they eat a variety of grasses and clover. |


Research Methodology
Mordor Intelligence follows a four-step methodology in all our reports.
- Step-1: Identify Key Variables: In order to build a robust forecasting methodology, the variables and factors identified in Step 1 are tested against available historical market numbers. Through an iterative process, the variables required for market forecast are set, and the model is built on the basis of these variables.
- Step-2: Build a Market Model: Market-size estimations for the forecast years are in nominal terms. Inflation is not a part of the pricing, and the average selling price (ASP) is kept constant throughout the forecast period for each country.
- Step-3: Validate and Finalize: In this important step, all market numbers, variables, and analyst calls are validated through an extensive network of primary research experts from the market studied. The respondents are selected across levels and functions to generate a holistic picture of the market studied.
- Step-4: Research Outputs: Syndicated Reports, Custom Consulting Assignments, Databases & Subscription Platforms


