Canada Dairy Market Size and Share
Market Overview
| Study Period | 2021 - 2031 |
|---|---|
| Forecast Data Period | 2026 - 2031 |
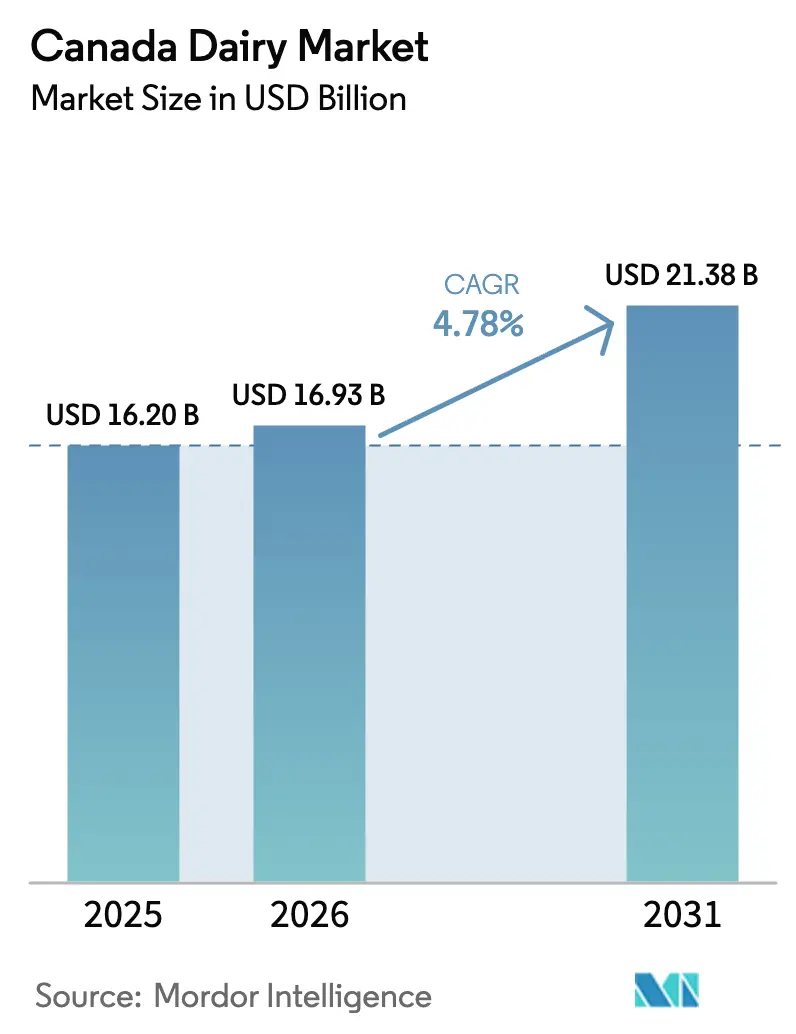
| Base Year Market Size (2025) | USD 16.20 Billion |
| Market Size (2026) | USD 16.93 Billion |
| Market Size (2031) | USD 21.38 Billion |
| Growth Rate (2026 - 2031) | 4.78% CAGR |
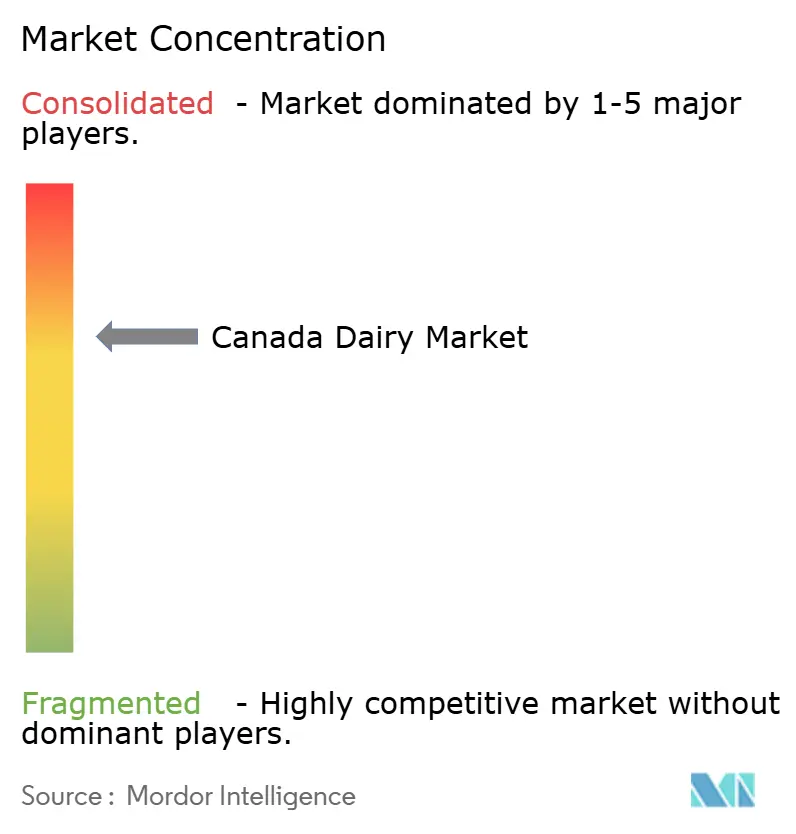
| Market Concentration | Medium |
Major Players *Disclaimer: Major Players sorted in no particular order Image © Mordor Intelligence. Reuse requires attribution under CC BY 4.0. | |
Canada Dairy Market Analysis by Mordor Intelligence
The Canada dairy market size is projected to be USD 16.20 billion in 2025, USD 16.93 billion in 2026, and reach USD 21.38 billion by 2031, growing at a CAGR of 4.78% from 2026 to 2031. Consumers are shifting from bulk staples toward margin-rich offerings that blend functional nutrition with verified sustainability, which is steering processors to invest in traceable supply chains, precision manufacturing, and low-carbon packaging. A stable quota system continues to buffer farm-gate prices, yet rising tariff-rate quotas under recent trade agreements are intensifying competition for premium cheese. Online grocery adoption, still modest at 5.2% of dairy sales, is scaling rapidly as subscription models lock in repeat milk and yogurt purchases. Capital-heavy automation, clean-label reformulation, and Net Zero credentials increasingly determine which processors capture the fastest-growing segments of the Canada dairy market.
Key Report Takeaways
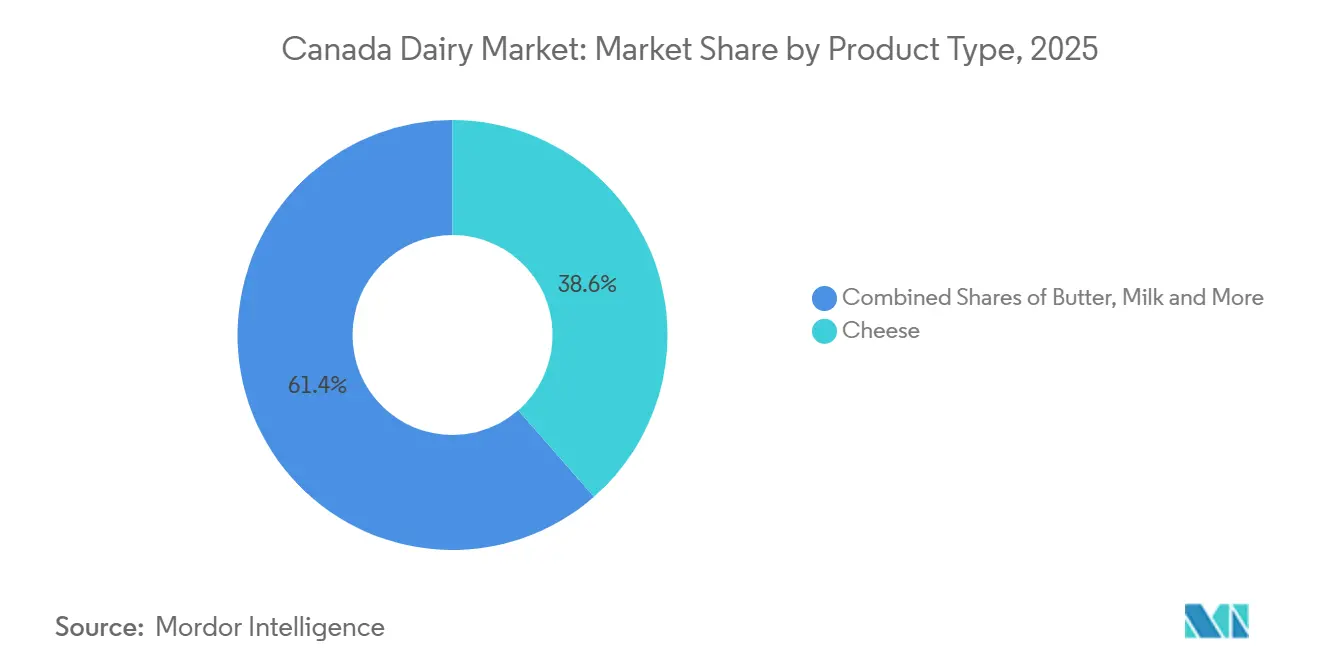
- By product type, cheese led with 38.56% of Canada's dairy market share in 2025; yogurt is forecast to expand at a 5.83% CAGR through 2031.
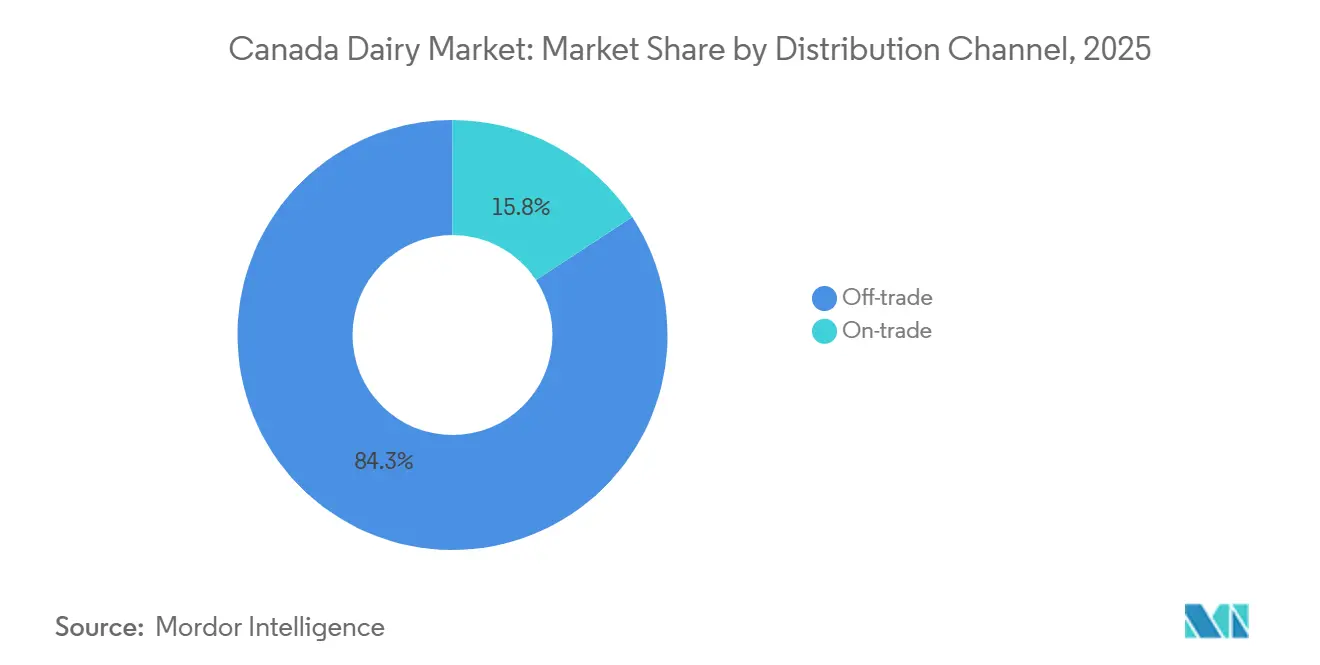
- By distribution channel, off-trade outlets accounted for 84.25% share of the Canada dairy market size in 2025, while on-trade foodservice is advancing at a 5.56% CAGR over 2026-2031.
Note: Market size and forecast figures in this report are generated using Mordor Intelligence’s proprietary estimation framework, updated with the latest available data and insights as of 2026.
Canada Dairy Market Trends and Insights
Drivers Impact Analysis*
| Driver | (~) % Impact on CAGR Forecast | Geographic Relevance | Impact Timeline |
|---|---|---|---|
| Increasing adoption of automation and precision dairy technologies | +0.6% | National, concentrated in Ontario, Quebec, and Alberta dairy clusters | Medium term (2-4 years) |
| Rising consumer demand for organic and clean-label dairy products | +0.8% | National, strongest in urban centers of British Columbia, Ontario, and Quebec | Short term (≤ 2 years) |
| Growing market for lactose-free and digestive-friendly dairy options | +0.5% | National, with higher penetration in metropolitan areas | Medium term (2-4 years) |
| Sustainability-driven product positioning and packaging innovation | +0.7% | National, aligned with federal Net Zero targets | Long term (≥ 4 years) |
| Expansion of functional and value-added dairy products | +0.9% | National, led by Gen Z and Millennial cohorts in urban markets | Short term (≤ 2 years) |
| Growth of convenient and on-the-go dairy formats | +0.6% | National, accelerated by hybrid work and snacking trends | Short term (≤ 2 years) |
| Source: Mordor Intelligence | |||


Increasing Adoption of Automation and Precision Dairy Technologies
Robotic milking systems and sensor-based herd management are reshaping Canadian dairy economics by decoupling labor availability from production capacity. Ontario alone deployed 715 robotic milking installations by 2021, enabling farms to extend milking windows beyond traditional twice-daily schedules and capture higher per-cow yields without proportional labor increases, according to the University of Waterloo. Precision technologies, including wearable health monitors and automated feed-mixing, reduce veterinary costs by detecting subclinical mastitis 48 hours earlier than manual inspection, cutting antibiotic use and preserving milk quality premiums, according to the Agriculture and Agri-Food Canada. The capital intensity of these systems, typically CAD 250,000 to CAD 400,000 per robot, concentrates adoption among larger operations, yet cooperative financing models are democratizing access for mid-sized farms in Quebec and Alberta. This automation wave underpins the sector's ability to maintain stable milk production, forecast at 10.31 million metric tons for 2024, despite a 1.2% annual decline in farm numbers since 2015, according to the USDA Foreign Agricultural Service. Processors leveraging real-time milk-quality data from farm sensors are optimizing cheese aging and yogurt fermentation cycles, reducing batch variability and waste.
Rising Consumer Demand for Organic and Clean-Label Dairy Products
Organic dairy sales reached CAD 9 billion (USD 6.63 billion) in 2023, driven by consumers willing to pay 30% to 50% premiums for products certified under the Canada Organic Regime, which mandates pasture access and prohibits synthetic hormones, according to the Canadian Organic Trade Association[1]Source: Organic Trade Association, “2024 Organic Industry Survey,” ota.com. Clean-label positioning, emphasizing minimal ingredients and transparent sourcing, has become table stakes, with 81% of Canadians reporting an increased preference for domestically produced dairy following pandemic-era supply disruptions, according to the USDA Foreign Agricultural Service. This "Buy Canadian" sentiment is particularly pronounced in British Columbia and Ontario, where provincial agriculture departments co-fund traceability platforms that allow consumers to scan QR codes linking retail cheese blocks to specific farm cooperatives. Processors are responding by reformulating products to eliminate carrageenan, artificial colors, and modified milk ingredients, though this simplification poses technical challenges for maintaining texture and shelf life in products like processed cheese and flavored milk. The organic segment's growth is constrained by limited feed-grain supply. Canada imports 40% of its organic corn and soybeans, creating price volatility that smaller processors struggle to absorb without passing the costs on to consumers.
Growing Market for Lactose-Free and Digestive-Friendly Dairy Options
Health Canada's February 2024 approval of Remilk's animal-free beta-lactoglobulin protein marked a regulatory inflection point, enabling manufacturers to fortify lactose-free products with whey-equivalent functionality without dairy-derived ingredients. Lactose-free dairy now spans cheese, yogurt, and milk categories, with Saputo's "Only Goodness" line and Gay Lea's lactose-free butter capturing incremental share from consumers managing lactose intolerance or adopting low-FODMAP diets. Cottage cheese exemplifies this trend: retail sales surged 25% year-over-year in 2025, propelled by social media influencers promoting high-protein, low-lactose snacking, according to Dairy Farmers of Canada. The segment's growth is tempered by enzyme-treatment costs, lactase addition raises production expenses by CAD 0.08 to CAD 0.12 per liter, and consumer confusion over labeling, as "lactose-free" does not equate to "dairy-free," complicating positioning against plant-based alternatives. Retailers are addressing this by dedicating shelf space to "digestive wellness" dairy, co-merchandising lactose-free products with probiotic yogurts and kefir to reinforce functional benefits.
Sustainability-Driven Product Positioning and Packaging Innovation
Dairy Farmers of Canada's Net Zero by 2050 roadmap, underpinned by a 7.4% reduction in greenhouse-gas intensity per liter of milk from 2011 to 2022, is reframing sustainability from a compliance obligation into a margin-expansion lever. Life-cycle assessments conducted under the proAction environmental module quantify carbon footprints at the farm level, enabling processors to market "low-carbon" cheese and butter to institutional buyers, universities, hospitals, and corporate cafeterias that face Scope 3 emissions targets. Packaging innovation is converging on recyclable mono-material films and compostable yogurt cups, with Agropur piloting polypropylene cheese wraps that reduce plastic use by 18% while maintaining a 90-day shelf life. Methane-reducing feed additives, including 3-nitrooxypropanol (3-NOP), are being tested on 200 farms across Ontario and Quebec, aiming to achieve a 30% reduction in enteric methane by 2030, according to Agriculture and Agri-Food Canada. These initiatives position Canadian dairy favorably against imports from jurisdictions with less stringent environmental standards, though the cost of carbon-neutral certification, CAD 15,000 to CAD 30,000 per farm annually, remains a barrier for smaller operations.
Restraints Impact Analysis*
| Restraint | (~) % Impact on CAGR Forecast | Geographic Relevance | Impact Timeline |
|---|---|---|---|
| Stringent food safety and labeling regulations increasing operational complexity | -0.5% | National, enforced by CFIA with provincial oversight | Medium term (2-4 years) |
| Rising consumer scrutiny regarding animal welfare and ethical sourcing | -0.4% | National, most pronounced in British Columbia and urban Ontario | Short term (≤ 2 years) |
| Competition from plant-based dairy alternatives | -0.8% | National, strongest in metropolitan areas and among consumers under 40 | Short term (≤ 2 years) |
| Supply chain and logistics vulnerabilities | -0.5% | National, acute in remote regions and during extreme weather events | Medium term (2-4 years) |
| Source: Mordor Intelligence | |||
Stringent Food Safety and Labeling Regulations Increasing Operational Complexity
The Safe Food for Canadians Regulations (SFCR), fully enforced since January 2020, mandate preventive-control plans, traceability documentation, and third-party audits for all dairy processors with annual sales exceeding CAD 100,000, raising compliance costs by an estimated CAD 30,000 to CAD 50,000 per facility annually, according to the Canadian Food Inspection Agency[2]Source: Canadian Food Inspection Agency, “Food Safety Testing Bulletin, December 2024,” inspection.gc.ca. Labeling requirements, including mandatory allergen declarations, bilingual French-English text, and nutrition-facts tables conforming to 2022 updates, necessitate package redesigns that cost CAD 5,000 to CAD 15,000 per SKU for smaller processors. Traceability rules require processors to maintain one-step-forward, one-step-back records for 24 months, compelling investments in enterprise resource planning systems that integrate farm-level data with retail distribution logs. These regulatory thresholds disproportionately burden artisanal cheesemakers and regional cooperatives, which lack the scale to amortize compliance costs across high volumes, accelerating consolidation as smaller players exit or merge. The CFIA's risk-based inspection model, which prioritizes high-volume facilities, inadvertently creates competitive asymmetry: large processors face more frequent audits but benefit from economies of scale in compliance infrastructure, while niche producers operate under less scrutiny yet struggle to afford third-party certification.
Rising Consumer Scrutiny Regarding Animal Welfare and Ethical Sourcing
The Code of Practice for the Care and Handling of Dairy Cattle, updated in 2024, establishes voluntary yet increasingly expected standards for housing, euthanasia, and pain management, with proAction certification, now required by all major processors, auditing compliance on 98% of Canadian dairy farms. Consumer expectations are outpacing regulatory minimums: 67% of Canadians surveyed in 2025 stated they would pay premiums for dairy products certified as "pasture-raised" or "free-range," yet Canada's climate limits outdoor grazing to 5 to 6 months annually in most regions, creating a credibility gap, according to the USDA Foreign Agricultural Service. Animal-rights advocacy groups are leveraging social media to spotlight practices such as calf separation and dehorning, prompting retailers like Loblaws and Metro to demand video documentation of animal-handling protocols from suppliers. This scrutiny raises operational costs; installing barn cameras and training staff on low-stress handling techniques adds CAD 10,000 to CAD 20,000 per farm and exposes processors to reputational risk if supplier farms are publicly criticized. The proAction program's animal-care module mitigates some risk by standardizing welfare metrics, yet it does not address philosophical objections to dairy production itself, leaving the sector vulnerable to campaigns that frame all animal agriculture as ethically problematic.
*Our forecasts treat driver/restraint impacts as directional, not additive. The impact forecasts reflect baseline growth, mix effects, and variable interactions.
Segment Analysis
By Product Type: Specialty Cheese Outpaces Commodity Cheddar
Cheese held 38.56% of the Canadian dairy Market share in 2025, yet the segment's composition is shifting as specialty varieties, including aged Gouda, artisanal blue, and ethnic formats like paneer and halloumi, are growing in the market. Mozzarella, the second-largest category, as foodservice pizza demand normalized post-pandemic, whereas processed cheese surged, driven by convenience-seeking households and institutional buyers prioritizing shelf stability. Retail cheese sales reached CAD 7.2 billion (USD 5.30 billion) in 2024, a 29% increase from CAD 5.6 billion in 2020, propelled by per-capita consumption rising to 15.24 kilograms per person, a 12% gain since 2014, according to the Agriculture and Agri-Food Canada[3]Source: Agriculture and Agri-Food Canada, “Cheese Sector Profile, September 2025,” agriculture.canada.ca. Imports claimed 59,060 metric tons in 2024, with the United States (34%), Italy (16%), and France (11%) dominating, yet tariff-rate quotas under CETA and CPTPP are enabling European cheesemakers to underprice domestic specialty producers in premium segments.
Yogurt is forecast to expand at 5.83% CAGR from 2026 to 2031, the fastest among product types, fueled by high-protein Greek and Icelandic skyr formats that appeal to fitness-conscious consumers and by drinkable yogurt pouches targeting on-the-go snacking. Retail yogurt sales climbed, with cottage cheese, a yogurt substitute in protein-focused diets, surging as social-media influencers promoted its versatility. Drinking milk, pressured by plant-based substitution and demographic shifts toward smaller households that waste less perishable fluid milk. Cream and dairy desserts, including ice cream, frozen novelties, and puddings, occupy niche roles, with ice cream consumption averaging 4 liters per capita annually and 25% of Canadians consuming it 3 to 4 times monthly, according to the Ontario Ministry of Agriculture, Food and Rural Affairs. Sour milk drinks, a traditional Eastern European category, remain marginal outside immigrant communities in Toronto and Vancouver.


By Distribution Channel: E-Commerce Disrupts Store-Based Retail
Off-trade channels commanded 84.25% of market share in 2025, encompassing supermarkets, hypermarkets, small local grocers, discounters, and warehouse clubs, yet this dominance is eroding as e-commerce has surged. Five national retailers, Loblaws, Sobeys, Metro, Walmart Canada, and Costco, control the majority of grocery sales, granting them oligopsony power to demand slotting fees, promotional funding, and private-label production from dairy processors. Online grocery platforms, accelerated by pandemic-era adoption, are now permanent fixtures: Instacart, Voilà by Sobeys, and PC Express collectively fulfill over 1 million dairy orders weekly, with subscription models (e.g., auto-delivery of milk and yogurt) reducing churn and locking in brand loyalty, according to the USDA Foreign Agricultural Service. Specialist retailers, cheese boutiques, and organic markets serve affluent urban consumers willing to pay premiums for curated selections, yet their collective share remains low.
On-trade channels, restaurants, hotels, cafeterias, and institutional foodservice are forecast to grow at a 5.56% CAGR through 2031, recovering from pandemic-era closures and benefiting from hybrid work models that normalize office-based meal occasions. Foodservice milk consumption rebounded in 2025 as employees returned to offices 3 to 4 days weekly, driving demand for coffee-bar dairy and cafeteria milk cartons. Quick-service restaurants are innovating with dairy-centric menu items, Tim Hortons' cold-brew lattes, A&W's cheese-topped burgers, that drive incremental cheese and cream volumes. Institutional buyers (hospitals, universities, correctional facilities) prioritize cost and shelf life, favoring processed cheese, UHT milk, and powdered milk, yet sustainability mandates are pushing them toward suppliers with carbon-neutral certifications. Convenience stores, though classified as off-trade, function as hybrid channels: they capture impulse purchases of single-serve yogurt and chocolate milk but lack refrigeration capacity for full dairy assortments, limiting their strategic relevance.
Geography Analysis
Ontario and Quebec collectively account for 72% of Canada's milk production, with Ontario's 3,357 dairy farms and Quebec's 4,847 farms anchoring a supply chain optimized for proximity to major urban markets, Toronto, Montreal, Ottawa, and to U.S. export corridors, according to the Agriculture and Agri-Food Canada. Ontario's average herd size of 78 cows reflects consolidation trends, yet the province remains a hotbed for innovation: Gay Lea Foods, with 1,400 member farms across Ontario and Manitoba, pioneered lactose-free butter and A2 milk, while Agropur's 3,024 farmer-members in Ontario and Quebec supply milk for both domestic retail and export-oriented cheese production as stated by Ontario Ministry of Agriculture, Food and Rural Affairs[4]Source: Ontario Ministry of Agriculture, Food and Rural Affairs, “Dairy Farming in Ontario, 2024,” ontario.ca . Quebec's cheese sector is particularly dynamic, producing 40% of Canada's specialty cheese and leveraging Protected Geographical Indication (PGI) status for varieties like Oka and Le Migneron to command export premiums in the United States and European Union. The province's cooperative model, exemplified by Agropur and Nutrinor, distributes profits back to farmer-members, insulating them from commodity-price volatility and enabling long-term investments in automation and sustainability.
British Columbia and Alberta represent 15% of national milk production, yet their markets exhibit distinct characteristics. British Columbia's Fraser Valley, home to 450 dairy farms, prioritizes organic and pasture-raised production, aligning with the province's environmentally conscious consumer base and commanding 20% to 30% retail premiums, according to the Agriculture and Agri-Food Canada. Alberta's 465 farms, concentrated near Calgary and Edmonton, focus on commodity milk and cheese for foodservice channels, though the province is emerging as a hub for functional dairy: protein-fortified milk and yogurt tailored to the region's fitness-oriented demographics. Atlantic Canada, comprising New Brunswick, Nova Scotia, Prince Edward Island, and Newfoundland, holds 5% of production, with 295 farms serving regional markets and facing higher logistics costs due to distance from central processing hubs. The region's dairy sector is stabilized by supply management, which guarantees farm-gate prices, yet it struggles to attract young farmers: the average operator age exceeds 55, raising succession-planning concerns.
Provincial regulatory divergence is creating competitive asymmetry. Quebec's Bill 64, which mandates bilingual labeling on all consumer-facing products, raises packaging costs by CAD 3,000 to CAD 8,000 per SKU for out-of-province processors targeting Montreal retailers. British Columbia's extended-producer-responsibility regulations, effective 2025, require dairy processors to fund recycling infrastructure for plastic yogurt cups and milk jugs, adding CAD 0.02 to CAD 0.05 per unit in stewardship fees. These provincial policies favor local processors with established compliance infrastructure, yet they fragment the national market and raise barriers for smaller players seeking pan-Canadian distribution
Competitive Landscape
The Canadian dairy Market exhibits moderate concentration, with Saputo, Lactalis, and Agropur acquiring the largest share, yet private-label dairy and regional cooperatives (Gay Lea, St-Albert Cheese, Organic Meadow) prevent oligopolistic pricing and sustain innovation in niche segments. Saputo's fiscal 2024 Canadian revenues of CAD 4.922 billion (USD 3.63 billion) increased 4.8% year over year, driven by retail-channel growth and margin expansion in specialty cheese. Its 18 plants and 6,000 employees enable vertical integration from milk procurement to retail distribution.
Lactalis, operating under brands like Black Diamond and Cheestrings, leverages its French parent's R&D capabilities to introduce European-style cheeses, brie, and camembert that command premiums in urban markets, while Agropur's cooperative structure allows it to prioritize farmer returns over shareholder dividends, creating strategic flexibility during commodity-price downturns. Technology adoption is differentiating leaders from laggards. Saputo's investments in automated cheese-aging facilities and real-time milk-quality sensors reduce batch variability and waste, while Agropur's blockchain-based traceability platform, piloted in 2025, enables retailers to verify farm-level sustainability claims, addressing consumer demand for transparency.
White-space opportunities persist in ethnic dairy (paneer, labneh, quark), lactose-free premium cheese, and protein-fortified dairy desserts, where incumbents have been slow to innovate. Smaller cooperatives like Mariposa Dairy and Upper Canada Cheese are exploiting these gaps by co-packing for private-label brands and direct-to-consumer e-commerce, bypassing traditional retail gatekeepers. Emerging disruptors include precision-fermentation startups, such as Remilk, whose animal-free beta-lactoglobulin received Health Canada approval in February 2024, that threaten to commoditize dairy proteins and erode processors' ingredient-sourcing advantages.
Canada Dairy Industry Leaders
Saputo Inc.
Agropur Dairy Co-operative
Groupe Lactalis
Danone S.A.
Gay Lea Foods
- *Disclaimer: Major Players sorted in no particular order

Recent Industry Developments
- October 2025: Danone Canada has invested $9 million in its Boucherville plant for the production of recyclable PET yogurt cups, integrating 30% recycled content and advancing sustainability. The initiative is backed by Quebec’s government and targets reduced plastic pollution.
- April 2025: Lactalis Canada partnered with Nestlé Canada to enter the frozen yogurt category, launching iÖGO and iÖGO nanö products made with real fruit and 100% Canadian milk. The range offers SKUs in bars, tubs, and pops, distributed nationally.
- February 2025: Oikos, a Danone Canada brand, launched the Oikos PRO line of high-protein, no added sugar Greek yogurts and drinkable yogurts. The range is locally made using 100% Canadian dairy milk and targets fitness-focused consumers seeking nutritional value.


Canada Dairy Market Report Scope
The dairy market is the global industry that produces, processes, distributes, and sells milk and milk-derived products such as butter, cheese, yogurt, and cream. The report segments the market by product type and distribution channel. By product type, it covers the butter segment, including salted and unsalted butter. The cheese segment is divided into natural cheese and processed cheese. Natural cheese is further categorized into cheddar, cottage, ricotta, parmesan, and others. The cream segment includes fresh cream, cooking cream, whipping cream, and other types. The dairy desserts segment includes ice cream, cheesecakes, frozen desserts, and other desserts. The milk segment includes condensed milk, flavored milk, fresh milk, UHT (ultra-high-temperature) milk, and powdered milk. The yogurt segment is divided into drinkable and spoonable yogurt. The report also covers sour milk drinks, assessing niche demand and regional consumption dynamics. By distribution channel, the market is segmented into on-trade and off-trade. The off-trade segment analyzes retail sales through convenience stores, specialist retailers, supermarkets and hypermarkets, online retail, and other channels. The study presents detailed market estimates and projections in both value and volume terms
| Butter | Salted Butter | |
| Unsalted Butter | ||
| Cheese | Natural Cheese | Cheddar |
| Cottage | ||
| Ricotta | ||
| Parmesan | ||
| Others | ||
| Processed Cheese | ||
| Cream | Fresh Cream | |
| Cooking Cream | ||
| Whippng Cream | ||
| Others (Clottted, Sour Cream) | ||
| Dairy Desserts | Ice Cream | |
| Cheesecakes | ||
| Frozen Desserts | ||
| Others (Puddings/desserts, trifles, fools) | ||
| Milk | Condensed milk | |
| Flavored Milk | ||
| Fresh Milk | ||
| UHT Milk (Ultra-high temperature milk) | ||
| Powdered Milk | ||
| Yogurt | Drinkable | |
| Spoonable | ||
| Sour Milk Drinks | ||
| On-trade | |
| Off-trade | Convenience Stores |
| Specialist Retailers | |
| Supermarkets and Hypermarkets | |
| Online Retail | |
| Others |
| By Product Type | Butter | Salted Butter | |
| Unsalted Butter | |||
| Cheese | Natural Cheese | Cheddar | |
| Cottage | |||
| Ricotta | |||
| Parmesan | |||
| Others | |||
| Processed Cheese | |||
| Cream | Fresh Cream | ||
| Cooking Cream | |||
| Whippng Cream | |||
| Others (Clottted, Sour Cream) | |||
| Dairy Desserts | Ice Cream | ||
| Cheesecakes | |||
| Frozen Desserts | |||
| Others (Puddings/desserts, trifles, fools) | |||
| Milk | Condensed milk | ||
| Flavored Milk | |||
| Fresh Milk | |||
| UHT Milk (Ultra-high temperature milk) | |||
| Powdered Milk | |||
| Yogurt | Drinkable | ||
| Spoonable | |||
| Sour Milk Drinks | |||
| By Distribution Channel | On-trade | ||
| Off-trade | Convenience Stores | ||
| Specialist Retailers | |||
| Supermarkets and Hypermarkets | |||
| Online Retail | |||
| Others | |||


Market Definition
- Butter - Butter is a yellow-to-white solid emulsion of fat globules, water, and inorganic salts produced by churning the cream from cows’ milk
- Dairy - Dairy product include milk and any of the foods made from milk, including butter, cheese, ice cream, yogurt, and condensed and dried milk.
- Frozen Desserts - Frozen dairy dessert means and includes products containing milk or cream and other ingredients which are frozen or semi-frozen prior to consumption, such as ice milk or sherbet, including frozen dairy desserts for special dietary purposes, and sorbet
- Sour Milk Drinks - Sour milk is thick, curdled milk, with a sour taste, obtained from the fermentation of milk. Sour milk drinks such as kefir, laban, buttermilk have been considered in the study
| Keyword | Definition |
|---|---|
| Cultured Butter | Cultured butter is prepared by having the raw butter go through chemical processing and has been added with certain emulsifiers and foreign ingredients. |
| Uncultured Butter | This type of butter is one which has not been processed in any way |
| Natural Cheese | The type of cheese in its most natural form. It is made from natural and simple products and ingredients, including fresh and natural salts, natural colors, enzymes, and high-quality milk. |
| Processed Cheese | Processed cheese undergoes the same processes as natural cheese; however, it requires more steps and many different forms of ingredients. Making processed cheese involves melting natural cheese, emulsifying it, and adding preservatives and other artificial ingredients or colorings. |
| Single Cream | Single cream contains around 18% fat. It’s a single layer of cream that appears over boiled milk. |
| Double Cream | Double cream contains 48% fat, more than double the amount of fat of single cream. It’s heavier and thicker than single cream |
| Whipping Cream | This has a much higher fat percentage than single cream (36%). Used to top cakes, pies, and puddings and as a thickener for sauces, soups, and fillings. |
| Frozen Desserts | Desserts that are meant to be eaten in frozen condition. E.g., sherbets, sorbets, frozen yogurts |
| UHT Milk (Ultra-high temperature milk) | Milk heated at a very high temperature. Ultra-high-temperature processing (UHT) of milk involves heating for 1–8 sec at 135–154°C. which kills the spore-forming pathogenic microorganism, resulting in a product with a shelf-life of several months. |
| Non-dairy butter/Plant-based butter | Butter made from plant-derived oil such as coconut, palm, etc. |
| Non-dairy Yogurt | Yogurt made from typically made from nuts, like almonds, cashews, coconuts, and even other foods like soybeans, plantains, oats, and peas |
| On-trade | It refers to restaurants, QSRs, and bars. |
| Off-trade | It refers to supermarkets, hypermarkets, on-line channels, etc. |
| Neufchatel cheese | One of the oldest kinds of cheese in France. It is a soft, slightly crumbly, mold-ripened, bloomy-rind cheese made in the Neufchâtel-en-Bray region of Normandy. |
| Flexitarian | It refers to a consumer preferring a semi-vegetarian diet, that is centered on plant foods with limited or occasional inclusion of meat. |
| Lactose Intolerance | Lactose intolerance is a reaction in digestive system to lactose, the sugar in milk. It causes uncomfortable symptoms in response to the consumption of dairy products. |
| Cream Cheese | Cream cheese is a soft and creamy fresh cheese with a tangy taste made from milk and cream. |
| Sorbets | Sorbet is a frozen dessert made using ice combined with fruit juice, fruit purée, or other ingredients, such as wine, liqueur, or honey. |
| Sherbet | Sherbet is a sweetened frozen dessert made with fruit and some sort of dairy product such as milk or cream. |
| Shelf stable | Foods that can be safely stored at room temperature, or "on the shelf," for at least one year and do not have to be cooked or refrigerated to eat safely. |
| DSD | Direct Store Delivery is the process in supply chain management wherein the product is delivered from manufacturing plant directly to the retailer. |
| OU Kosher | Orthodox Union Kosher is a kosher certification agency based in New York City. |
| Gelato | Gelato is a frozen creamy dessert made with milk, heavy cream and sugar. |
| Grass-fed Cows | Grass-fed cows are allowed to graze in pastures, where they eat a variety of grasses and clover. |


Research Methodology
Mordor Intelligence follows a four-step methodology in all our reports.
- Step-1: Identify Key Variables: In order to build a robust forecasting methodology, the variables and factors identified in Step 1 are tested against available historical market numbers. Through an iterative process, the variables required for market forecast are set, and the model is built on the basis of these variables.
- Step-2: Build a Market Model: Market-size estimations for the forecast years are in nominal terms. Inflation is not a part of the pricing, and the average selling price (ASP) is kept constant throughout the forecast period for each country.
- Step-3: Validate and Finalize: In this important step, all market numbers, variables, and analyst calls are validated through an extensive network of primary research experts from the market studied. The respondents are selected across levels and functions to generate a holistic picture of the market studied.
- Step-4: Research Outputs: Syndicated Reports, Custom Consulting Assignments, Databases & Subscription Platforms


