Market Overview
| Study Period | 2019 - 2030 |
|---|---|
| Forecast Data Period | 2025 - 2030 |
| Historical Data Period | 2019 - 2023 |
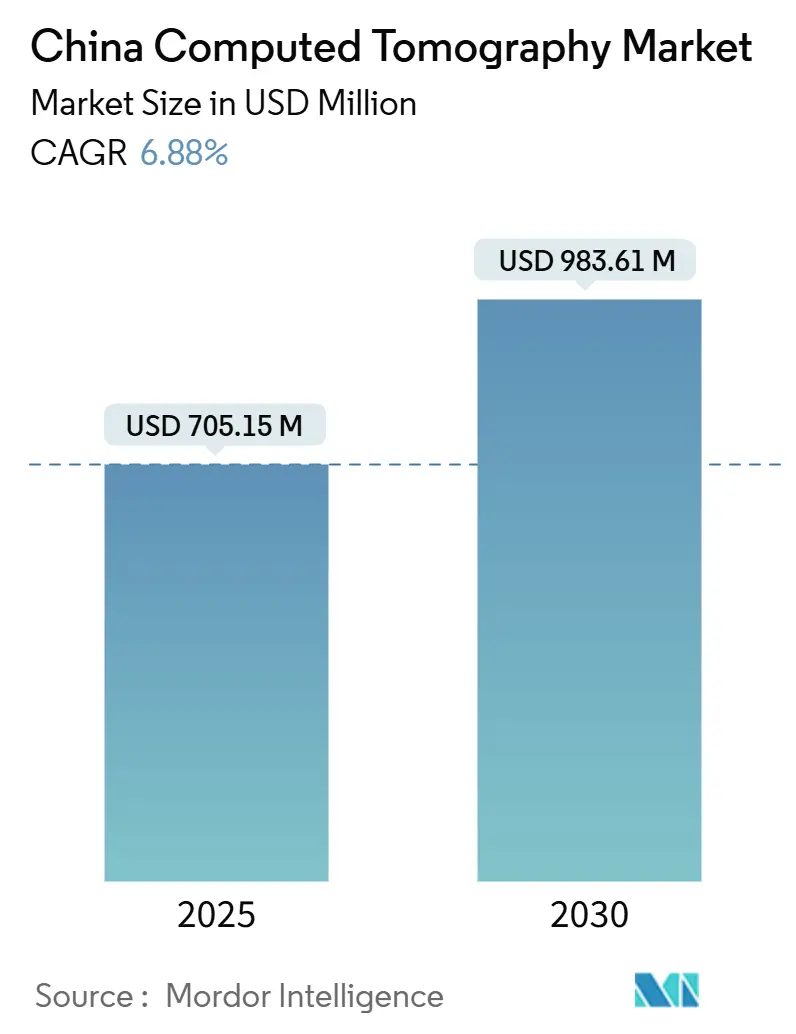
| Market Size (2025) | USD 705.15 Million |
| Market Size (2030) | USD 983.61 Million |
| Growth Rate (2025 - 2030) | 6.88% CAGR |
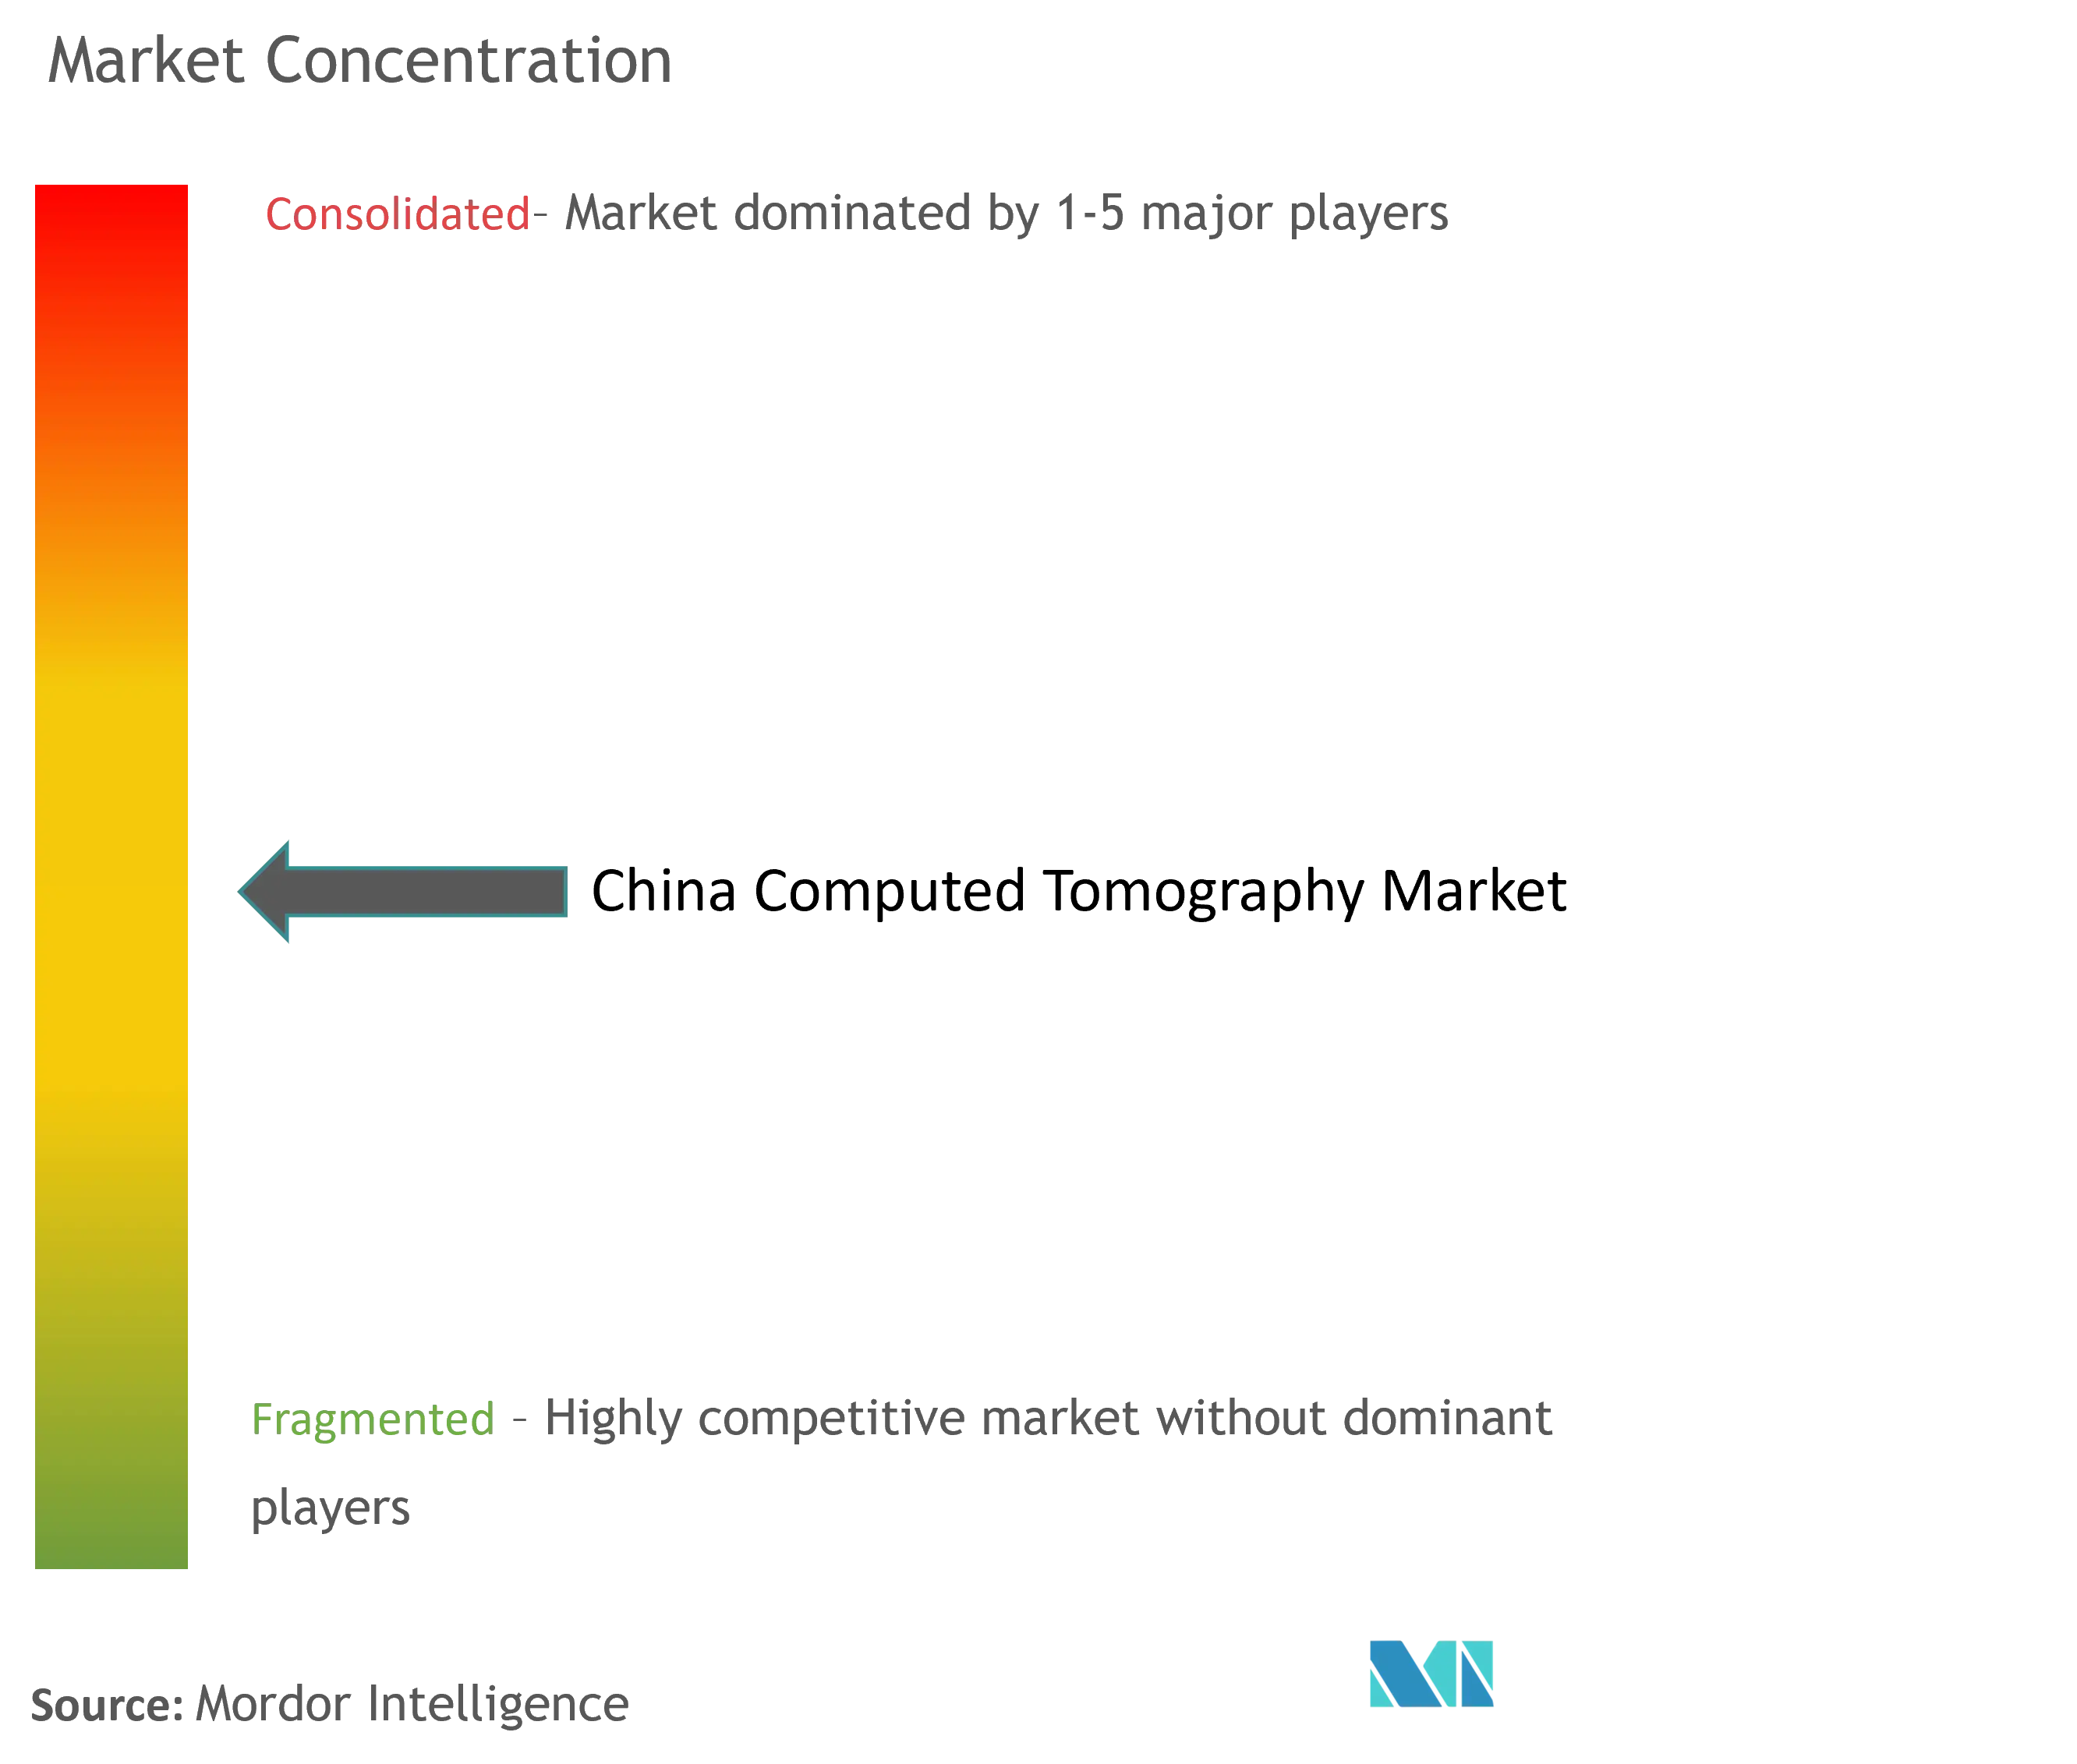
| Market Concentration | Medium |
Major Players *Disclaimer: Major Players sorted in no particular order Image © Mordor Intelligence. Reuse requires attribution under CC BY 4.0. | |
China Computed Tomography Market Analysis by Mordor Intelligence
The China computed tomography market size stands at USD 705.15 million in 2025 and is projected to reach USD 983.61 million by 2030, registering a 6.88% CAGR. Sustained government hospital-upgrade subsidies, an aging population’s chronic disease burden, and the rapid uptake of photon-counting and AI-enhanced scanners anchor this growth trajectory. Volume-Based Procurement (VBP) policies compress vendor margins yet shorten replacement cycles, which keeps order pipelines active across public hospitals. Localized component supply chains lower bill-of-materials costs for domestic OEMs and improve price competitiveness, while foreign brands retain an edge in high-end spectral and photon-counting systems that cut radiation doses by up to 50%. Intensifying commercial health-insurance uptake in tier-1 and tier-2 cities further widens the addressable patient pool for advanced cross-sectional imaging.
Key Report Takeaways
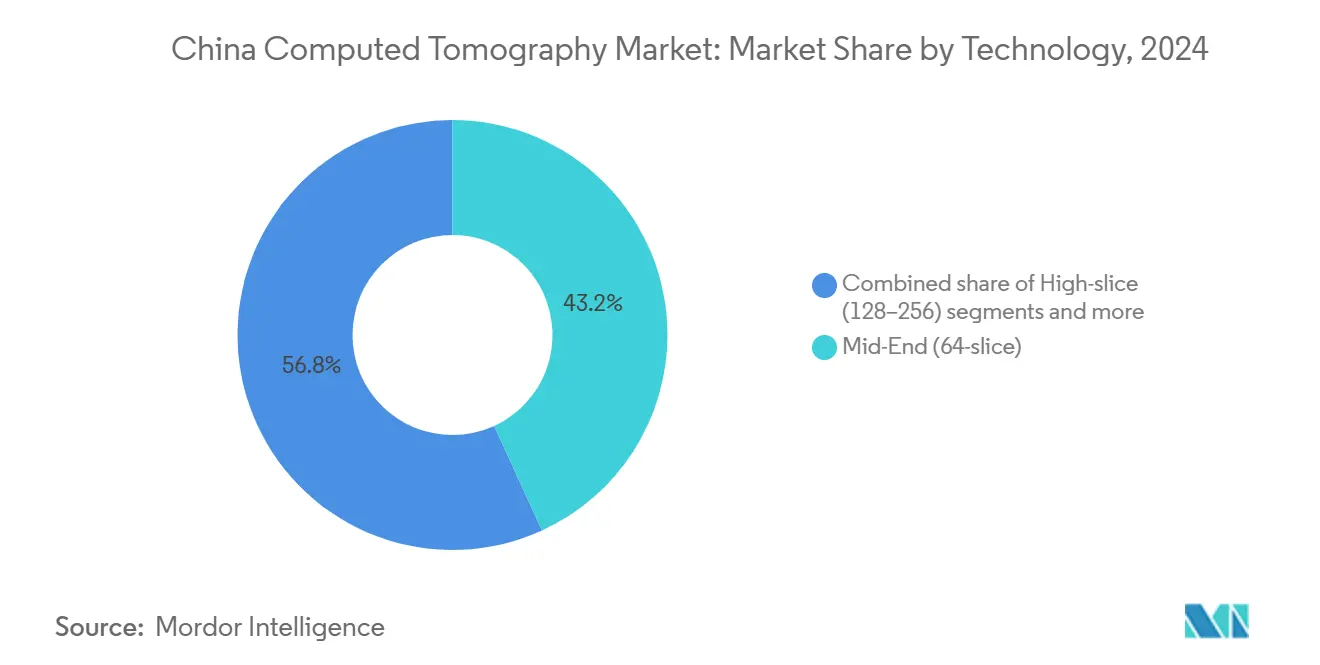
By technology, mid-slice systems led with 43.16% revenue share of the China computed tomography market in 2024; high-slice platforms are forecast to expand at a 7.04% CAGR through 2030.
By product type, stationary scanners held 88.79% of the China computed tomography market share in 2024, while portable/mobile units show the highest projected 6.94% CAGR to 2030.
By application, oncology dominated with 42.82% share of the China computed tomography market size in 2024 and maintains a 6.88% growth pace to 2030.
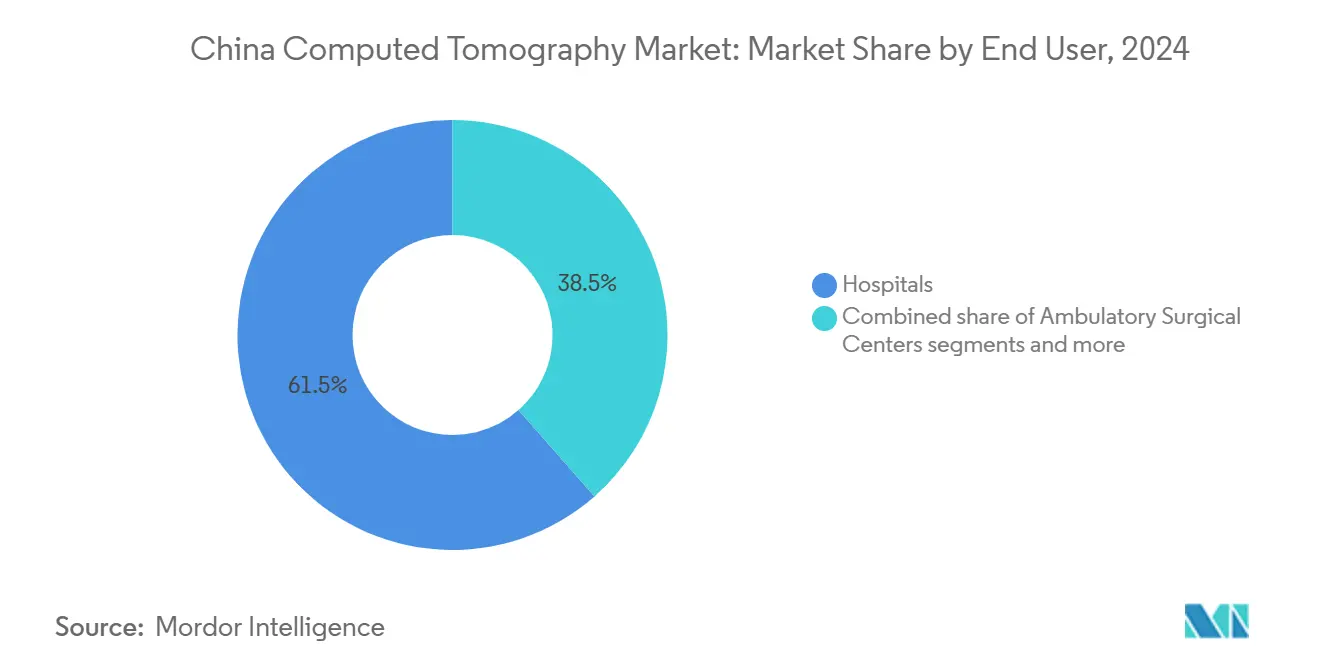
By end-user, hospitals accounted for 61.48% of the China computed tomography market share in 2024; ambulatory surgical centers are advancing at a 7.83% CAGR through 2030.
By device architecture, spiral CT captured 81.82% of the China computed tomography market in 2024, whereas C-arm CT is projected to rise at a 7.36% CAGR to 2030.
China Computed Tomography Market Trends and Insights
Driver Impact Analysis*
| Driver | (~) % Impact on CAGR Forecast | Geographic Relevance | Impact Timeline |
|---|---|---|---|
| Hospital-upgrade subsidies & chronic-disease surge | +1.2% | National, tier-1 & tier-2 cities | Medium term (2-4 years) |
| AI, photon-counting & spectral-CT adoption | +0.9% | National, major medical centers | Medium term (2-4 years) |
| Centralized VBP replacement cycle | +0.7% | National, public hospitals | Short term (≤ 2 years) |
| Localized component supply cost cuts | +0.6% | National, domestic OEMs | Long term (≥ 4 years) |
| Commercial health-insurance expansion | +0.4% | Urban tier-1 & tier-2 | Long term (≥ 4 years) |
| “Made-in-China 2025” innovation incentives | +0.5% | National | Long term (≥ 4 years) |
| Source: Mordor Intelligence | |||
Government hospital-upgrade subsidies & aging-driven chronic-disease surge
Targeted subsidies under the State Council’s 2024 medical-device reform directly fund CT procurement in tertiary and secondary hospitals, compressing replacement timelines to under four years[1]Source: National Medical Products Administration, “Opinions on Deepening Reform of Medical-Device Regulation,” english.nmpa.gov.cn . The same policy introduces priority review pathways that cut device approval times in pilot regions from 60 to 30 working days, accelerating market entry for premium photon-counting systems. Demographically, the share of citizens aged ≥ 65 surpassed 15% in 2024, which pushes chronic disease screening volumes upward in oncology and cardiology programs. Hospitals align capital budgets with these public-health mandates, favoring scanners that integrate AI-enabled organ-dose tracking to meet safety requirements. The combined demographic and funding tailwinds are therefore pivotal to the China computed tomography market trajectory.
Rapid AI, photon-counting & spectral-CT adoption boosting clinical utility
Artificial intelligence already triages chest and abdominal scans, reducing radiologist interpretation time by 30% at reference centers in Beijing and Shanghai. Photon-counting Naeotom Alpha units deliver intrinsic spectral data that facilitates simultaneous plaque characterization and lung nodule screening at a 50% lower dose, which raises diagnostic yield per scan. Early adopters leverage these gains to justify premium procurement prices within the VBP framework by citing reductions in follow-up imaging and contrast use. Clinical societies now incorporate AI-assisted coronary calcium scoring into national guidelines, institutionalizing demand. These technology inflections together raise average selling prices even as base-model prices fall, underpinning value growth in the China computed tomography market.
Centralized Volume-Based Procurement (VBP) catalyzing replacement cycle
VBP rounds finalized in 2024 lowered average CT purchase prices by 17% yet doubled unit order volumes across provincial hospital alliances. Lower acquisition costs allow radiology departments to refresh scanners every 10-20 months, a cycle far shorter than the global 2-6-year average. Manufacturers, domestic and foreign, now synchronize production schedules with predictable semiannual VBP tenders, which stabilizes revenue visibility despite thinner margins. This environment heightens competition on image quality and AI-workflow add-ons rather than sticker price alone. The resulting sales cadence sustains hardware turnover that propels the China computed tomography market despite pricing pressure.
Localized component supply slashing BOM costs for domestic OEMs
Wuxi-based X-ray tube foundries have pared import duties and logistics lags, slicing 12% from bill-of-materials for 128-slice systems delivered in 2025. Domestic OEMs redirect these cost savings toward in-house AI algorithm teams, closing performance gaps with foreign peers while keeping prices low. Shorter component lead times mitigate the impact of tariff swings and pandemic-era shipping disruptions, ensuring on-time VBP contract fulfillment. The strategy also bolsters after-sales service, since locally sourced tubes and detectors can be swapped within 48 hours, a key criterion in provincial tenders. These cumulative efficiencies position domestic brands to capture greater share of the China computed tomography market as procurement nationalism intensifies.
Restraint Impact Analysis*
| Restraint | (~) % Impact on CAGR Forecast | Geographic Relevance | Impact Timeline |
|---|---|---|---|
| High capital & service costs amid tightening hospital budgets | -0.8% | National, affecting smaller hospitals and rural facilities | Short term (≤ 2 years) |
| Radiation-dose concerns & stricter NMPA safety compliance | -0.5% | National, with enhanced scrutiny on new technologies | Medium term (2-4 years) |
| Margin squeeze from VBP price erosion for vendors & distributors | -0.6% | National, affecting all market participants in public procurement | Short term (≤ 2 years) |
| Radiologist shortage limiting scanner utilization in lower-tier cities | -0.4% | Central and western regions, rural areas | Long term (≥ 4 years) |
| Source: Mordor Intelligence | |||
High capital & service costs amid tightening hospital budgets
Anti-corruption probes froze discretionary budgets in 11 provinces in 2024, delaying CT orders for six months on average and forcing vendors to extend credit terms. Rural and county-level facilities struggle to finance service contracts that can total 8% of scanner list price annually, even after VBP price cuts. Hospitals divert limited funds toward essential drug procurement when reimbursement ceilings are reached, leaving upgrade plans unfunded. Vendors respond with pay-per-scan models and tube insurance packages, yet adoption remains modest due to administrative complexity. These financing frictions suppress immediate demand, tempering growth in the China computed tomography market.
Radiation-dose concerns & stricter NMPA safety compliance
Unique Device Identification (UDI) mandates in 2025 require serialization down to detector array level, adding manufacturing overhead and documentation tasks. New pediatric dose caps compel software redesign for automatic dose-length modulation, prolonging validation cycles. Hospitals now demand proof of cumulative dose tracking interfaces before signing purchase contracts, which increases pre-sale education costs. Foreign suppliers face additional on-site factory audits because domestic authorities scrutinize imported source codes for AI modules. These layered compliance expectations lengthen commercialization timelines and elevate engineering expenses, reducing net margins in the China computed tomography market.
*Our forecasts treat driver/restraint impacts as directional, not additive. The impact forecasts reflect baseline growth, mix effects, and variable interactions.
Segment Analysis
By Technology: Mid-Slice Systems Face High-End Disruption
Mid-slice scanners, especially 64-slice units, captured 43.16% revenue in 2024, underscoring their clinical versatility within county and municipal hospitals that handle broad diagnostic workloads. This bracket balances capital cost with throughput, securing contracts in VBP tenders where film-reading studies show mid-slice adequacy for 80% of routine cases. However, the high-slice cohort (128–256 slice) posts a 7.04% CAGR to 2030 as tertiary centers pivot toward cardiac and triple-rule-out protocols. AI-powered iterative reconstruction now speeds throughput by 20%, turning high-slice installations into profit centers that offset their premium list prices. Photon-counting detectors loom as a disruptor by 2027, promising spectral data without double exposures, which could render dual-energy architectures obsolete in flagship hospitals. In parallel, low-slice (<64) models lose share, though they remain vital in mobile stroke units and first-aid stations, buffering revenue volatility for domestic OEMs.
Second-tier cities increasingly stipulate coronary workflow optimization in CT purchase criteria, a requirement met more efficiently by 128-slice systems that capture an entire heart in one rotation. Public-private partnership hospitals in Nanjing and Qingdao have already earmarked 2026 budgets for full-field photon-counting pilots, aspiring to lower contrast volume per study by 40%. Vendors differentiate via AI-generated organ-specific protocols that auto-tune kV and mAs levels, ensuring radiation compliance under new NMPA guidelines. This performance arms race elevates long-term demand for high-slice and spectral configurations, tightening competition in the upper tier of the China computed tomography market.


By Product Type: Portable Units Challenge Stationary Dominance
Stationary scanners sustained 88.79% of 2024 revenue as hospitals relied on fixed suites integrated with PACS and power infrastructure. These installations deliver superior heat capacity and accommodate high-throughput routines, factors that align with China’s 15-hour-per-day imaging operations in tier-1 centers. Emergency departments favor compact 32-slice roll-in units that cut transfer times for poly-trauma cases. Mobile lung-screening vans, co-funded by provincial cancer programs, extend access to peri-urban populations, creating incremental scan volume that feeds teleradiology networks. Early field data from Sichuan demonstrate a 22% increase in nodule detection during outreach screenings using AI-triaged portable CT, underscoring clinical value.
Private imaging chains deploy mobile CT fleets to corporate campuses for annual check-ups, paving a direct-to-consumer channel in the China computed tomography market. Vendors exploit this demand by engineering detachable gantries and battery-assisted drive systems that traverse elevators and tight corridors in high-rise clinics. Recent NMPA guidance streamlines Class II clearance for mobile units without contrast injectors, which shortens regulatory cycles to under eight months. Domestic brands now ship purpose-built 16-slice models at USD 380,000, a price point 18% below imported equivalents, leveraging localized detector sourcing. Collectively, these innovations erode stationary hegemony and diversify revenue streams.
By Application: Oncology Leadership Amid Dental Surge
Oncology preserved 42.82% share of 2024 revenues, thanks to comprehensive lung and colorectal screening mandates that reimbursed 5.3 million CT exams nationwide. The segment benefits from dual-energy protocols that differentiate lesion vascularity without incremental contrast, aligning with radiation-dose reduction goals. Cardiology sits as the second-largest application, buoyed by guidelines that recommend coronary CT angiography as a gatekeeper before invasive cath procedures. Neurology follows closely, driven by time-critical stroke pathways that rely on perfusion CT in tertiary stroke centers.
Elective implantology growth fuels cone-beam CT installs in private clinics, which value compact footprints and lower radiation doses. NMPA classifies dental CT under Class II devices, streamlining filings and spurring local entrants. Municipal subsidy programs reimburse up to 30% of equipment cost for dental clinics that perform rural outreach, widening market breadth. This cascade of policy and elective demand shifts incremental revenue toward the dental segment, broadening application diversity within the China computed tomography market.
By End-User: Hospital Dominance Faces Ambulatory Disruption
Hospitals captured 61.48% of 2024 revenue, reflecting entrenched referral patterns and VBP access to latest-generation scanners. Public facilities dominate hardware counts, yet private hospitals post faster same-store scan growth as self-pay patients seek shorter queues. Price ceilings tied to Diagnosis-Related Groups (DRGs) restrain public-hospital margins, prompting these institutions to embrace AI-driven throughput gains that lift scans per day from 110 to 140. The China computed tomography market share held by hospitals is forecast to shrink modestly as outpatient modalities expand.
Ambulatory surgical centers and independent imaging clinics grow at a 7.83% CAGR, underpinned by regulatory liberalization that permits non-hospital ownership of large-bore CT systems. Centers in Guangzhou pilot bundled colonoscopy-plus-CT screening packages, capturing wellness-oriented consumers. Diagnostic imaging chains negotiate volume-based tube replacement contracts with local suppliers, ensuring uptime comparable to hospital standards. Veterinary clinics and academic institutes contribute niche demand—veterinary growth is visible in premium pet hospitals installing 16-slice models for oncological staging. Altogether, the end-user mix diversifies revenue streams and raises service delivery innovation in the China computed tomography market.
By Device Architecture: Spiral CT Dominance Amid Emerging Alternatives
Spiral/helical configurations generated 81.82% of revenues in 2024, a testament to their balance of speed, dose efficiency, and reconstruction flexibility. Continuous rotation accommodates high-volume chest and abdomen protocols typical in urban megahospitals. Ring-gantry variants command niche adoption for motion-sensitive cardiac imaging, leveraging ultra-fast rotation that freezes coronary motion. Flat-panel detector CT remains a specialty modality in interventional suites, valued for wide bore and real-time imaging.
C-arm CT grows at a 7.36% CAGR as hybrid ORs proliferate across tier-3 hospitals supported by government funding. Neurosurgeons employ intraoperative scans to verify screw placement, reducing revision rates by 25%. O-arm systems, though costlier, find footholds in spine centers focusing on MISS (minimally invasive spine surgery). Vendors hedging against photon-counting disruption invest R&D into cone-beam reconstruction that could merge surgical and diagnostic workflows, expanding addressable markets. These architectural shifts continue to reinforce technology stratification within the China computed tomography market.
Geography Analysis
Eastern provinces, led by Beijing, Shanghai, and Guangdong, accounted for nearly 55% of 2024 installations owing to higher GDP per capita and dense concentrations of tertiary hospitals. These regions attract early photon-counting pilots because clinicians demand spectral differentiation to manage complex oncology workloads. Reimbursement policies here cover advanced CT without pre-authorization, accelerating utilization. Local service hubs enable four-hour on-site tube swaps, a key uptime metric that influences tender scoring.
Central provinces such as Hubei and Hunan experience 8% annual growth, underpinned by Healthy China 2030 infrastructure grants earmarked for county-level trauma centers. AI-driven teleradiology mitigates radiologist shortages, ensuring that newly installed scanners maintain utilization rates above 60%. Western regions, including Sichuan and Shaanxi, exhibit the fastest 10% unit growth yet begin from a low base. Portable CT fleets support rural cancer-screening drives, while mobile trauma vans stationed on expressways cut golden-hour delays.
Regional insurance diversity shapes purchasing decisions. Eastern commercial insurers reimburse spectral CT for plaque characterization, justifying high-slice upgrades. Central provinces rely on basic social insurance, so VBP-priced 64-slice systems predominate. Western governments waive import duties for public hospitals purchasing first-in-region high-slice platforms, boosting the China computed tomography market size in underpenetrated areas. Service-network density remains a constraint; hence vendors co-locate parts depots near emerging economic zones to enhance service-level compliance.
Competitive Landscape
The market reflects moderate consolidation with Siemens Healthineers, GE HealthCare, Canon Medical, Philips, and United Imaging compete on detector innovation, AI ecosystems, and service wrap-arounds. European Commission findings that 87% of Chinese tenders included foreign-supplier restrictions pressure multinationals to localize assembly lines. GE and Siemens have expanded component sourcing in Suzhou and Wuxi to meet domestic-content thresholds.
Domestic leaders United Imaging and Mindray leverage VAT rebates and localized supply chains to undercut imports by 15% on list price while matching image quality in 128-slice tiers. They bundle AI contouring modules and tube-warranty extensions, differentiating on lifecycle cost. Smaller disruptors such as Anke High-Tech target portable niches with ultra-light 16-slice systems weighing under 1.2 tons, ideal for elevator transport in outpatient clinics.
Strategic moves include Siemens allocating USD 670 million of its USD 27.38 billion medtech investment toward photon-counting R&D. United Imaging tripled Texas factory capacity in 2025 to bypass 145% tariffs when exporting to the United States, hedging geopolitical risk. GE HealthCare partnered with Kalbe to build a CT assembly plant in Indonesia, signaling a distributed manufacturing model that could replicate in China’s hinterland. These maneuvers all intensify the innovation cadence that defines competitive advantage in the China computed tomography market.
China Computed Tomography Industry Leaders
GE Healthcare
FUJIFILM Holdings Corporation
Canon Medical Systems
Koninklijke Philips N.V.
Siemens Healthineers
- *Disclaimer: Major Players sorted in no particular order

Recent Industry Developments
- March 2025: China's NMPA published comprehensive medical device regulatory reform guidelines establishing priority review pathways for innovative devices and shortened clinical trial timelines from 60 to 30 working days in pilot regions
- January 2025: European Commission published investigation findings documenting systematic discrimination against EU medical device firms in Chinese procurement, citing 87% of tenders containing foreign supplier restrictions, directly impacting foreign CT scanner manufacturers' market access


China Computed Tomography Market Report Scope
As per the scope of the report, computed tomography (CT) is an imaging process that customizes special X-ray equipment to generate a sequence of exhaustive images or scans of areas inside the body.
China's computed tomography (CT) market is segmented by type, application, and end user. By type, the market is segmented into low slice, medium slice, and high slice. By application, the market is segmented into oncology, neurology, cardiovascular, musculoskeletal, and other applications. By end user, the market is segmented into hospitals, diagnostic centers, and other end users. The report offers the value (USD) for all the above segments.
By Technology (Slice Count)
| Low-slice (<64) |
| Mid-slice (64) |
| High-slice (128–256) |
By Product Type
| Stationary CT Scanners |
| Portable / Mobile CT Scanners |
By Application
| Oncology | Lung Cancer Screening |
| Head & Neck Oncology | |
| Colorectal Oncology | |
| Other Oncology | |
| Cardiology | Coronary CT Angiography |
| Calcium Scoring | |
| Structural Heart Disease | |
| Neurology | Stroke Assessment |
| Brain Trauma | |
| Vascular | Peripheral Vascular Disease |
| Pulmonary Angiography | |
| Musculoskeletal | Orthopedic Trauma |
| Sports Injuries | |
| Dental & Maxillofacial | |
| Trauma & Emergency | |
| Other Applications |
By End-User
| Hospitals | Public Hospitals |
| Private Hospitals | |
| Diagnostic Imaging Centers | |
| Dental Clinics | |
| Veterinary Clinics & Hospitals | |
| Academic & Research Institutes |
By Device Architecture
| Spiral / Helical CT |
| Ring-Gantry CT |
| C-arm CT |
| O-arm CT |
| Flat-Panel Detector CT |
| By Technology (Slice Count) | Low-slice (<64) | |
| Mid-slice (64) | ||
| High-slice (128–256) | ||
| By Product Type | Stationary CT Scanners | |
| Portable / Mobile CT Scanners | ||
| By Application | Oncology | Lung Cancer Screening |
| Head & Neck Oncology | ||
| Colorectal Oncology | ||
| Other Oncology | ||
| Cardiology | Coronary CT Angiography | |
| Calcium Scoring | ||
| Structural Heart Disease | ||
| Neurology | Stroke Assessment | |
| Brain Trauma | ||
| Vascular | Peripheral Vascular Disease | |
| Pulmonary Angiography | ||
| Musculoskeletal | Orthopedic Trauma | |
| Sports Injuries | ||
| Dental & Maxillofacial | ||
| Trauma & Emergency | ||
| Other Applications | ||
| By End-User | Hospitals | Public Hospitals |
| Private Hospitals | ||
| Diagnostic Imaging Centers | ||
| Dental Clinics | ||
| Veterinary Clinics & Hospitals | ||
| Academic & Research Institutes | ||
| By Device Architecture | Spiral / Helical CT | |
| Ring-Gantry CT | ||
| C-arm CT | ||
| O-arm CT | ||
| Flat-Panel Detector CT | ||


Key Questions Answered in the Report
How large is the China computed tomography market in 2025?
It is valued at USD 705.15 million in 2025 and is projected to grow to USD 983.67 million by 2030 at a 6.88% CAGR.
Which technology segment is growing fastest?
High-slice (128- 256 slice) scanners post the quickest 7.04% CAGR through 2030, driven by cardiac and spectral imaging demand.
Why are photon-counting detectors important?
They cut dose by up to 50% while providing intrinsic spectral data, improving diagnostic accuracy and aligning with NMPA dose mandates.
What role does Volume-Based Procurement play?
VBP lowers purchase prices yet accelerates replacement cycles, leading hospitals to refresh scanners every 10-20 months.
How are domestic OEMs gaining an edge?
Localized component sourcing reduces costs and meets Made-in-China 2025 content targets, enabling competitive pricing and rapid after-sales service.
Which end-user segment shows the highest growth?
Ambulatory surgical centers lead with a 7.83% CAGR as outpatient procedures rise and independent imaging clinics expand.
Page last updated on:


