Market Overview
| Study Period | 2021 - 2031 |
|---|---|
| Forecast Data Period | 2026 - 2031 |
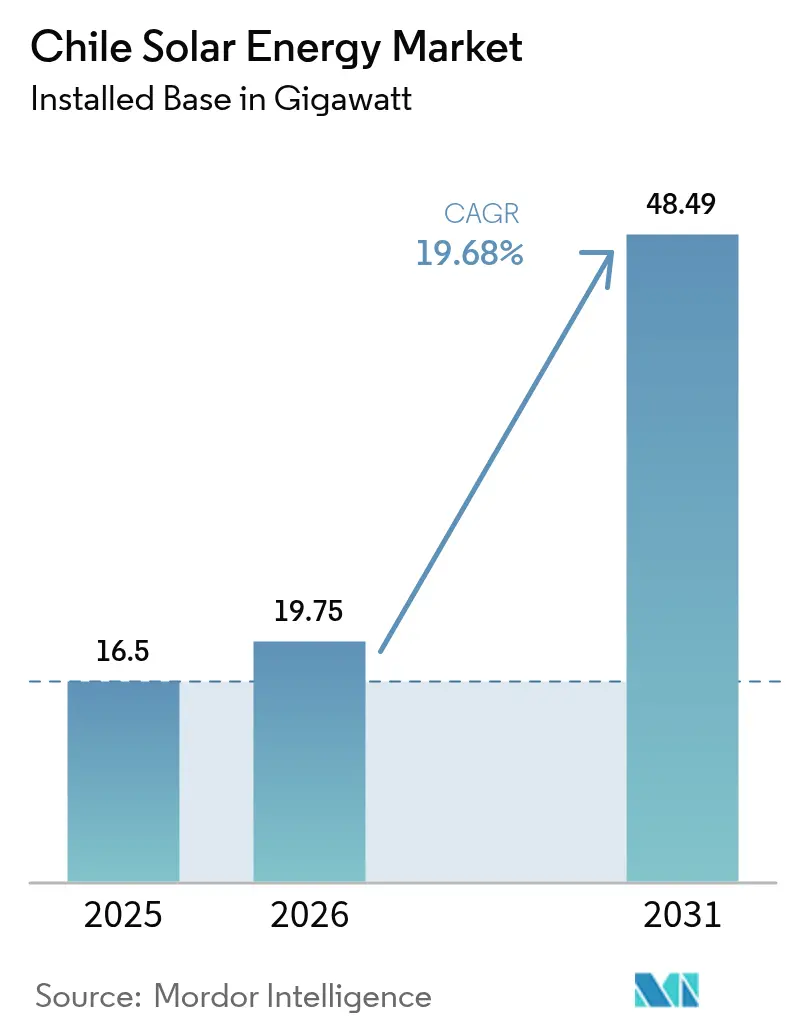
| Base Year Market Size (2025) | 16.5 gigawatt |
| Market Volume (2026) | 19.75 gigawatt |
| Market Volume (2031) | 48.49 gigawatt |
| Growth Rate (2026 - 2031) | 19.68% CAGR |
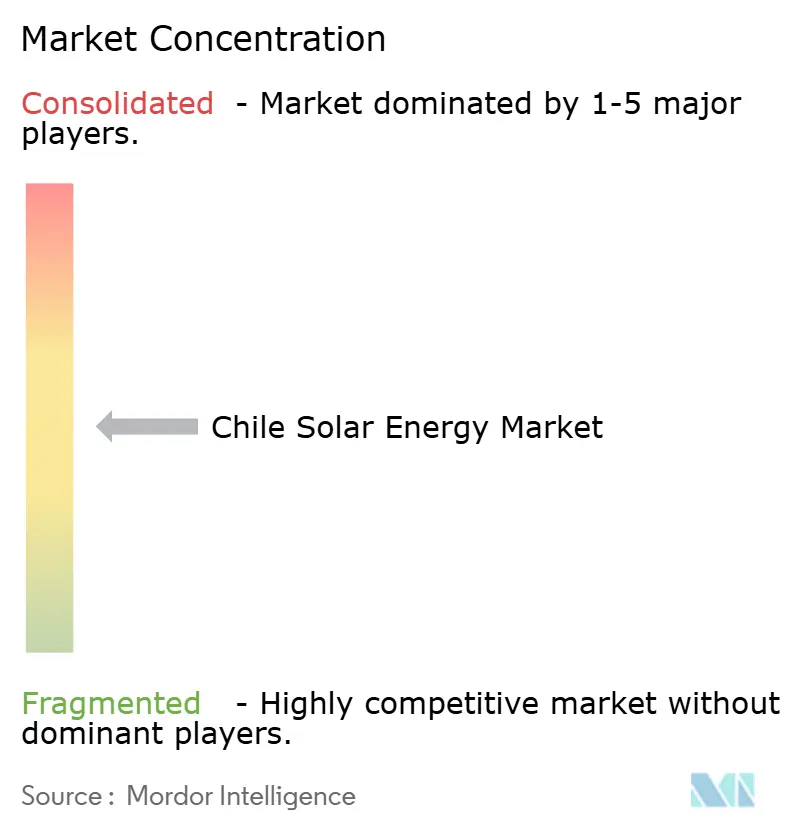
| Market Concentration | Medium |
Major Players *Disclaimer: Major Players sorted in no particular order Image © Mordor Intelligence. Reuse requires attribution under CC BY 4.0. | |
Chile Solar Energy Market Analysis by Mordor Intelligence
Chile Solar Energy Market size in 2026 is estimated at 19.75 gigawatt, growing from 2025 value of 16.5 gigawatt with 2031 projections showing 48.49 gigawatt, growing at 19.68% CAGR over 2026-2031.
The expansion is propelled by record solar irradiance in the Atacama Desert, falling module and balance-of-system prices, long-tenor corporate PPAs signed by copper and lithium miners, and a policy framework that rewards hybrid solar-plus-storage projects with capacity payments.[1]Isla Binnie, “Chile Courts Hybrid Solar Projects as Auction Rules Evolve,” reuters.com Developers installed more than 2 GW of battery storage by December 2024, pre-empting transmission bottlenecks and improving revenue certainty. Competitive pressure is intensifying as Spanish, U.S., and Chinese firms consolidate project pipelines to secure auction volumes and negotiate favorable EPC terms. Curtailment, indigenous-community land-use conflicts, and winter intermittency temper near-term growth yet have not derailed investor appetite for merchant-plus-storage configurations approved since early 2025.
Key Report Takeaways
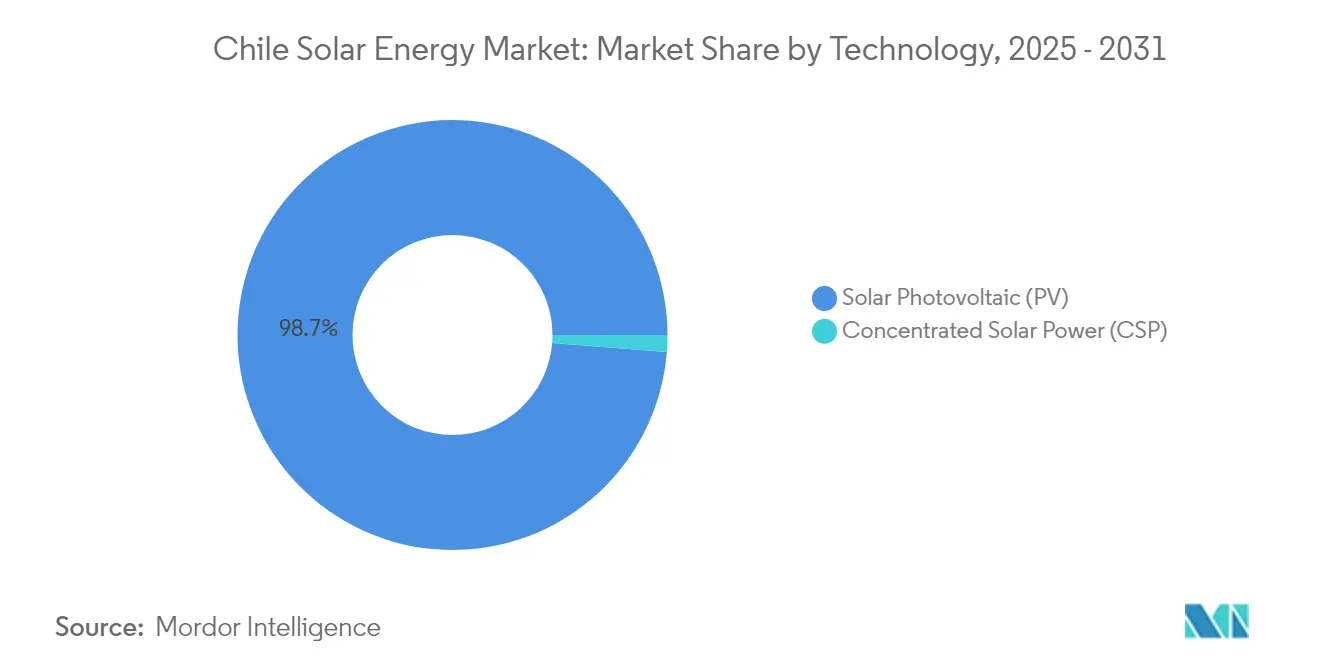
- By technology, Solar Photovoltaic led with 98.74% Chile solar energy market share in 2025, while Concentrated Solar Power is advancing at a 25.3% CAGR through 2031.
- By grid type, on-grid projects held 95.20% of the Chile solar energy market size in 2025, while off-grid installations aimed at remote mining operations are growing at a 31.1% CAGR.
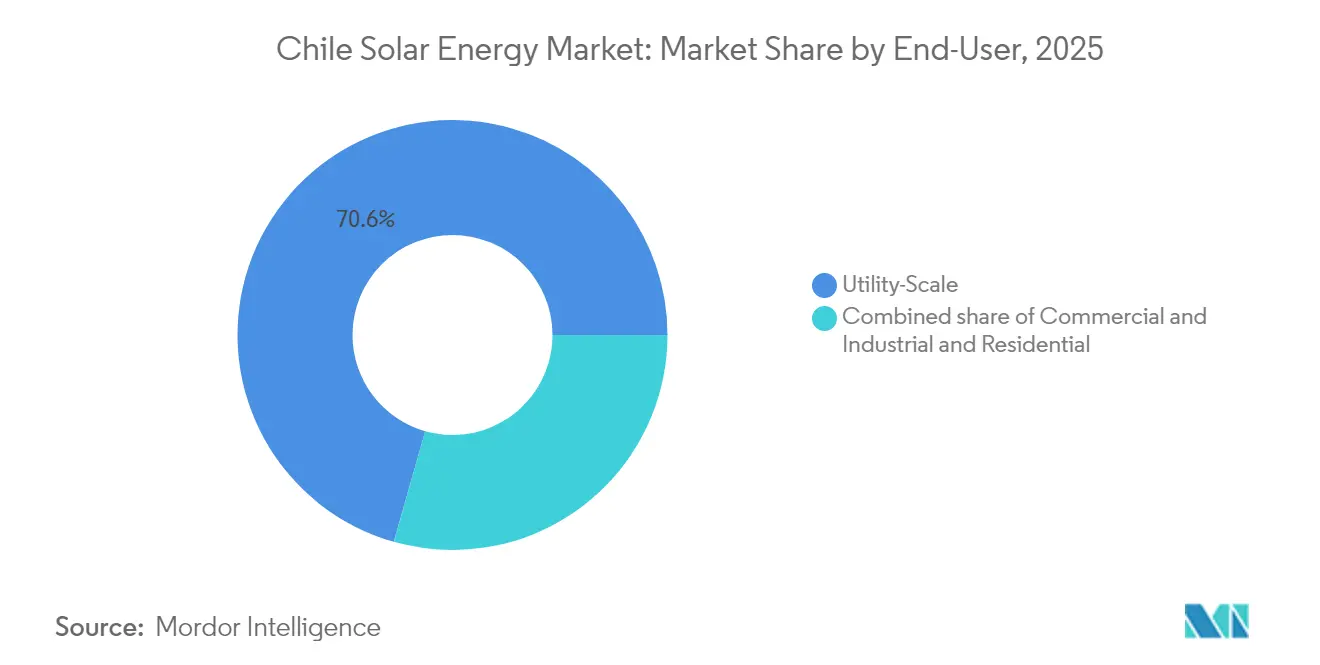
- By end user, utility-scale assets accounted for 70.60% of capacity in 2025; the residential segment is forecast to expand at a 23.8% CAGR through 2031.
Note: Market size and forecast figures in this report are generated using Mordor Intelligence’s proprietary estimation framework, updated with the latest available data and insights as of 2026.
Chile Solar Energy Market Trends and Insights
Drivers Impact Analysis*
| Driver | (~) % Impact on CAGR Forecast | Geographic Relevance | Impact Timeline |
|---|---|---|---|
| Government-backed technology-neutral auctions | 3.20% | National, early gains in Antofagasta, Atacama, Tarapacá | Medium term (2-4 years) |
| Declining PV module and balance-of-system costs | 4.10% | National, fast adoption in Metropolitan and Valparaíso | Short term (≤ 2 years) |
| Highest solar irradiance in Atacama Desert | 2.80% | Atacama, Antofagasta, Tarapacá | Long term (≥ 4 years) |
| Mining-sector corporate PPAs | 3.50% | Antofagasta, Atacama, Salar de Atacama | Medium term (2-4 years) |
| Build-out of Kimal–Lo Aguirre HVDC backbone | 2.90% | National, connecting María Elena to Santiago | Long term (≥ 4 years) |
| Hybrid solar + storage securing capacity payments | 3.70% | National, concentrated in northern regions | Medium term (2-4 years) |
| Source: Mordor Intelligence | |||
Government-Backed Technology-Neutral Auctions
Chile’s updated 2025-2028 auction calendar allocates 11.6 GWh of storage across six zones and replaces technology mandates with firm-capacity requirements.[2]Staff Reporter, “Chile Sets 11.6 GWh Storage Target in 2025-2028 Auctions,” energystoragenews.com The structure prompts developers to submit hybrid solar-plus-battery bids that qualify for additional capacity revenue worth USD 8-12 per MWh, boosting internal rates of return despite falling daytime prices. Grenergy’s April 2025 reverse auction, which offered 1.7 TWh annually from its Oasis de Atacama complex, illustrates how pre-sold hybrid output can secure investment-grade ratings before financial close. Bid spreads have narrowed from USD 20 per MWh in 2019 to roughly USD 5 per MWh by early 2025, forcing marginal players to pursue joint ventures or exit the market.
Declining PV Module and Balance-of-System Costs
Spot module prices collapsed to USD 0.08-0.10 per W in 2024 as global manufacturing overcapacity triggered losses at leading Chinese suppliers such as JinkoSolar, Longi, Trina, and JA Solar. Chilean developers locked in 24- to 36-month supply contracts, capping capital costs for large projects at USD 600-750 per kW. Parallel declines in inverters, trackers, and mounting structures, single-axis tracker prices fell about 15% year-on-year, lowering utility-scale levelized costs below USD 25 per MWh for projects with capacity factors above 30%. Such cost advantages have intensified midday oversupply, accelerating developer interest in four-to-six-hour storage to capture evening price spikes.
Highest Global Solar Irradiance in Atacama Desert
Direct normal irradiance above 2,500 kWh /m²/y delivers PV capacity factors near 38% with single-axis tracking, about 10 points higher than comparable U.S. deserts.[3]Staff Reporter, “Atacama Irradiance Data,” sciencedirect.com Clustering utility plants within 200 km of Antofagasta and Mejillones ports shortens haulage distance to metal smelters consuming more than 18 TWh annually.[4]Chile Coordinador Eléctrico Nacional, “Electricity Demand and Generation Statistics 2024,” cen.cl Operators leverage robotic cleaners such as Sunpure units deployed at Enel’s 480 MW CEME1 site, reducing water use by 90% and raising output by 4%. High irradiance also magnifies curtailment when peak output exceeds the 1,800 MW rating of legacy 500 kV lines, compelling developers to add battery buffers until the HVDC backbone is energized.
Mining-Sector Corporate PPAs (Copper / Lithium)
Codelco contracted 1,825 GWh of renewable supply in 2024, including a 1,100 GWh deal with Colbún, locking in tariffs for 15-20 years. Such revenue certainty supports non-recourse loans at spreads near 200-250 basis points over sovereign debt, roughly 150 basis points cheaper than merchant terms. Lithium producers SQM and Albemarle are following with 24/7 supply tenders for brine evaporation plants that consume 50-60 MWh per metric ton of lithium carbonate equivalent. Developers oversize generation by about 10-15% and incorporate redundant inverters to avoid penalty clauses for under-delivery, raising project capex but de-risking cash flow.
Restraints Impact Analysis*
| Restraint | (~) % Impact on CAGR Forecast | Geographic Relevance | Impact Timeline |
|---|---|---|---|
| Transmission congestion and curtailment risk | -2.40% | Antofagasta, Atacama, Tarapacá | Short term (≤ 2 years) |
| Weather intermittency in winter months | -1.10% | National, stronger in Biobío, Los Lagos | Medium term (2-4 years) |
| Indigenous-community land-use conflicts | -1.80% | Norte Grande | Medium term (2-4 years) |
| Negative pricing eroding merchant revenue | -2.20% | Northern grid | Short term (≤ 2 years) |
| Source: Mordor Intelligence | |||
Transmission Congestion and Curtailment Risk
Curtailment climbed to 6 TWh in 2024, triple the 2022 level, because generation is concentrated in the north while 60% of demand lies in central Chile. The system operator issued curtailment notices on 142 days, forcing some plants to forgo up to 25% of potential spring output. Co-location of batteries mitigates the loss but adds USD 150-200 per kWh of capex and lengthens payback by almost two years.
Weather Intermittency in Winter Months
Capacity factors in central and southern regions sink to 18-22% during June and July due to cloud cover and shorter days. Utilities maintain gas or hydro reserves that impose fixed charges shared across all generators, trimming solar-only project revenue 8-12% on an annualized basis. Four-hour batteries can time-shift summer surplus into winter evenings if inter-season spreads stay above USD 25 per MWh, a threshold still met in 2024.
*Our forecasts treat driver/restraint impacts as directional, not additive. The impact forecasts reflect baseline growth, mix effects, and variable interactions.
Segment Analysis
By Technology: Dispatchability Premium Lifts CSP Prospects
Solar Photovoltaic dominated with 98.74% of capacity in 2025, delivering build costs near USD 600-750 per kW and reinforcing the scale of the Chile solar energy market. Cerro Dominador’s 110 MW CSP tower illustrated the revenue upside of dispatchable evening generation when spot prices reach USD 50-70 per MWh, a premium that underpins the 25.3% CAGR forecast for CSP from 2025 to 2031. Photovoltaic performance continues to rise thanks to bifacial modules and single-axis trackers that push capacity factors past 35% in the Atacama Desert. Enel’s Don Humberto plant, commissioned in December 2024, showed an 8-10% generation gain from bifacial technology, underscoring incremental efficiency plays available to PV operators.
The Chile solar energy market size for CSP is still modest, yet molten-salt storage with 17-hour discharge duration positions CSP to meet evening demand when batteries reach state-of-charge limits. Technical challenges persist after Cerro Dominador’s 2023 molten-salt leak, but new tower and trough designs with composite tank liners are expected to cut downtime. PV suppliers, meanwhile, refine predictive maintenance; Suncast’s machine-learning algorithms manage 4.9 GW of renewable assets and reduce forced-outage risk for utility fleets. Such digital tools keep lifetime operating costs below USD 10 per MWh, safeguarding competitiveness against other dispatchable technologies like gas peakers or pumped hydro.


By Grid Type: Mining Autonomy Drives Off-Grid Uptake
On-grid assets represented 95.20% of the Chile solar energy market share in 2025, but off-grid installations supply remote copper and lithium operations where line extensions exceed USD 2 million per kilometer. Off-grid capacity is forecast to grow 31.1% CAGR to 2031, anchoring PPA terms that displace diesel and reduce mine carbon footprints 60-70%. A typical 5 MW solar array paired with a 10 MWh battery cuts 3 million liters of diesel annually, achieving sub-five-year payback at 2024 fuel prices.
The Chile solar energy market size for on-grid projects will still expand as miners and distributors sign 15-year PPAs to lock in delivered prices near USD 30 per MWh, far below retail tariffs in Santiago that sit at USD 120-140 per MWh. Yet congested transmission corridors north of María Elena cap uncontracted merchant upside and persuade developers to add batteries or locate projects south of Maitencillo substation, where curtailment is lower. Distributed generation remains small, 290 MW by November 2024, but could accelerate if net-metering reforms raise system-size caps above 300 kW and allow 12-month credit banking.
By End User: Residential Momentum within Utility-Scale Dominance
Utility plants held 70.60% of installed capacity in 2025 and remain the financial backbone of the Chile solar energy market, tapping global lenders at investment-grade spreads and exploiting economies of scale that push capex under USD 700 per kW. Commercial-and-industrial rooftop systems hedge expensive retail tariffs yet face higher capital costs and limited green-loan availability for small enterprises.
Residential arrays are the fastest-growing end-user niche, with a 23.8% CAGR through 2031, yet their share of the Chile solar energy market size remains modest. Typical 6 kW systems in Santiago recover investment within nine years at retail rates of USD 150-180 per MWh, but penetration is concentrated in high-income districts able to secure mortgage add-ons or low-interest credit. Proposed net-metering changes that would credit excess power at 70% of tariff value have slowed installer pipelines since late-2024 while regulators review stakeholder feedback.
Geography Analysis
Northern Chile hosts about 84.60% of solar capacity thanks to Atacama irradiance that exceeds 2,500 kWh /m²/y, yielding PV capacity factors above 34% with tracking. The region also experiences the bulk of the 6 TWh curtailment recorded in 2024 because peak generation outstrips the 500 kV network built for 1,800 MW north-to-south transfer. Batteries added since 2024 soak up surplus and re-inject power during evening peaks, cushioning revenue until the Kimal–Lo Aguirre HVDC line enters service in 2029. Central zones, Metropolitan, Valparaíso, and O’Higgins, collect roughly 10.30% of capacity yet expand at nearly 26.9% CAGR as distributed generation gains traction. Capacity factors in these regions are lower, around 24%, but high retail tariffs produce payback within eight years for quality rooftop sites. The government aims for 500 MW of distributed generation by March 2026, mainly in populous central provinces where demand density supports grid upgrades and installers have mature supply chains.
Southern regions such as Biobío and Los Lagos remain marginal due to winter cloudiness and 18-22% capacity factors. Hybrid solar-wind-hydro schemes are emerging to smooth seasonal production and capitalize on capacity payments awarded during winter evenings when solar output falls below 5% of nameplate. Indigenous consultation protocols in the Norte Grande add 12-18 months to northern project timelines, prompting some sponsors to diversify into central Chile despite lower irradiance but faster permitting.
Regulatory Landscape
Chile's solar market operates under a multi-institution power framework where the Ministry of Energy sets sector policy, the Comision Nacional de Energia (CNE) administers planning and regulated tariff and tender processes, the Superintendencia de Electricidad y Combustibles (SEC) enforces technical and safety compliance, and the Coordinador Electrico Nacional (CEN) manages dispatch and real-time operation of the National Electric System (SEN). In June 2026, Supreme Decree No. 32 (DS32) amended grid coordination and operation rules under DS125, directly affecting how energy storage is integrated into dispatch and operational coordination, a key consideration for solar-heavy zones facing congestion and curtailment.
Distributed and mid-scale solar participation is also being reshaped by storage-aware regulation. In June 2026, Supreme Decree No. 1 amended the PMGD framework (DS88) to incorporate storage and redesign elements of the stabilized pricing mechanism, expanding operational configurations available to PMGD solar assets that add batteries. Complementing these changes, legislative action in January 2026 advanced measures for medium-sized energy systems in southern regions (Los Lagos, Aysen, and Magallanes), supporting wider adoption of non-conventional renewable energy where grid conditions and demand profiles differ from the Norte Grande.
Competitive Landscape
The top five developers, AES Andes, Enel Green Power, Engie Energía Chile, Grenergy Renovables, and Atlas Renewable Energy, control roughly 45-50% of installed capacity, indicating a moderate-concentration profile for the Chile solar energy market. ContourGlobal’s USD 900 million purchase of a 451 MWp solar-plus-storage portfolio in December 2024 and Grenergy’s USD 128 million acquisition of 1 GW from Repsol in September 2024 highlight consolidation among mid-tier firms seeking scale.
Strategic pivots favor hybrid designs: Atlas Renewable Energy’s Estepa complex pairs 215 MW solar with a 418 MW, four-hour battery financed in April 2025, while Grenergy’s Oasis de Atacama expansion brings total storage to 11 GWh NSENERGYBUSINESS.COM. Technology differentiation is also visible; Enel’s Don Humberto plant uses bifacial panels, and EDF Renewables plus AME installed 300 robotic cleaners at CEME1 to slash water use by 90%.
Chinese suppliers leverage vertical integration: Canadian Solar’s e-STORAGE won a 312 MWh battery EPC contract in 2024, reflecting a drive to capture downstream margin. Software has become a competitive edge; Suncast’s AI forecasting oversees almost 5 GW of renewables and reduces imbalance penalties, while EDP’s USD 2 million stake in a Santiago-based predictive-maintenance startup underscores digital value creation.
Chile Solar Energy Industry Leaders
Acciona, S.A
Enel Green Power S.p.A
Sonnedix Chile
Mainstream Renewable Power
Atlas Renewable Energy
- *Disclaimer: Major Players sorted in no particular order

Market Opportunities and Future Outlook
Hybridization remains a central whitespace in Chile's solar build-out because it addresses curtailment and negative pricing that accompany high daytime PV penetration in northern nodes. This is reflected in both project activity, with developers adding multi-hour batteries, and policy design, including the 2025-2028 technology-neutral auction calendar that allocates 11.6 GWh of storage across six zones and emphasizes firm-capacity-style requirements that favor solar-plus-storage bid structures. Utility procurement also shows the shift, as in June 2026, CNE-approved preliminary terms for a 2026/01 supply tender allowed storage systems to serve as valid backup for solar generation, encouraging configurations that can deliver closer-to-firm profiles without relying on thermal backup.
Decentralized and self-supply solar offers a concrete growth lane alongside utility-scale capacity additions. In May 2026, the Ministry of Energy published the 2026-2030 Energy Route Map, which includes a target of 65,000 new self-supply solar PV systems by 2030 across residential, industrial, and agricultural users, aligning with distributed generation expansion in central regions where demand density supports interconnection. On the utility side, permitting and approvals continue to support new solar-plus-storage pipelines, such as in March 2026, when FRV received environmental approval for the Llanos de Maranon project in Atacama (458 MWp solar with a 600 MWh, 4-hour BESS), reinforcing investment appetite for dispatchable solar supply that can shift output into evening hours.
Recent Industry Developments
- June 2026: Acciona Energia announced construction of a 196 MW/980 MWh battery energy storage system at its 246 MWp El Romero solar plant in the Atacama Desert. The retrofit scales the site into a solar-plus-storage asset designed to reduce curtailment exposure and improve revenue capture outside midday price troughs.
- April 2026: Enel Green Power Chile began construction of the 94 MW/372 MWh Azabache BESS in the Antofagasta Region as part of a hybrid configuration integrating solar, wind, and storage. The build strengthens Enel's ability to offer more dispatchable renewable supply and aligns with the market shift toward firmed renewable products demanded by large offtakers.
- December 2024: ContourGlobal acquired a 451 MWp solar-plus-storage portfolio from Grenergy for about USD 900 million, including 2.5 GWh of storage tied to long-term offtake structures. The transaction highlighted consolidation around hybrid portfolios and validated the bankability of solar assets paired with storage in Chile's high-penetration nodes.


Research Methodology Framework and Report Scope
Market Definition and Coverage
For this report, the Chile solar energy market is defined as the installed solar power capacity operating in Chile, tracked in gigawatts and forecast based on additions and retirements across the national power system.
Scope exclusions: It excludes non-solar renewables and does not count broader power market revenues that are not directly tied to installed solar capacity.
Segmentation Overview
- By Technology
- Solar Photovoltaic (PV)
- Concentrated Solar Power (CSP)
- By Grid Type
- On-Grid
- Off-Grid
- By End-User
- Utility-Scale
- Commercial and Industrial (C&I)
- Residential
- By Component (Qualitative Analysis)
- Solar Modules/Panels
- Inverters (String, Central, Micro)
- Mounting and Tracking Systems
- Balance-of-System and Electricals
- Energy Storage and Hybrid Integration
Data Sources, Market Sizing, and Validation
Desk Research
Desk research set up the capacity timeline and the policy context that explains why projects move from pipeline to commissioning in Chile. We mainly relied on public energy and grid publications, such as Chile energy statistics, system operator disclosures on connected assets, and regulator and ministry updates on permitting and auctions.
To keep the model practical, we also reviewed sources such as international energy agency datasets, renewable energy association releases, customs and trade statistics for solar equipment, and peer-reviewed articles on Chile irradiance and performance ratios. Company filings, investor presentations, and reputable press were used to cross-check commissioning dates and ownership changes, while paid subscription coverage for company financials and another covering shipment-level trade flows were used selectively for clarification. The sources listed here are illustrative only, and many other public documents and datasets were also used for collection, validation, and follow-up clarification.
Primary Interviews and Surveys
Primary work was used to pressure test the pipeline, expected commissioning slippage, and typical build timelines across utility-scale and behind-the-meter projects in Chile. We spoke with developers, EPC and O&M participants, equipment distributors, grid-related stakeholders, and large power buyers to validate assumptions that are not consistently visible in public sources.
Because this is a single-country market, the outreach was balanced across key operating areas inside Chile and across different project sizes, then the inputs were reconciled back to the same installed-capacity definition used in the model.
Distribution of primary research fieldwork respondents
| Company type | Respondent position | Region |
|---|---|---|
| Top tier: 31% | CXOs: 15% | |
| Mid tier: 48% | Functional/Unit leaders: 28% | |
| Smaller Players: 21% | Managers: 57% |
Market-Sizing & Forecasting
Market sizing was built using a top-down and bottom-up blend, where national installed-capacity series, grid connection records, and project commissioning schedules are used to reconstruct the solar base and yearly additions in Chile. Results were then corroborated with selective bottom-up approximations, such as sampling project-level capacity additions by technology type, and checking implied build rates against execution capacity and timelines shared in interviews.
A few key inputs that shaped the model were the published installed base in GW, the utility-scale project pipeline and expected commissioning dates, curtailment and grid congestion signals that can delay final synchronization, and policy and auction milestones that affect new awards. When a project lacked clear public timing, a conservative schedule was applied based on peer projects of similar size and location, and then validated through primary feedback so the annual additions did not look overstated.
Forecasting relied on scenario analysis layered with exponential smoothing on historical additions, where the scenarios mainly reflect different grid availability and permitting pace outcomes in Chile. Final growth paths were accepted only after the implied annual additions and the resulting 2031 capacity level stayed consistent with developer expectations and publicly visible connection constraints.
Data Validation & Update Cycle
Checks were run at multiple steps so the installed base, annual additions, and implied growth rates did not contradict each other for Chile. Outputs were compared against independent signals like published capacity totals, connection announcements, award activity, and observed delays discussed in interviews, and any large variance triggered a deeper review of project status and timing.
Before sign-off, the model and assumptions go through an internal analyst review, and outliers are re-validated through follow-up outreach when needed. Reports are refreshed annually, and if a material event occurs, such as a policy change or a visible shift in curtailment, an interim adjustment is incorporated and then a final pre-delivery pass is completed so clients receive the latest view.
Mordor Intelligence's Chile Solar Energy Market Size Measured Against Other Published Estimates
Published market sizes for Chile solar can look far apart because different studies use different units, time bases, and definitions of what is being counted in the installed-base market. Some sources express the market in installed capacity, while others convert solar activity into USD values, which makes the figures look comparable even when the underlying build logic is not.
In Mordor Intelligence's model, the market is sized in installed capacity (GW) for operating and commissioned solar assets in Chile, rather than being expressed as equipment procurement spending or total renewable market value in USD.
Benchmark comparison
| Source | Market Size | Gaps in Research Methodology |
|---|---|---|
| Mordor Intelligence | USD 16.50 B (2025) | |
| Global Consultancy A | USD 2.80 B (2026) | This figure is stated as a USD value for solar PV market activity, which can behave like annual investment or procurement spend, so it will not align with a capacity-based total even if the same projects are referenced. |
| Industry Research Group B | USD 7.83 B (2024) | This estimate is for the wider renewable energy market and blends multiple technologies, and it also depends heavily on value assumptions such as pricing and revenue treatment, which can pull the USD total away from a solar-only installed capacity view. |
Taken together, the gaps are mainly explained by unit choice and scope, and then amplified by the reporting year and the way USD values are constructed. By tying forecasts back to visible capacity additions, commissioning status, and delay checks, the sizing logic stays traceable to repeatable steps and easy to update when new plants come online.


Key Questions Answered in the Report
What is the current installed capacity of the Chile solar energy market?
The market had 19.75 GW of installed solar capacity in 2026 and is projected to reach 48.49 GW by 2031.
How fast is capacity expected to grow?
The compound annual growth rate is forecast at 19.68% from 2026 to 2031.
Which segment will expand the quickest?
Off-grid projects serving mining sites are forecast to grow 31.1% CAGR through 2031.
What drives investment in hybrid solar-plus-storage projects?
Capacity payments, reduced curtailment, and the need for dispatchable evening power motivate developers to pair PV with four- to six-hour batteries.
How much curtailment occurred in 2024?
Curtailment reached 6 TWh in 2024, equal to roughly 20% of non-conventional renewable output in Chile.
When will the Kimal–Lo Aguirre HVDC line be completed?
The 3,000 MW HVDC backbone is slated for commissioning in 2029, pending final environmental approvals and community consultations.
Page last updated on:


