Chile Data Center Cooling Market Size and Share
Market Overview
| Study Period | 2020 - 2031 |
|---|---|
| Forecast Data Period | 2026 - 2031 |
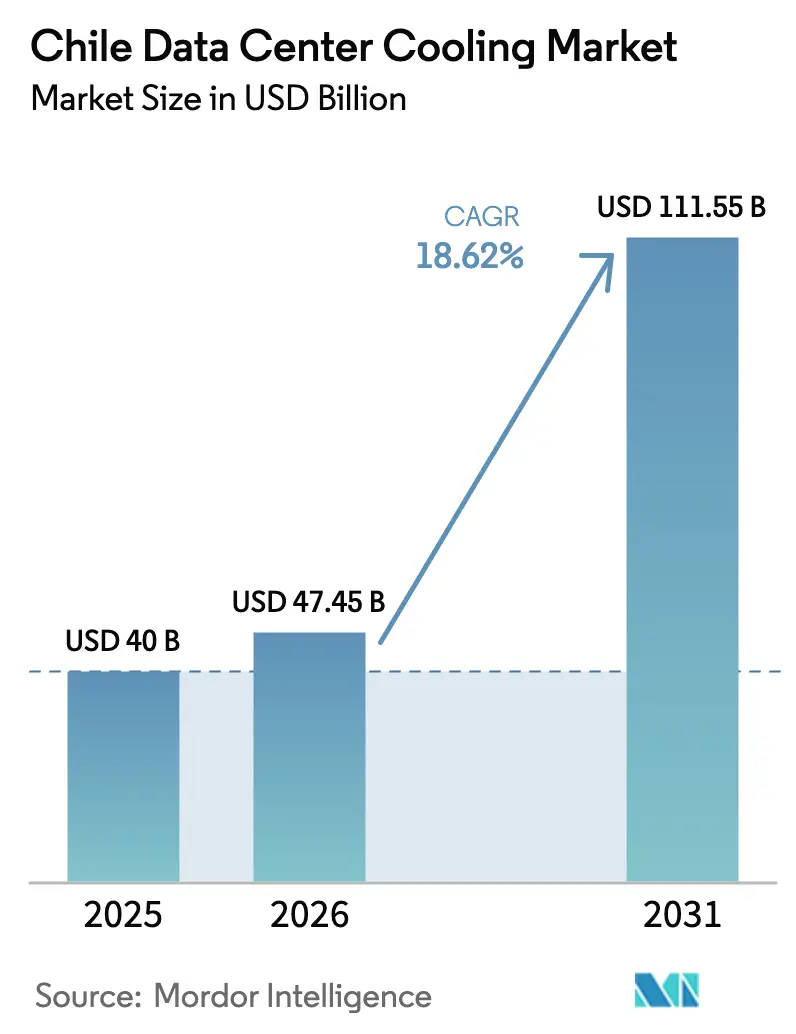
| Base Year Market Size (2025) | USD 40 Billion |
| Market Size (2026) | USD 47.45 Billion |
| Market Size (2031) | USD 111.55 Billion |
| Growth Rate (2026 - 2031) | 18.62% CAGR |
| Market Concentration | Medium |
Major Players
*Disclaimer: Major Players sorted in no particular order Image © Mordor Intelligence. Reuse requires attribution under CC BY 4.0. |
|
Chile Data Center Cooling Market Analysis by Mordor Intelligence
The Chile data center cooling market size was valued at USD 40 million in 2025 and estimated to grow from USD 47.45 million in 2026 to reach USD 111.55 million by 2031, at a CAGR of 18.62% during the forecast period (2026-2031). Robust cloud and AI investments, led by Amazon’s USD 4 billion infrastructure pledge, underpin this expansion. Liquid-cooling adoption is accelerating as rack densities climb toward 40–60 kW, yet air-based systems still dominate day-to-day operations. Government incentives for 100% renewable electricity and tax breaks in Santiago further stimulate demand for efficient thermal management, while tightening water-use rules push operators to closed-loop or waterless cooling designs. Consolidation among suppliers-exemplified by Schneider Electric’s USD 850 million Motivair purchase-highlights a race to secure liquid-cooling capability
Key Report Takeaways
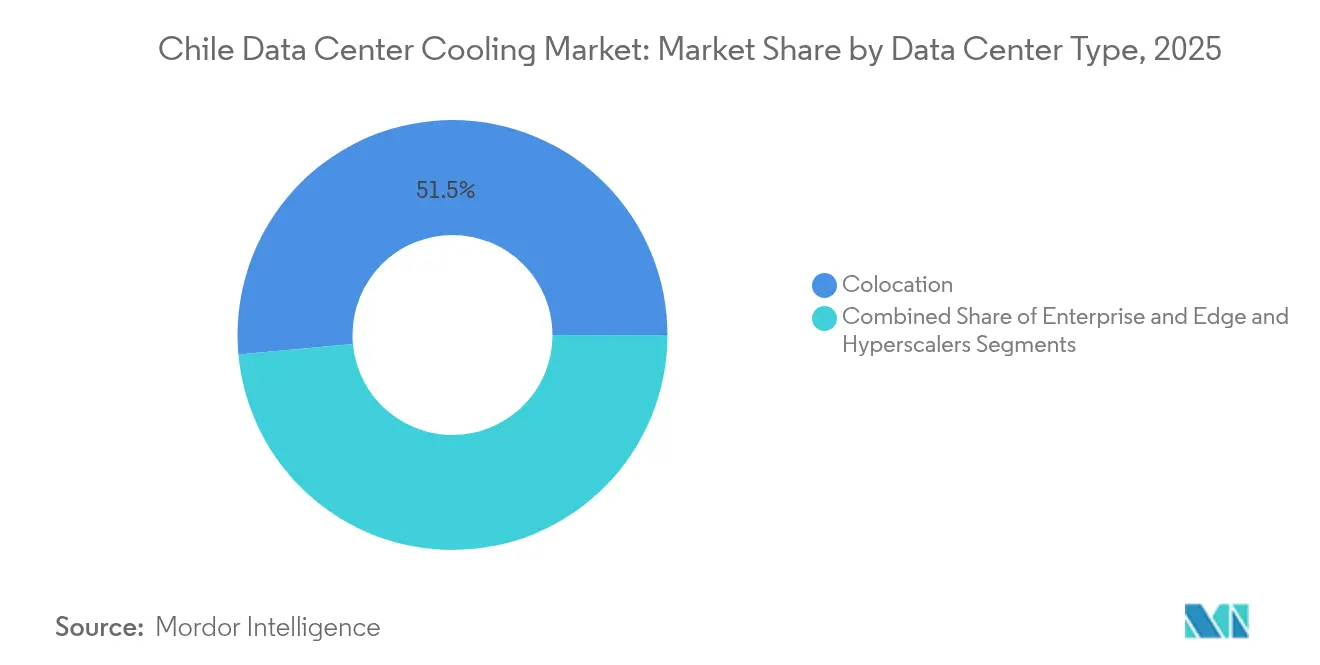
- By data center type, colocation facilities held 51.45% revenue share in 2025; hyperscalers are projecting the fastest 21.95% CAGR through 2031.
- By tier, Tier 3 sites accounted for 62.55% of the Chile data center cooling market share in 2025, whereas Tier 4 deployments are expanding at 22.8% CAGR to 2031.
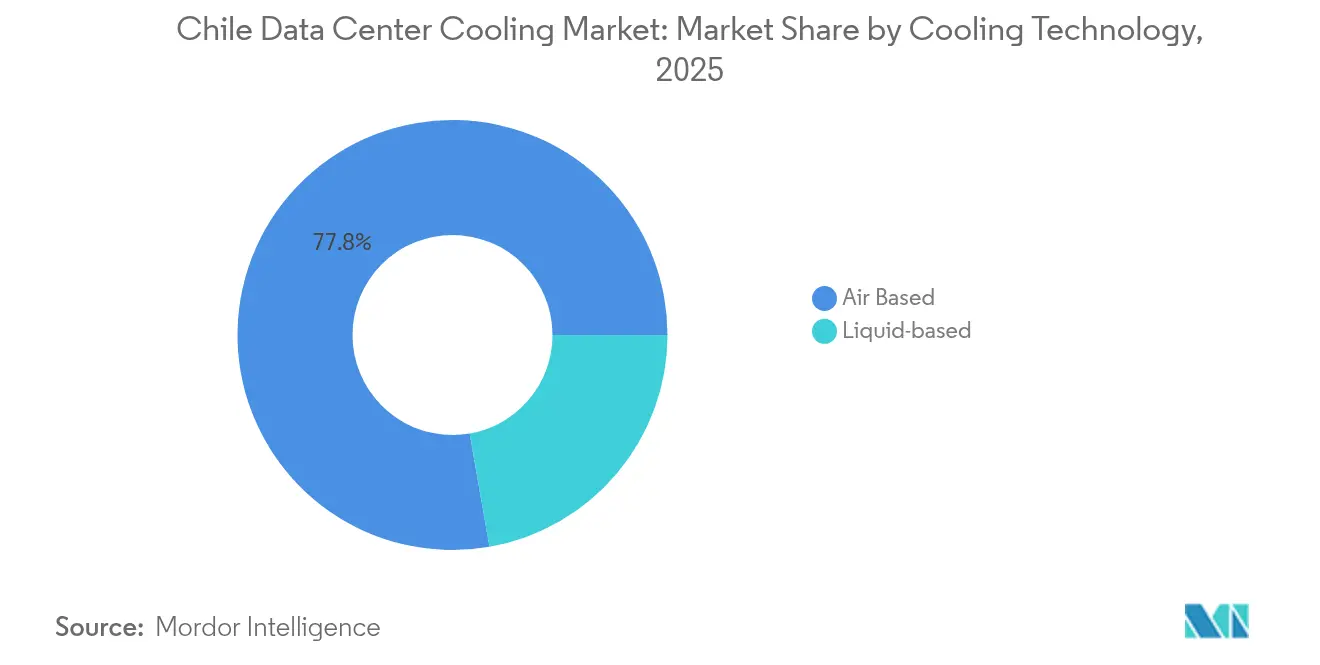
- By cooling technology, air-based systems led with 77.75% share in 2025; liquid-cooling platforms are advancing at a 23.96% CAGR.
- By component, equipment purchases represented 84.6% of the Chile data center cooling market size in 2025; services are rising at 24.54% CAGR through 2031.
Note: Market size and forecast figures in this report are generated using Mordor Intelligence’s proprietary estimation framework, updated with the latest available data and insights as of 2026.
Chile Data Center Cooling Market Trends and Insights
Drivers Impact Analysis*
| Driver | (~) % Impact on CAGR Forecast | Geographic Relevance | Impact Timeline |
|---|---|---|---|
| Cloud and AI-led rack power densification | 4.2% | National, with concentration in Santiago Metropolitan Region | Medium term (2-4 years) |
| Government "Chile Digital 2025" fibre and 5G roll-out | 3.1% | National, with early gains in Santiago, Valparaíso, Concepción | Long term (≥ 4 years) |
| National Data-Centre Plan's 100% RE power-purchase incentives | 2.8% | National, with emphasis on northern solar regions | Long term (≥ 4 years) |
| Colocation tax incentives in Santiago Metropolitan Region | 2.3% | Santiago Metropolitan Region | Short term (≤ 2 years) |
| Andes-cooled water-side economiser retrofits in Tier-II DCs | 1.9% | Central Chile, mountain-adjacent facilities | Medium term (2-4 years) |
| Copper-mining firms' waste-heat-for-process-water barter deals | 1.4% | Northern Chile mining regions | Long term (≥ 4 years) |
| Source: Mordor Intelligence | |||
Cloud and AI-led Rack Power Densification
Rack densities in Chilean facilities have doubled from 6 kW to 12 kW, and AI clusters now exceed 40 kW per rack, pushing liquid-cooling uptake.[1]Schneider Electric — "Schneider Electric buys Motivair for liquid-cooling push," Reuters, reuters.com New reference designs support up to 132 kW per rack, creating demand for immersion and hybrid cooling units. Operators are consolidating footprints to justify these capital-intensive systems, positioning the Chile data center cooling market for sustained high-density growth. Liquid-cooling vendors benefit from urgent retrofits as air solutions hit thermal limits, while on-premise enterprises increasingly migrate to colocations offering AI-ready racks.
“Chile Digital 2025” Fibre and 5G Roll-out
Nationwide fibre backbones and 5G coverage open underserved areas to edge computing, each requiring modular cooling that tolerates variable loads.[2]UNCTAD — "Investment Policy Review: Chile Digital 2025," investmentpolicy.unctad.org Valparaíso and Concepción are emerging edge nodes, creating pockets of demand for compact, remote-monitored cooling systems. New latency-sensitive applications, from autonomous mining vehicles to content streaming, magnify cooling needs close to end users. Connectivity also enables IoT-driven thermal controls, trimming energy costs while improving uptime.
National Data-Centre Plan’s 100% Renewable-Energy Incentives
Chile’s renewable mandate aligns with hyperscaler sustainability targets, with Microsoft aiming for 100% renewable electricity by 2025.[3]White & Case — "Microsoft commits to 100% renewable energy in Chile by 2025," whitecase.com Solar and wind surpluses in Atacama allow operators to time-shift cooling loads using thermal storage, reducing peak tariffs. Liquid-cooling’s higher power draw becomes acceptable when sourced from abundant clean energy. Facilities deploying advanced storage charge chillers during daytime solar peaks, enhancing grid stability and lowering carbon intensity.
Colocation Tax Incentives in Santiago
Reduced duties on new builds accelerate construction of multi-tenant facilities, where shared capital allows high-spec cooling deployments. Equinix’s USD 130 million Santiago campus showcases chilled-water and rear-door liquid array options that enterprise clients could not cost-justify alone. The clustering effect draws specialised technicians and service suppliers, reinforcing Santiago’s leadership within the Chile data center cooling market.
Restraints Impact Analysis*
| Restraint | (~) % Impact on CAGR Forecast | Geographic Relevance | Impact Timeline |
|---|---|---|---|
| Tightened water-withdrawal quotas (Supreme Decree MMA-90/2024) | -2.8% | National, with severe impact in Santiago and northern regions | Short term (≤ 2 years) |
| Volatile peso increased imported HVAC CAPEX | -2.1% | National, affecting all import-dependent cooling equipment | Short term (≤ 2 years) |
| Scarcity of liquid-cooling-ready field technicians | -1.7% | National, with acute shortage in specialized liquid cooling skills | Medium term (2-4 years) |
| Community opposition to diesel back-up >30 m³ storage sites | -1.3% | Urban areas, particularly Santiago Metropolitan Region | Medium term (2-4 years) |
| Source: Mordor Intelligence | |||
Tightened Water-Withdrawal Quotas (MMA-90/2024)
Google’s Cerrillos project suspension exposed the risk of exceeding 169 l/s water limits, forcing operators toward dry coolers and closed-loop liquid systems. Small facilities once consuming 25 million L annually now face stricter permits and community scrutiny. Waterless immersion systems gain traction, though higher inlet temperatures raise energy consumption. Providers differentiate via atmospheric water generation and onsite recycling to meet cooling demand without breaching quotas.
Volatile Peso and Imported HVAC CAPEX
Currency swings inflate prices of chillers, pumps and heat exchangers sourced in USD or EUR, raising payback hurdles for upgrades. Operators delay non-essential replacements, stressing aging air units and lifting maintenance outlays. Vendors respond with peso-denominated service contracts and localized assembly lines to hedge forex risk, yet liquid-cooling adoption still depends on stable financing terms.
*Our forecasts treat driver/restraint impacts as directional, not additive. The impact forecasts reflect baseline growth, mix effects, and variable interactions.
Segment Analysis
By Data Center Type: Hyperscalers Drive Liquid Cooling Adoption
Colocation sites commanded 51.45% of the Chile data center cooling market share in 2025, but hyperscalers are pacing a 21.95% CAGR through 2031. The Chile data center cooling market size for hyperscalers is projected to double as Amazon builds three availability zones in Santiago, each pre-designed for liquid-cooling loops supporting AI accelerators. Colocation operators, meanwhile, retrofit aisles with in-rack coolant distribution to win enterprise AI workloads.Hyperscaler standards spill over to other formats. Enterprise IT managers shift from in-house rooms to shared halls offering 40 kW racks under 1.2 PUE. Edge micro-sites in mining regions adopt compact rear-door exchangers paired with free‐air economizers to balance space, cost and water constraints.


By Tier Type: Tier 4 Expansion Reflects AI Reliability Requirements
Tier 3 facilities accounted for 62.55% of 2025 revenue, yet Tier 4 builds will accelerate at 22.8% CAGR as AI models demand zero downtime. The Chile data center cooling market size allocated to Tier 4 footprints is poised to reach USD 32.6 million by 2031. Operators deploy N+1 liquid loops alongside redundant air handlers, ensuring workloads stay online during component change-outs.
Tier 1–2 edge sites keep costs low with modular in-row coolers but plan upgrade paths to higher tiers. Predictive maintenance platforms using machine-learning flag valve or pump anomalies before failures, meeting stringent service-level objectives for financial and gaming clients.
By Cooling Technology: Liquid Systems Gain Traction Despite Air Dominance
Air solutions retained 77.75% revenue share in 2025 as Chile’s mild coastal climate favors economizers. Yet liquid technologies are advancing at 23.96% CAGR, taking the Chile data center cooling market size for immersion and direct-to-chip systems to USD 33.2 million by 2031. Immersion baths trim energy use up to 70% and operate efficiently during warm summers.
Hybrid builds pair CRAH rows for mixed workloads with rear-door exchangers on AI racks, easing transition risks. Operators also explore waste-heat capture from warm coolant to pre-heat copper-mine process water, aligning with corporate ESG goals.
By Component: Services Growth Reflects Cooling Complexity
Equipment purchases accounted for 84.6% of 2025 revenue, while services, including consulting, deployment, and maintenance, expanded at a rate of 24.54% annually. The Chile data center cooling market share for services is expected to rise as operators outsource the design of leak-free dielectric loops and compliance audits. Consulting engagements surge when new water regulations or renewable energy mandates are introduced.Vendors bundle remote monitoring with long-term service plans, leveraging IoT sensors to optimize valve positions, coolant flow, and fan speeds. Training programs certify local technicians on dielectric safety, easing the skills bottleneck noted by 58% of global operators.
Geography Analysis
Santiago Metropolitan Region captures the bulk of demand because 68% of large enterprises sit within its boundaries and multiple submarine cables land nearby. Colocation tax breaks amplify build rates, making Santiago the proving ground for immersion baths and rear-door exchangers. AWS’s USD 4 billion commitment multiplies ecosystem spending on pumps, heat exchangers and controls, reinforcing the Chile data center cooling market leadership of the capital.
Northern Chile follows as renewable-rich Atacama solar fields let operators tap cheap, clean electricity for power-hungry liquid chillers. Mining complexes in Antofagasta collaborate with data centers to reuse reject heat for ore processing, converting environmental liabilities into economic assets. Dry air and low humidity also enable extended free-cooling windows, slashing water use when quotas tighten.
Santiago Metropolitan Region captures the bulk of demand because 68% of large enterprises sit within its boundaries and multiple submarine cables land nearby. Colocation tax breaks amplify build rates, making Santiago the proving ground for immersion baths and rear-door exchangers. AWS’s USD 4 billion commitment multiplies ecosystem spending on pumps, heat exchangers and controls, reinforcing the Chile data center cooling market leadership of the capital.Northern Chile follows as renewable-rich Atacama solar fields let operators tap cheap, clean electricity for power-hungry liquid chillers. Mining complexes in Antofagasta collaborate with data centers to reuse reject heat for ore processing, converting environmental liabilities into economic assets solarserver.de. Dry air and low humidity also enable extended free-cooling windows, slashing water use when quotas tighten.
Competitive Landscape
The Chile data center cooling market remains moderately fragmented, yet consolidation is quickening. Schneider Electric’s Motivair deal strengthens its direct-to-chip expertise, while Johnson Controls has formed a Global Data Center Solutions arm to pursue AI workloads. Vertiv broadened its range with centrifugal chillers from BiXin Energy Technology, aiming to deliver turnkey hybrid solutions.
Partnerships add speed where M&A is impractical. Munters joined with ZutaCore to bundle air handlers with waterless liquid plates, and Carrier invested in Strategic Thermal Labs for smart refrigerant management. Patent filings indicate a shift toward low-charge refrigerants and modular heat-sink chains, highlighting environmental compliance and scalability. Local installers team with multinationals to bridge the liquid-cooling talent gap, while niche firms targeting immersion baths challenge incumbents on efficiency metrics. Overall, suppliers able to integrate air, liquid, and digital-twin analytics secure the upper hand in large bids.
Chile Data Center Cooling Industry Leaders
-
Stulz GmbH
-
Vertiv Group Corp.
-
Schneider Electric SE
-
Daikin Industries, Ltd.
-
Johnson Controls International plc
- *Disclaimer: Major Players sorted in no particular order

Recent Industry Developments
- June 2025: Daikin Applied unveiled Trailblazer Heat Pump Chiller delivering up to 300% efficiency for electrified cooling.
- May 2025: AWS confirmed USD 4 billion multi-site buildout in Santiago, each center optimized for AI-ready cooling.
- April 2025: Microsoft partnered with LG Electronics to advance energy-efficient cooling in AI data centers.
- March 2025: Trane introduced Fan Coil Wall platform targeting mission-critical thermal control
- March 2025: Vertiv launched CoolLoop Trim Cooler hybrid system cutting cooling energy 70%
- February 2025: Carrier released QuantumLeap™ thermal suite and invested in ZutaCore’s direct-to-chip technology.


Research Methodology Framework and Report Scope
Market Definitions and Key Coverage
Our study defines the Chile data center cooling market as all air-based or liquid-based systems, allied controls, and field services that remove heat from servers, storage, and networking hardware installed in purpose-built or colocation data centers located within Chilean borders.
Scope exclusion: comfort HVAC for office space attached to a data center is outside the market.
Segmentation Overview
-
By Data Center Type
- Hyperscalers (owned and Leased)
- Enterprise and Edge
- Colocation
-
By Tier Type
- Tier 1 and 2
- Tier 3
- Tier 4
-
By Cooling Technology
-
Air-based Cooling
- Chiller and Economizer (DX Systems)
- CRAH
- Cooling Tower (covers direct, indirect and two-stage cooling)
- Others
-
Liquid-based Cooling
- Immersion Cooling
- Direct-to-Chip Cooling
- Rear-Door Heat Exchanger
-
Air-based Cooling
-
By Component
-
By Service
- Consulting and Training
- Installation and Deployment
- Maintenance and Support
- By Equipment
-
By Service
Detailed Research Methodology and Data Validation
Primary Research
Discussions with facility engineers, OEM distributors, design-build contractors, and utility regulators across Santiago, Valparaíso, and Antofagasta helped validate installed rack densities (rising toward 40-60 kW), price spreads for CRAH units, and probable timing of liquid-cooling skilled-labor availability.
Desk Research
We began with energy demand bulletins from Chile's Ministry of Energy, import codes 8415 and 8418 on UN Comtrade, Subtel cloud-traffic updates, and regional water-usage caps under Supreme Decree MMA-90/2024 to build a fact base. Trade associations such as ASHRAE Chile Chapter and the Latin American and Caribbean Internet Exchanges supplied adoption ratios for hot-aisle containment and liquid cooling. Our analysts complemented these public streams with D&B Hoovers company filings, Dow Jones Factiva news runs, and patent analytics from Questel on immersion manifolds. Press releases, investor decks, and construction permits of hyperscale operators provided rack additions, while tender portals like Tenders Info revealed upcoming cooling retrofits. The sources listed here are illustrative; many other public and subscription datasets informed the evidence stack.
Market-Sizing and Forecasting
A top-down demand-pool build starting with installed IT load reported by operators and cross-checking against import values was balanced with selective bottom-up supplier roll-ups of CRAH shipments to ensure consistency. Key model drivers include: average PUE trend, share of colocation white-space, peso-USD exchange trajectory, water-use quotas, and hyperscale campus pipeline. We employed multivariate regression and ARIMA overlays to forecast the forecast period, with assumptions stress-tested during expert calls and gaps bridged through benchmark ASP times volume checks where invoice data were patchy.
Data Validation and Update Cycle
Outputs pass automated variance scans, peer review, and senior analyst sign-off before release. Updates occur annually, with mid-cycle refreshes triggered by material events such as greater than 10 MW capacity announcements or regulatory shifts.
Why Mordor's Chile Data Center Cooling Baseline Commands Credibility
Published estimates often differ; scope, currency timing, and refresh cadence typically explain the gaps.
Key gap drivers here include whether services revenue is counted, if mechanical infrastructure beyond cooling is bundled, and how peso volatility is converted. Mordor reports the base year 2025 value at USD 40 million after stripping comfort HVAC and using a June 2025 FX average, whereas some peers fold broader mechanical works or older exchange rates.
Benchmark comparison
| Market Size | Anonymized source | Primary gap driver |
|---|---|---|
| USD 40 M (2025) | Mordor Intelligence | - |
| USD 50 M (2024) | Regional Consultancy A | Includes office HVAC and treats 2024 import surge as recurring |
| USD 38.5 M (2025) | Trade Journal B | Omits services revenue; relies on limited port data |
| USD 250 M (2024) | Global Consultancy C | Bundles power, chillers, and construction costs into cooling line item |
Taken together, the comparison shows that our disciplined scope selection, dual-track modeling, and yearly refresh deliver a balanced, transparent baseline that decision-makers can replicate and audit with confidence.


Key Questions Answered in the Report
What is the current value of the Chile data center cooling market?
The market size at USD 47.45 million in 2026 and is projected to reach USD 111.55 million by 2031.
Which cooling technology is growing fastest in Chilean data centers?
Liquid-cooling, including immersion and direct-to-chip solutions, is expanding at a 23.96% CAGR through 2031.
How do water-use regulations affect cooling choices?
New quotas under Supreme Decree MMA-90/2024 restrict withdrawals, pushing operators toward waterless or closed-loop systems and accelerating adoption of dry coolers and immersion baths.
Why are Tier 4 facilities becoming more prevalent?
Why are Tier 4 facilities becoming more prevalent?
Which region of Chile shows the strongest demand for data center cooling?
Santiago Metropolitan Region leads, driven by tax incentives, cloud investments and proximity to telecom infrastructure.
What impact will renewable-energy incentives have on cooling strategies?
100% renewable PPAs allow operators to offset higher power draws of liquid-cooling and encourage thermal storage systems that shift loads to peak solar hours.
Page last updated on:


