
Centrifugal Blowers Market Size and Share
Market Overview
| Study Period | 2020 - 2031 |
|---|---|
| Market Size (2026) | USD 3.21 Billion |
| Market Size (2031) | USD 3.96 Billion |
| Growth Rate (2026 - 2031) | 4.35 % |
| Fastest Growing Market | Asia-Pacific |
| Largest Market | Asia Pacific |
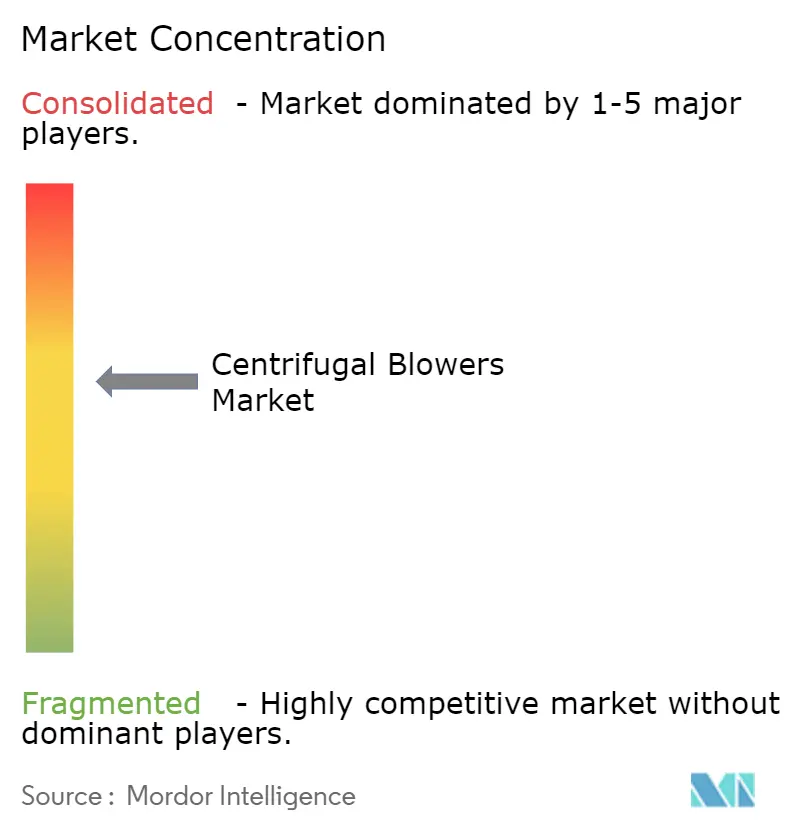
| Market Concentration | Medium |
Major Players *Disclaimer: Major Players sorted in no particular order Image © Mordor Intelligence. Reuse requires attribution under CC BY 4.0. | |
Centrifugal Blowers Market Analysis by Mordor Intelligence
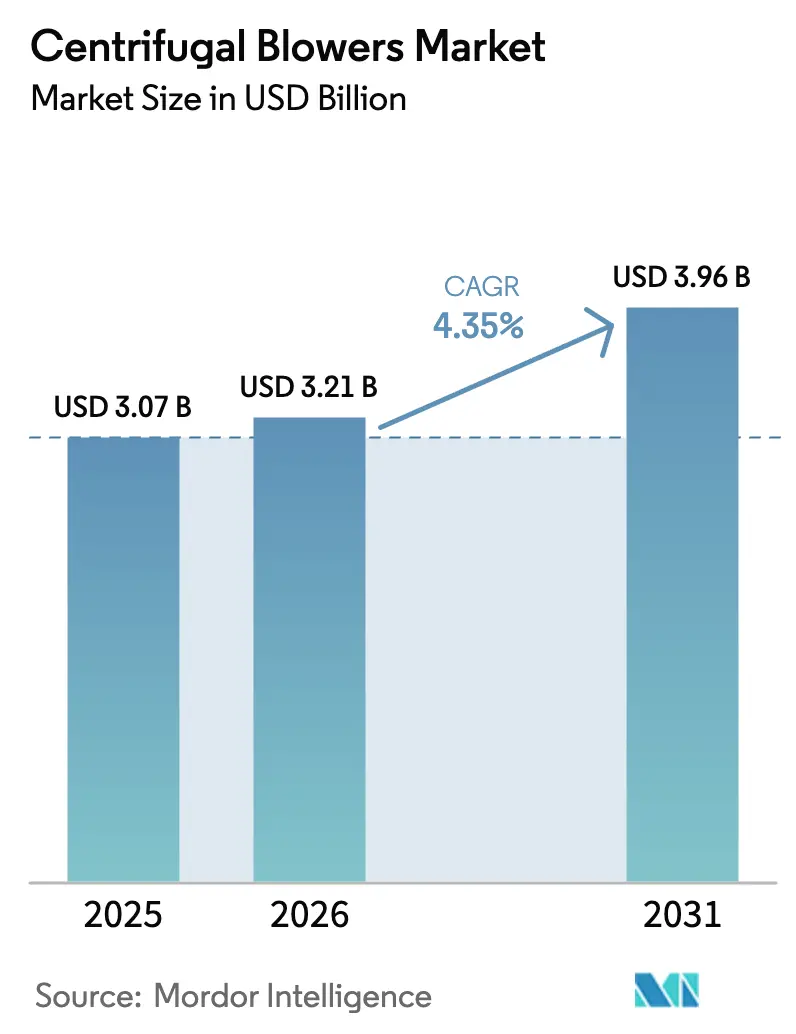
The centrifugal blowers market size in 2026 is estimated at USD 3.21 billion, growing from 2025 value of USD 3.07 billion with 2031 projections showing USD 3.96 billion, growing at 4.35% CAGR over 2026-2031. Robust spending on wastewater infrastructure, clean-energy projects and petrochemical capacity expansions keep equipment demand resilient even as end-users face stricter energy-efficiency mandates. High-pressure models capture premium orders where precise aeration, pneumatic conveying and underground ventilation are mission-critical. Technology differentiation pivots on magnetic bearings, integrated variable-speed drives and digital condition monitoring, all of which reduce lifetime operating costs and shorten payback periods. Supply-side consolidation, exemplified by the Chart Industries–Flowserve merger, is reshaping how service portfolios and aftermarket parts are bundled, giving larger vendors a scale advantage in global bid tenders.
Key Report Takeaways
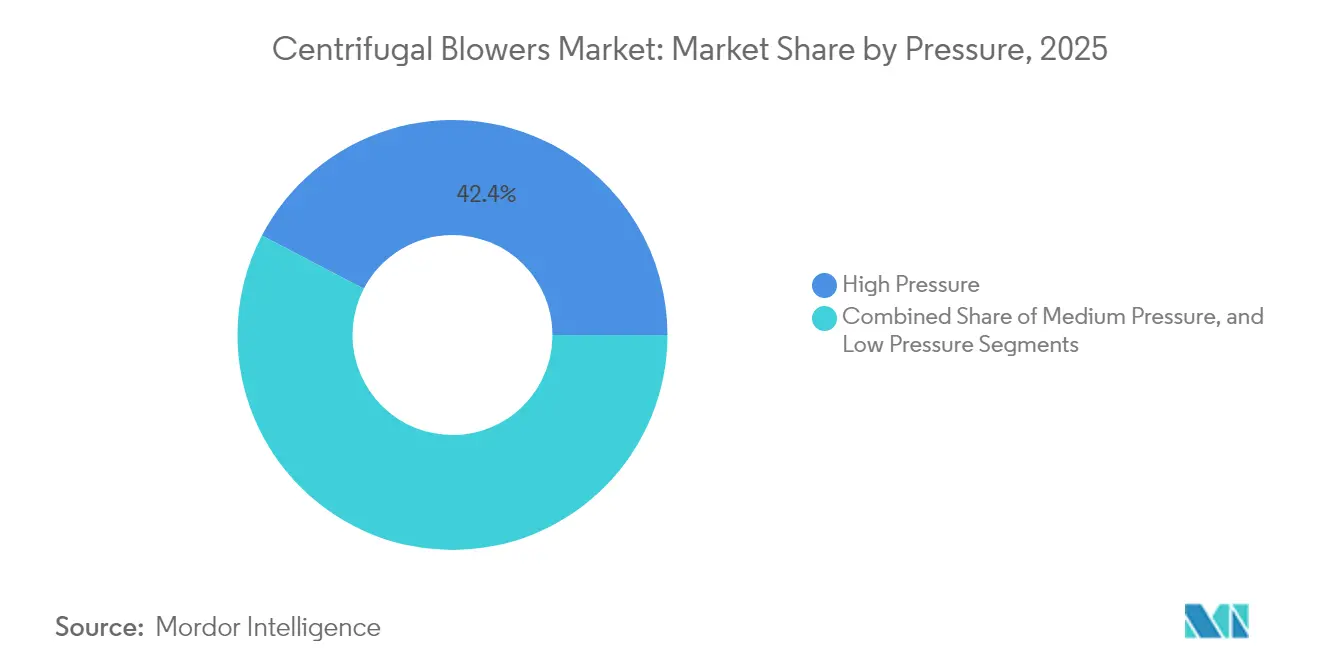
- By pressure, high-pressure configurations held 42.35% of centrifugal blowers market share in 2025 and are growing at a 4.71% CAGR to 2031.
- By stage, multistage units accounted for 36.62% of centrifugal blowers market share in 2025, while high-speed turbo machines log the fastest 5.28% CAGR.
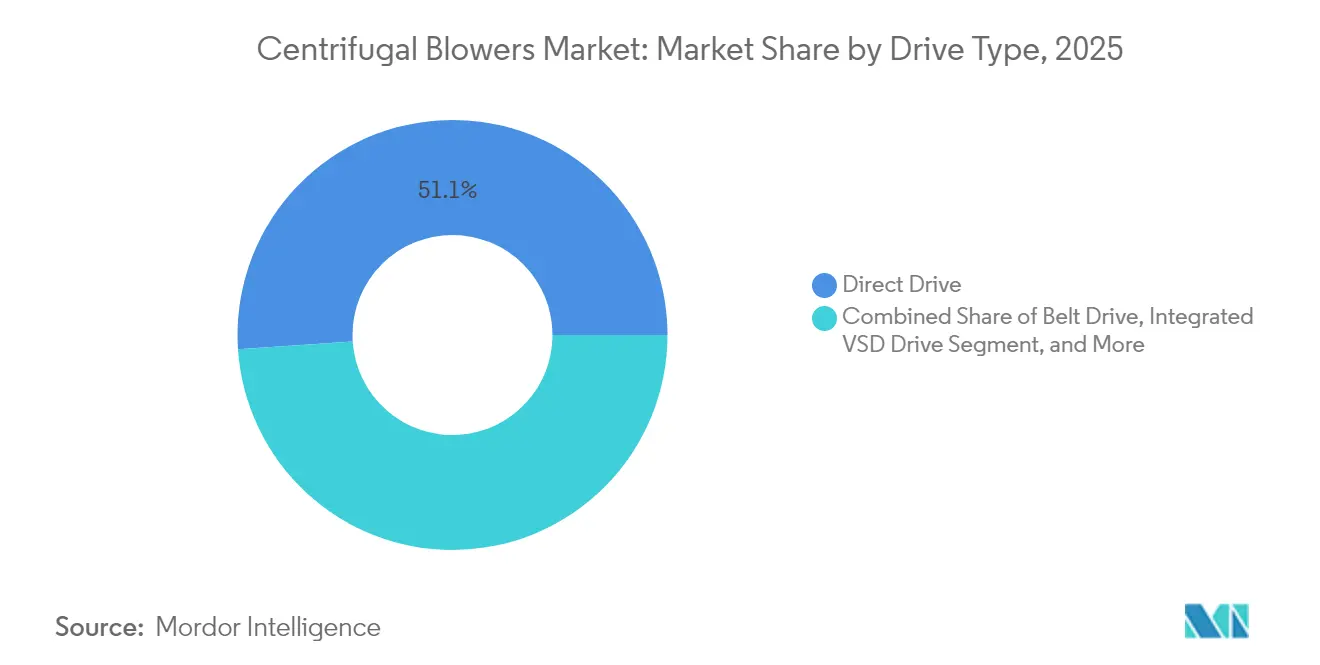
- By drive type, direct drive systems led with 51.05% share in 2025; integrated VSD packages post a 5.53% CAGR through 2031.
- By end use, water and wastewater treatment captured 27.12% of the centrifugal blowers market size in 2025 and advances at a 4.58% CAGR.
- By geography, Asia-Pacific dominated with 47.55% share of market size in 2025 and expands at a 4.47% CAGR to 2031.
Note: Market size and forecast figures in this report are generated using Mordor Intelligence’s proprietary estimation framework, updated with the latest available data and insights as of 2026.
Market Trends and Insights
Drivers Impact Analysis of Centrifugal Blowers Market*
| Driver | ( ~ ) % Impact on CAGR Forecast | Geographic Relevance | Impact Timeline |
|---|---|---|---|
| Energy-efficiency regulations and retrofits | +1.2% | Global - early adoption in North America and EU | Medium term (2-4 years) |
| Expansion of global wastewater capacity | +0.9% | Global - core activity in Asia-Pacific and North America | Long term (≥ 4 years) |
| Chemical and petrochemical build-out in APAC | +0.8% | Asia-Pacific, spill-over to Middle East and Africa | Medium term (2-4 years) |
| Biogas and hydrogen blending requirements | +0.6% | Global - early gains in North America and Europe | Long term (≥ 4 years) |
| OEM-integrated IIoT blower packages | +0.4% | Global - led by developed markets | Short term (≤ 2 years) |
| Urban low-noise HVAC incentives | +0.3% | North America and EU, expanding to urban Asia-Pacific | Medium term (2-4 years) |
| Source: Mordor Intelligence | |||
Energy-efficiency regulations and retrofits
California’s Title 20 rules that took effect in April 2024 set a 1.00 Fan Energy Index threshold, prompting industrial owners to swap legacy fans for variable-speed centrifugal packages. Con Edison pays up to USD 1 million per account each year toward qualified HVAC upgrades, further compressing payback periods. Although the U.S. Department of Energy withdrew a federal standard in January 2025, state codes and EU Ecodesign requirements continue to push global operators toward high-efficiency impeller and motor combinations. Suppliers with factory-integrated drives and predictive analytics win bids because owners want documented performance and remote compliance reporting. These moves adds to the projected growth for the centrifugal blowers market.
Expansion of global wastewater treatment capacity
Only 58% of the world’s 268 billion m³ of wastewater received safe treatment in 2022, creating an urgent build-out agenda. The South Bay plant is doubling throughput to 50 million gpd under a USD 600 million program that specifies oil-free high-efficiency aeration blowers. U.S. Clean Water SRF allotments reached USD 851.2 million in fiscal 2024, while the Drinking Water SRF provided USD 494.4 million, underwriting hundreds of municipal tenders. Sulzer’s HST turbocompressors showed 34% energy savings at a Derby plant in the U.K., demonstrating why utilities upgrade instead of repairing dated roots blowers. Capacity growth combined with energy-reduction targets adds 0.9 percentage points to the market growth curve.
Chemical and petrochemical capacity build-out in Asia-Pacific
India plans to lift petrochemical output to USD 300 billion by 2025 and raise capacity from 29.62 million tons to 46 million tons by 2030 under a INR 10 lakh-crore stimulus. Middle Eastern majors pursue downstream integration and invest in Chinese joint ventures, redirecting capital from gasoline to specialty chemicals. Malaysia’s 2030 roadmap seeks specialty-chemicals hub status, sustaining demand for corrosion-resistant blowers across solvent recovery, catalyst regeneration and pneumatic conveying lines. New crackers, refineries and fertilizer complexes lock in multiyear service contracts, lifting regional equipment orders and adding to CAGR projections.
Biogas and hydrogen blending demand
The U.S. hydrogen roadmap targets 7 to 9 million tonnes per year of clean hydrogen by 2030, while Europe aims for 34 million tonnes by 2040, and electrolyzers and reformers require oil-free, hydrogen-compatible blowers that handle low-density gas without flame-flash risks.[1] Biogas plants mix hydrogen to upgrade methane, creating corrosive H₂S environments that favor duplex stainless or Hastelloy internals. Early adopters in California’s dairy clusters and Germany’s biomethane hubs showcase field performance, adding to the centrifugal blowers market expansion forecast.
Restraints Impact Analysis of Centrifugal Blowers Market*
| Restraint | ( ~ ) % Impact on CAGR Forecast | Geographic Relevance | Impact Timeline |
|---|---|---|---|
| High capital and maintenance cost of turbo units | -0.7% | Global - strongest in emerging markets | Medium term (2-4 years) |
| Competition from alternative blower types | -0.5% | Global - varies by application | Short term (≤ 2 years) |
| Critical-alloy price volatility | -0.4% | Global - supply chain concentrated in select regions | Short term (≤ 2 years) |
| Shortage of magnetic-bearing technicians | -0.3% | Global - acute in developing markets | Long term (≥ 4 years) |
| Source: Mordor Intelligence | |||
High capital and maintenance cost of high-speed turbo blowers
Magnetic-bearing turbo models list well above multistage or rotary-screw alternatives. Atlas Copco’s Q1 2025 update showed softness in large compressor bookings where budget pressure is acute.[2]Field support for high-speed rotors requires specialized diagnostic rigs that many regional OEM partners lack. KPMG’s sector review cites EV/2024E EBITDA multiples of 15.6× for process-flow assets, a premium that eventually trickles down to end-user costs. This cost hurdle adversaly impacts the centrifugal blowers market.
Competition from alternative blower technologies
Positive-displacement and rotary-screw designs now cover flow-pressure windows once dominated by centrifugal impellers. Aerzen’s Delta Hybrid 2.0 targets 8-15 psig at high efficiency, challenging centrifugal incumbency in municipal aeration. Atlas Copco’s oil-free ZS screw line pushes maintenance-free uptime to food plants that previously specified centrifugal stages. Technology overlap erodes differentiation, trimming the growth potential.
*Our forecasts treat driver/restraint impacts as directional, not additive. The impact forecasts reflect baseline growth, mix effects, and variable interactions.
Centrifugal Blowers Market Segment Analysis
By Pressure:
Sustained premium for high-pressure applicationsHigh-pressure machines held 42.35% share of the centrifugal blowers market in 2025 and are forecast to grow 4.71% annually through 2031. Plants handling pneumatic transport, catalyst regeneration and underground ventilation prioritize pressure stability, which supports higher margins on duplex-steel casings and precision-machined impellers. Mining operators, including Epiroc customers, add automation that relies on stable airflow to clear dust and methane pockets.
The centrifugal blowers market size for medium-pressure units remains sizeable as general manufacturing, cement kilns and biomass boilers require dependable airflow without extreme pressure levels. Low-pressure models continue to serve HVAC and simple combustion air but face retrofit losses as owners adopt high-efficiency axial designs. Hydrogen-ready and biogas projects accelerate demand for high-pressure stainless or nickel-alloy blowers that resist embrittlement, improving the revenue mix even as volumes shift among pressure classes.

By Stage/Configuration:
Multistage reliability meets turbo momentumMultistage configurations delivered 36.62% of centrifugal blowers market size in 2025 by offering rugged performance and easy overhaul. Operators appreciate rotational speeds below 4,000 rpm that allow field balancing and straightforward bearing swaps. However, high-speed turbo packages are gaining at a 5.28% CAGR owing to magnetic-bearing impellers finding application in high precision edn-use application. Utility-scale wastewater plants adopt these oil-free units to cut energy bills and avoid lube-oil disposal.
Single-stage overhung wheels still dominate low-pressure HVAC jobs, while integrally-geared models find favor where floor space is tight and discharge pressure falls between multistage and turbo capabilities. OEMs integrate cloud sensors across all configurations, enabling runtime comparisons that guide buyers toward the optimum life-cycle-cost curve. As predictive analytics quantify savings, centrifugal blowers market share is expected to tilt gradually toward turbo designs that sustain performance guarantees.
By Drive Type:
Direct drive steadies the base; VSD gains velocityDirect-coupled motors delivered 51.05% share of the centrifugal blowers market in 2025 due to simplicity, limited alignment issues and widespread technician familiarity. Belt drives survive in brownfield plants where shaft geometry cannot accommodate direct coupling. Integrated VSD packages grow at 5.53% CAGR because utilities reward demand-response capability and because Title 20 rules tighten part-load fan efficiency.Modern VSD firmware supports harmonic filtering and remote fault diagnostics, reducing downtime.
Magnetic-bearing drives occupy the frontier, eliminating oil seals and enabling higher tip speeds. Food, pharma and semiconductor fabs cite contamination-free airflow as the driver for early adoption. As more service centers invest in magnetic-bearing balancers, centrifugal blowers market share for these premium drives should widen, especially in hydrogen production skids and biogas digesters that value oil-free performance.
By End-use Industry:
Water treatment anchors diversified demandWater and wastewater facilities accounted for 27.12% of centrifugal blowers market share in 2025 and advance 4.58% per year to 2031. Biological nutrient removal and stricter outflow permits force municipalities to upgrade aeration capacity. The USD 600 million South Bay expansion doubles daily volume, adding high-efficiency blowers with oxygen-transfer guarantees.
Chemicals and petrochemicals rank second as India, China and the Middle East commission new crackers and fertilizer lines. Mining, cement and steel contribute a steady baseline, although order timing follows commodity price swings. Commercial buildings leverage Con Edison incentives to retrofit fans, while food and beverage processors specify oil-free stages to avoid product taint. This diversity cushions the centrifugal blowers market against downturns in any single sector and allows OEMs to balance capacity across product lines.
Geography Analysis
APAC Centrifugal Blowers Market
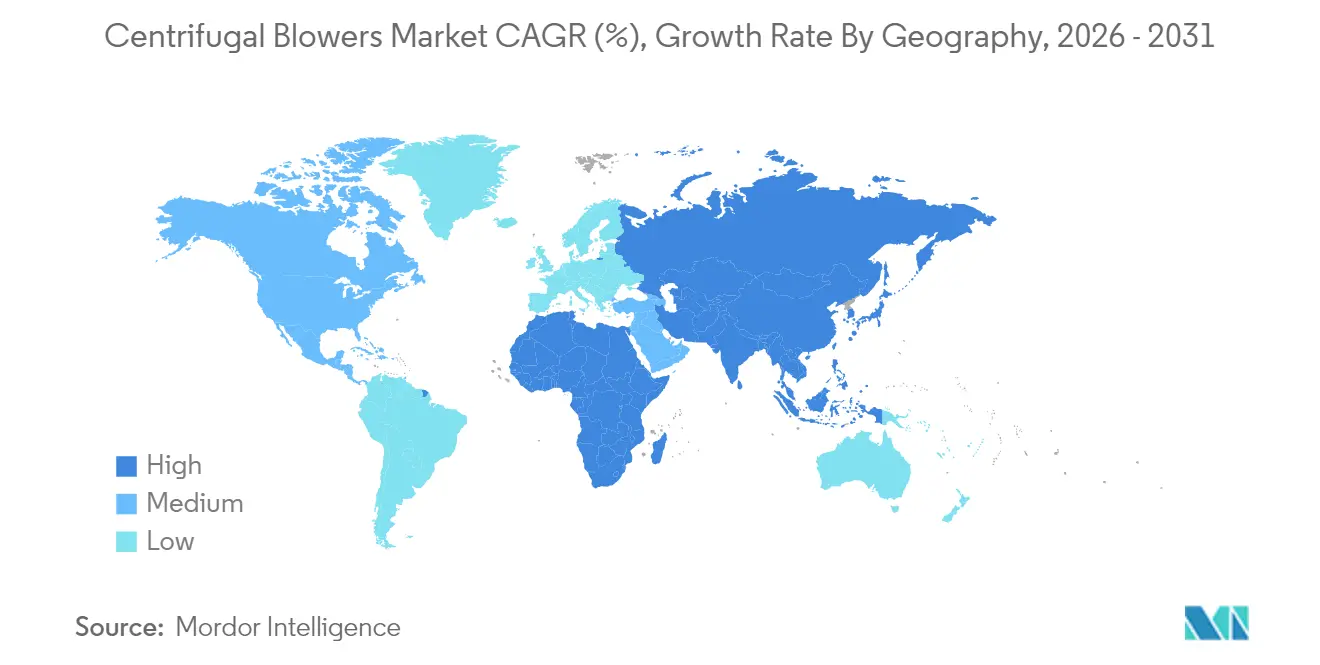
Asia-Pacific held 47.55% of centrifugal blowers market share in 2025 and is forecast to grow 4.47% annually to 2031. India’s petrochemical capacity expansion from 29.62 million tons to 46 million tons drives continuous bids for high-pressure process air. Chinese refinery additions and Southeast Asian specialty-chemicals projects bolster regional order books. Malaysia’s chemicals roadmap and tax incentives attract global polyolefin players that need corrosion-resistant blowers for slurry-loop reactors. Local casting clusters in Gujarat and Shandong shorten lead times and cushion freight costs, sustaining competitive landed pricing.
North America Centrifugal Blowers Market
North America remains a mature but opportunity-rich territory. The South Bay wastewater upgrade and similar SRF-funded projects keep municipal demand steady. California’s Title 20 and New York utility incentives accelerate replacement of fixed-speed fans with VSD units. Hydrogen hubs financed through the Infrastructure Investment and Jobs Act require oil-free blowers for electrolyzers, opening a pipeline of orders that extends through the decade.
EMEA Centrifugal Blowers Market
Europe delivers consistent but policy-linked growth. Sulzer recorded 15.6% order uptick in Europe, the Middle East and Africa during 2024 driven by wastewater mandates and refinery turnarounds. The bloc’s 34 million-tonne hydrogen goal by 2040 necessitates pressure-stable, oil-free air for PEM and alkaline stacks. The Middle East supplements volumes as ADNOC and Saudi Aramco shift toward ammonia and chemicals, each requiring dedicated blower trains for air separation, sulfur recovery and nitric-acid loops.
Regulatory Landscape
Energy-performance compliance for fans and blowers is increasingly anchored around standardized test procedures and reporting metrics. In the United States, the Department of Energy (DOE) energy conservation standards and related test procedures reference the Fan Energy Index (FEI) and AMCA methods such as ANSI/AMCA 214-21 for rating and verification, while aerodynamic performance ratings often use ANSI/AMCA 210-16 (ASHRAE 51-16). Industrial buyers and EPCs also point to established performance codes for blower systems, including ASME/PTC 13 (wire-to-air) and compressed-air adjacent codes such as ANSI/CAGI BL 300 and ISO 22484 for low-pressure air package testing, reinforcing demand for documented efficiency and repeatable acceptance testing.
Policy-driven retrofit activity adds compliance pull-through beyond federal requirements. California Title 20 rules that took effect in April 2024 use a 1.00 FEI threshold, pushing replacements toward variable-speed centrifugal packages. Utility efficiency programs, including Con Edison incentives for qualified HVAC upgrades, further accelerate documented performance retrofits. For suppliers, the practical regulatory impact is tighter alignment between design choices (impeller efficiency, motor class, and integrated VSD) and verifiable testing and reporting workflows that support procurement specifications and post-installation compliance documentation.
Value Chain Analysis
The centrifugal blower value chain spans application engineering and aerodynamic design, sourcing and machining of critical components (impellers, casings, shafts, seals, bearings, motors, and variable-speed drives), and package assembly and system integration (controls, silencers, inlet filters, enclosures, and instrumentation). Verification testing, including third-party or independent laboratory performance testing aligned to AMCA and ASME codes, feeds into distribution through OEM direct sales, EPC channels, and local representatives. Downstream, installation and commissioning are followed by a service-heavy operating phase where preventive maintenance, field balancing, spare parts, and performance optimization dominate lifetime economics, particularly for multistage and high-speed turbo units.
Aftermarket service networks and localized manufacturing footprints influence competitiveness because many end-use tenders prioritize uptime commitments and rapid spares availability. Howden supports installed fleets through global workshop and service models, while IB International (formerly Illinois Blower) cites consolidated manufacturing in Cary, Illinois as a lead-time and support advantage for North American customers. Consolidation among larger industrial vendors and broader portfolio bundling, including Chart Industries integration of Howden, also reshapes the chain by pairing equipment supply with lifecycle services and digital monitoring capabilities that can be offered as packaged scope in municipal and industrial projects.
Competitive Landscape
Global suppliers pursue scale, technology depth and stable aftermarket revenue. Chart Industries and Flowserve plan to merge into a USD 19 billion enterprise, combining USD 3.7 billion in service sales that smooth equipment-cycle volatility. Ingersoll Rand closed 13 acquisitions worth USD 450 million in 2023, including Roots, which fortifies its low-pressure lineup and opens cross-selling into municipal bid lists.
Technology differentiation centers on magnetic bearings, integrated analytics and composite impellers. Loar Holdings’ EUR 365 million purchase of LMB Fans & Motors adds aerospace-grade designs that meet extreme reliability requirements for pharmaceutical isolators and nuclear glove boxes. Atlas Copco posted 3% organic order growth in its gas-and-process compressor segment, illustrating that process-critical buyers prioritize oil-free, high-speed solutions.
Service offerings evolve toward continuous monitoring. Ebara and Verizon collaborate on cyber-secure telemetry for blower fleets, an attractive value-add for utilities concerned about OT vulnerabilities. Smaller regional assemblers pivot to contract machining or focus on aftermarket parts to avoid direct competition. The centrifugal blowers market therefore balances consolidation at the top with a long tail of niche suppliers, preserving customer choice even as global portfolios expand.
Centrifugal Blowers Industry Leaders
-
Howden Group
-
Illinois Blower Inc
-
Atlantic Blowers, LLC
-
Piller Blowers & Compressors
-
Alfotech Fans
- *Disclaimer: Major Players sorted in no particular order
Centrifugal Blowers Market Companies Covered in this Report
- Atlas Copco AB
- Howden Group
- Ingersoll Rand Inc. (Gardner Denver)
- Kaeser Kompressoren SE
- Aerzen Maschinenfabrik GmbH
- Sulzer Ltd.
- EBARA Corp.
- Piller Blowers and Compressors
- Boldrocchi Group
- Aeromeccanica Stranich SpA
- Illinois Blower Inc.
- Spencer Turbine Company
- Continental Blower LLC
- Atlantic Blowers LLC
- Alfotech Fans
- Aerotek Equipment
- Lontra Ltd.
- Xylem Inc. (Flygt)
- Tuthill Corp.
- Multi-Wing Group
Market Opportunities and Future Outlook
Energy-efficiency compliance and verifiable performance testing create a clear whitespace for suppliers that can deliver packaged efficiency and documentation, not just hardware. With California Title 20 enforcing a 1.00 FEI threshold since April 2024 and DOE test-procedure alignment referencing AMCA methods, buyers increasingly write specifications around measurable outcomes. This tends to favor integrated VSD packages, factory performance testing, and digital condition monitoring that support auditability. Vendors that can connect blower controls to reporting workflows and standardized acceptance testing (AMCA 210-16/ASHRAE 51-16 and ASME/PTC 13 in project specifications) have room to expand in retrofit-heavy HVAC and industrial segments where compliance proof and lifecycle cost are procurement differentiators.
Water and wastewater remains the most actionable near-term application stream because aeration upgrades combine energy savings with process stability needs. Howden has continued to position high-speed and integrally geared turbo blower packages and aeration control solutions for wastewater facilities, and funded programs such as the USD 600 million South Bay expansion specify high-efficiency aeration blowers. Another opportunity area involves specialty and harsh-duty gas handling tied to clean-energy and process-industry changes (biogas, hydrogen blending, and petrochemical expansions), where corrosion-resistant materials, oil-free operation, and stable pressure control are critical and can support higher-value configurations. On the supply side, product-line broadening by firms such as IB International, moving beyond custom-engineered fans into pre-engineered high-pressure and vapor compression offerings, points to competitive emphasis on standardized platforms that shorten quoting and delivery cycles while expanding addressable applications.
Recent Industry Developments in Centrifugal Blowers Market
- June 2026: Published technical insights regarding the role of Howden fans in optimizing airflow efficiency to reduce energy consumption in industrial facilities. The analysis focuses on energy-efficiency optimization in centrifugal blowers and reinforces Howden’s OEM portfolio alignment with Chart Industries through a broader, more efficient product suite.
- March 2024: Launched the CubusTurbo 450 high-speed drive blower for municipal and industrial wastewater aeration and other high-capacity applications. The introduction expands high-capacity, energy-efficient aeration solutions for water treatment and highlights the shift toward plug and play systems in core market applications.
- February 2024: Rebranded and completed the merger into IB International, Inc. to consolidate air and gas moving solutions. The consolidation streamlines the global offering and improves aftermarket access across a unified product lineup.
Centrifugal Blowers Market Report Scope and Research Methodology
Market Definition and Coverage
This market covers the revenue generated from centrifugal blowers sold for industrial and commercial airflow and gas-handling duties, including new equipment and standard accessory packages, across all major end-use sectors and regions.
Scope exclusions: It excludes axial fans, positive displacement blowers, site fabrication and piping works, and long-term service-only contracts that are priced outside the blower sale.
Segments Covered in This Report
- By Pressure
- High Pressure
- Medium Pressure
- Low Pressure
- By Stage/Configuration
- Single-Stage
- Multistage
- High-Speed Turbo
- Integrally Geared
- By Drive Type
- Direct Drive
- Belt Drive
- Integrated VSD Drive
- Magnetic-Bearing Drive
- By End-use Industry
- Mining
- Cement
- Pulp and Paper
- Construction
- Steel
- Chemicals and Petrochemicals
- Power Generation
- Water and Wastewater Treatment
- Food and Beverage
- HVAC and Commercial Buildings
- Other Industries
- By Geography
- North America
- United States
- Canada
- South America
- Brazil
- Argentina
- Europe
- Germany
- United Kingdom
- France
- Italy
- Russia
- Asia-Pacific
- China
- Japan
- India
- South Korea
- ASEAN
- Middle East and Africa
- Middle East
- Saudi Arabia
- United Arab Emirates
- Africa
- South Africa
- Nigeria
- Middle East
- North America
Data Sources, Market Sizing, and Validation
Desk Research
Desk research was used to map the demand pool and the operating context where centrifugal blowers are purchased, which then helped us set realistic guardrails for units, pricing, and replacement cycles. Public and official sources were reviewed for indicators such as industrial production, energy consumption, and construction activity, along with infrastructure build-out signals that typically increase aeration and ventilation spend.
We referenced non-paywalled sources such as the US Energy Information Administration (EIA), International Energy Agency (IEA), World Bank, UN Comtrade, and publications from agencies like the US EPA for wastewater and air-related standards, where relevant. We also used annual reports and investor presentations, association websites, and reputed press coverage to understand capacity additions and procurement priorities. In addition, paid subscriptions for company financials and news intelligence, patent databases, and shipment-level trade data were used selectively to cross-check product positioning and import-export intensity. The desk sources listed above are illustrative, and we reviewed many other public documents and data series for collection, validation, and clarification.
Primary Interviews and Surveys
Primary work focused on validating how buyers specify centrifugal blowers, how pricing is quoted in typical project deals, and how demand varies by end use such as wastewater treatment, chemicals, power, cement, and general manufacturing. We spoke with a mix of manufacturers, channel partners, EPC-linked stakeholders, and large end users across key regions, and we used these conversations to confirm assumptions on replacement timing, order mix by pressure and stage, and the share of retrofit versus new-build demand.
Distribution of primary research fieldwork respondents
| Company type | Respondent position | Region |
|---|---|---|
| Top tier: 25% | CXOs: 16% | APAC: 45% |
| Mid tier: 58% | Functional/Unit leaders: 37% | EMEA: 34% |
| Smaller Players: 17% | Managers: 47% | Americas: 21% |
Market-Sizing & Forecasting
Sizing started with a top-down build that reconstructs blower demand from end-use activity indicators, and then converts that demand into value using typical project configurations and pricing ladders. For centrifugal blowers, the model uses signals like wastewater treatment capacity additions, industrial capex cycles, cement and metals production trends, power and petrochemical project pipelines, and import-export patterns for rotating equipment.
Once the demand pool was set, we corroborated the results using selective bottom-up approximations such as sampled price quotes by pressure class, channel checks on order intake patterns, and sanity checks against supplier revenue exposure where disclosures allow. Key variables used as inputs included average selling price by pressure and stage, the mix of single-stage versus multi-stage units, motor and drive preferences that affect ticket size, replacement and overhaul cadence in continuous-duty plants, and energy efficiency retrofit triggers, which are often tied to regulatory or utility cost changes. Where direct volume visibility was limited in smaller geographies, gaps were handled through proxy indicators like industrial output and trade intensity, followed by expert confirmation.
For forecasting, scenario analysis was used to reflect different capex climates and infrastructure spending paths, and then a simple regression-based sensitivity was applied on a few leading indicators such as industrial production and utility and wastewater investment trends. Assumptions were checked with interview feedback so the final growth path stays realistic rather than purely curve-fit from history.
Data Validation & Update Cycle
Model outputs were validated through multiple checks so that overcounts and undercounts were caught early. We compared totals against independent signals such as equipment trade flows, large-project announcements, and known demand centers by industry, and then reviewed outliers before internal sign-off.
If a major variance showed up, for example an unusual price jump, a sudden regional demand spike, or a slowdown in a specific end-use category, assumptions were revisited and selected primary contacts were re-engaged to confirm what changed. Reports are refreshed annually, and interim updates are triggered when material events affect pricing, lead times, or end-use spending. Before delivery, a final analyst pass is completed so the published view reflects the latest available data points.
Mordor Intelligence's Centrifugal Blowers Market Size Measured Against Other Published Estimates
Published market sizes for centrifugal blowers can look far apart because firms do not always count the same equipment families, they may apply different price buildup logic, and they often use different base years and currency timing.
The main gap comes from whether turbo and high-speed blower designs, packaged aeration systems, and aftermarket-heavy bundles are treated as part of the same revenue pool, where Mordor Intelligence counts only centrifugal blower equipment value aligned to pressure and stage classifications and then validates pricing through project-spec and channel feedback before forecasting.
Benchmark comparison
| Source | Market Size | Gaps in Research Methodology |
|---|---|---|
| Mordor Intelligence | USD 3.21 B (2026) | |
| Industry Publisher A | USD 3.20 B (2024) | Uses an earlier base year and a broader product labeling approach, which can pull in adjacent blower and packaged-system revenues, and it may not normalize pricing to consistent motor and drive configurations. |
| Trade Release B | USD 2.69 B (2023) | Anchors sizing on a conservative base year and likely assumes slower price progression, and it can understate replacement-driven demand where plants run continuous-duty cycles and upgrade for efficiency. |
The spread across the three figures is mainly explained by scope edges and base-year choices, followed by how pricing is escalated across pressure classes and packaged configurations. By keeping the demand pool tied to observable end-use activity and by rechecking key assumptions when variances appear, the estimate stays traceable to practical inputs that can be repeated and updated.
Key Questions Answered in the Report
What is the projected size of the centrifugal blowers market by 2031?
The centrifugal blowers market is expected to reach USD 3.96 billion by 2031 on a 4.35% CAGR.
Which pressure class leads revenue today?
High-pressure machines held 42.35% share in 2025 and remain the fastest-growing pressure segment at 4.71% CAGR.
Why are variable-speed drives gaining traction?
Utility incentives and Title 20 efficiency rules push owners to adopt integrated VSD packages that cut power use at part load, supporting a 5.53% CAGR for this drive segment.
How is wastewater investment influencing blower demand?
Large projects such as the USD 600 million South Bay upgrade require high-efficiency aeration blowers, reinforcing water treatment as the top end-use segment.
What role does clean hydrogen play for blower suppliers?
Electrolyzers and low-carbon reformers need oil-free, hydrogen-compatible blowers, opening a significant new application stream as the United States targets up to 9 million tons per annum of capacity by 2030.
Which regions are expanding fastest in the centrifugal blowers market?
Asia-Pacific leads with a projected 4.47% CAGR, driven by petrochemical build-outs in India, refinery additions in China and specialty-chemical investments across Southeast Asia.