Central And Eastern Europe Courier, Express, And Parcel (CEP) Market Size and Share
Market Overview
| Study Period | 2018 - 2031 |
|---|---|
| Forecast Data Period | 2026 - 2031 |
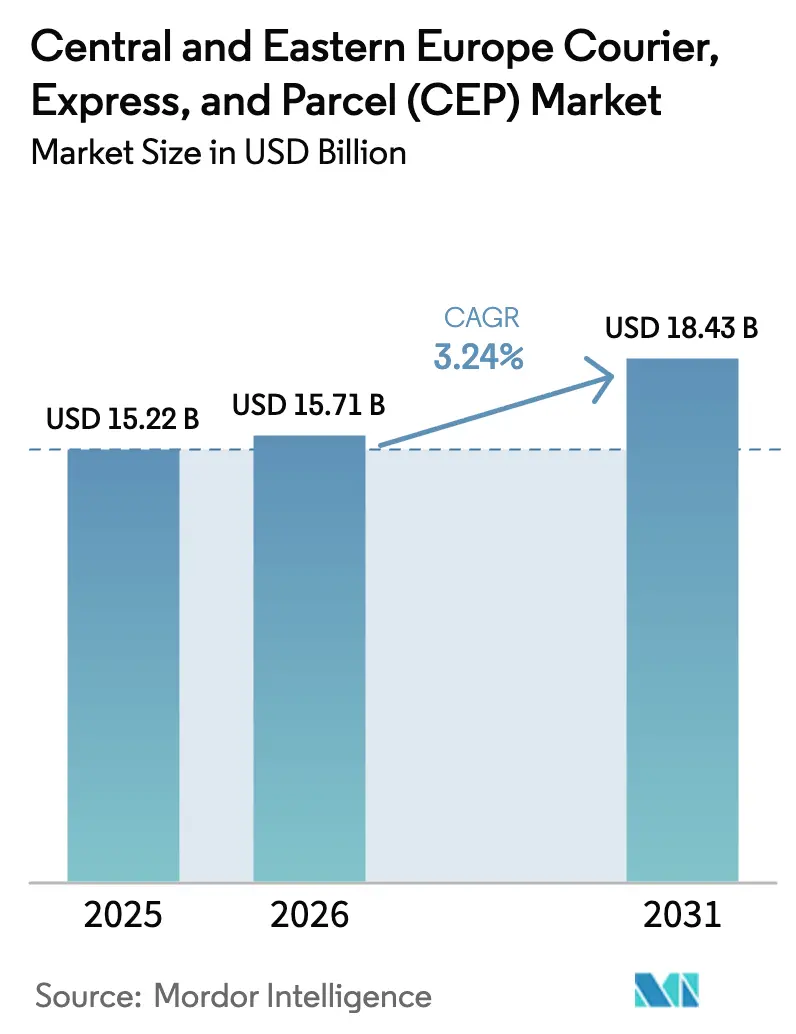
| Base Year Market Size (2025) | USD 15.22 Billion |
| Market Size (2026) | USD 15.71 Billion |
| Market Size (2031) | USD 18.43 Billion |
| Growth Rate (2026 - 2031) | 3.24% CAGR |
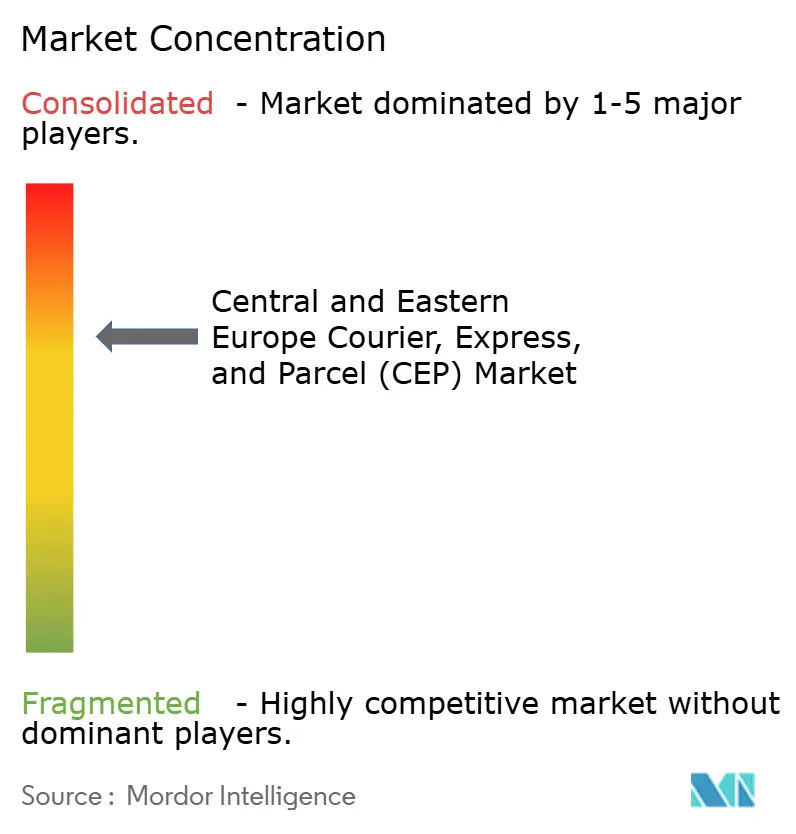
| Market Concentration | Medium |
Major Players *Disclaimer: Major Players sorted in no particular order Image © Mordor Intelligence. Reuse requires attribution under CC BY 4.0. | |
Central And Eastern Europe Courier, Express, And Parcel (CEP) Market Analysis by Mordor Intelligence
The Central and Eastern Europe courier, express, and parcel (CEP) market size in 2026 is estimated at USD 15.71 billion, growing from 2025 value of USD 15.22 billion with 2031 projections showing USD 18.43 billion, growing at 3.24% CAGR over 2026-2031. A hub position linking Western Europe with high-growth eastern corridors, combined with EU-backed infrastructure upgrades, is amplifying demand for reliable parcel flows. Explosive online shopping, the roll-out of automated parcel lockers, and near-shoring of fulfillment centers are compressing delivery windows while stimulating technology adoption in sortation and route planning. Simultaneously, dual-use military mobility funding is accelerating rail and road enhancements, reinforcing the Central and Eastern Europe courier, express, and parcel (CEP) market as an indispensable bridge for intra-EU trade. Competitive intensity is moderate: global integrators invest in automation at regional hubs, yet local champions leverage proximity advantages to extend out-of-home networks. Structural headwinds driver shortages, capacity-constrained airports, and fragmented ADR compliance compel operators to innovate through electrified fleets and AI-driven planning tools.
Key Report Takeaways
- By destination, domestic deliveries led with 65.12% of the Central and Eastern Europe courier, express, and parcel (CEP) market share in 2025; international services are projected to grow at a 3.46% CAGR between 2026-2031.
- By speed of delivery, non-express deliveries accounted for 75.78% of the Central and Eastern Europe courier, express, and parcel (CEP) market size in 2025; express services are advancing at a 3.86% CAGR between 2026-2031.
- By model, business-to-consumer (B2C) deliveries represented a 51.74% share in 2025; consumer-to-consumer (C2C) transactions are forecast to record a 2.94% CAGR between 2026 and 2031.
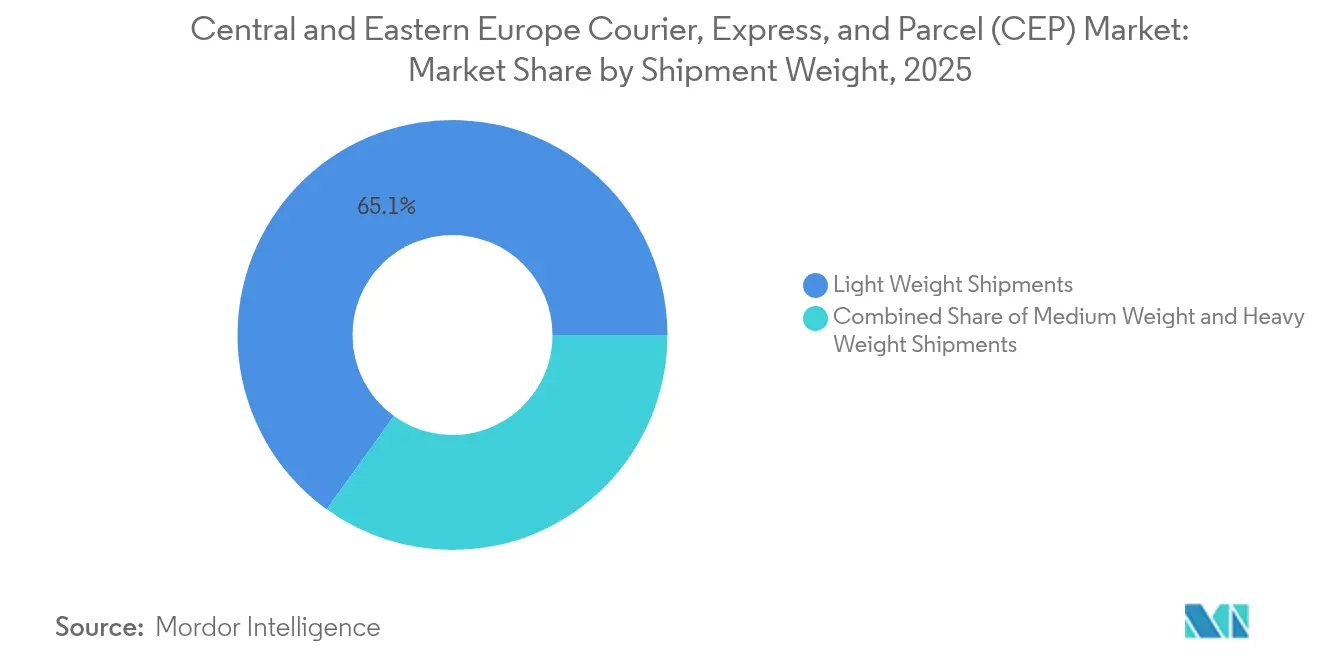
- By shipment weight, light parcels captured a 65.05% share in 2025; heavy parcels are projected to expand at a 2.72% CAGR between 2026-2031.
- By mode of transport, road held 50.92% share in 2025; air shipments are expected to rise at a 2.81% CAGR between 2026-2031.
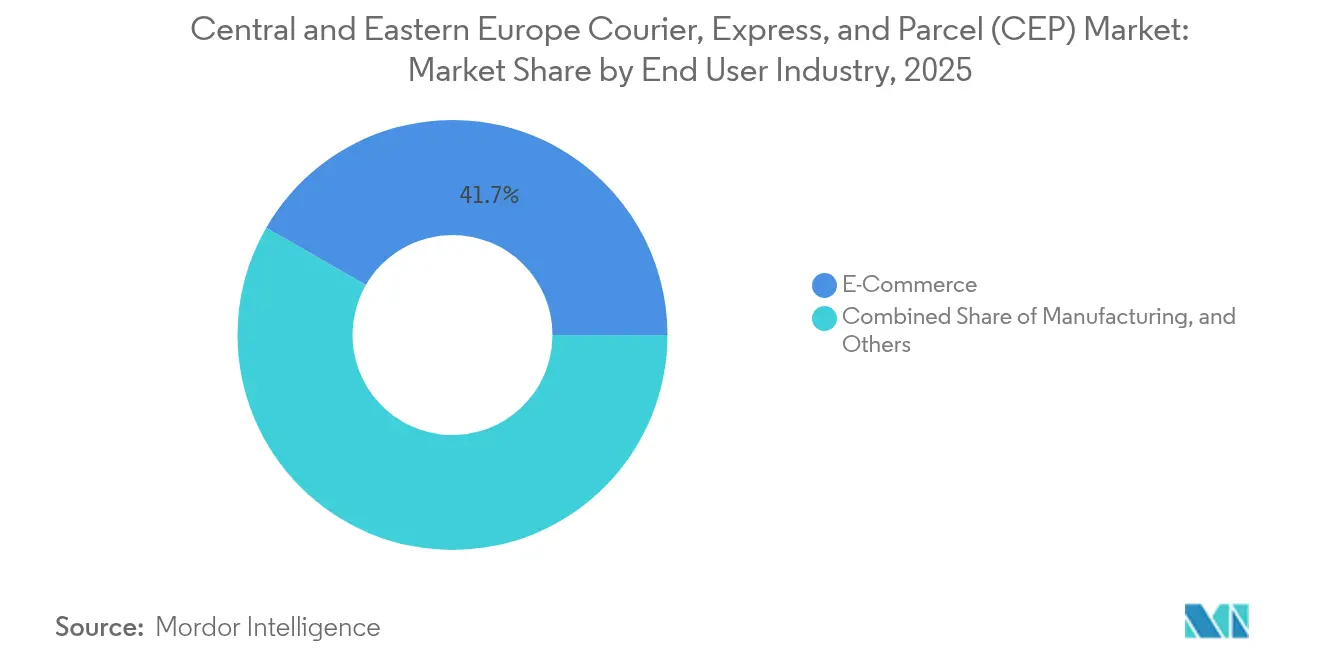
- By end user industry, e-commerce drove 41.68% revenue share in 2025; healthcare is set to grow at a 3.47% CAGR between 2026-2031.
- By country, Poland dominated with a 29.41% share in 2025; Bulgaria is poised to register the highest 3.72% CAGR over 2026-2031.
Note: Market size and forecast figures in this report are generated using Mordor Intelligence’s proprietary estimation framework, updated with the latest available data and insights as of 2026.
Central And Eastern Europe Courier, Express, And Parcel (CEP) Market Trends and Insights
Drivers Impact Analysis*
| Driver | (~) % Impact on CAGR Forecast | Geographic Relevance | Impact Timeline |
|---|---|---|---|
| Explosive B2C e-commerce volumes post-COVID | +0.8% | Poland, Czech Republic, Hungary with spillover to Romania, Bulgaria | Short term (≤ 2 years) |
| EU cohesion-funded road and rail upgrades slash transit times | +0.6% | Romania, Poland, Bulgaria, Slovakia with TEN-T corridor focus | Medium term (2-4 years) |
| Rapid parcel-locker roll-outs boosting OOH delivery density | +0.5% | Poland, Czech Republic, Hungary expanding to Baltic states | Short term (≤ 2 years) |
| Cross-border SME export surge within EU's single market | +0.4% | Poland, Czech Republic, Hungary as export hubs to Western Europe | Medium term (2-4 years) |
| Near-shoring of EU fulfillment hubs to CEE | +0.3% | Poland, Czech Republic, Romania as primary beneficiaries | Long term (≥ 4 years) |
| EV-focused last-mile subsidies lowering cost per stop | +0.2% | Urban centers in Poland, Czech Republic, Hungary | Medium term (2-4 years) |
| Source: Mordor Intelligence | |||


Explosive B2C E-Commerce Volumes Post-COVID
The sustained lift in online shopping continues to be the single most powerful catalyst for the Central and Eastern Europe courier, express, and parcel (CEP) market. Parcel flows on the Poland–Ukraine route climbed 45.3% between 2021 and 2023, forcing carriers to add cross-dock capacity at border zones. International marketplaces such as Trendyol and Allegro entered Romania and Bulgaria in 2024, adding millions of new consumers to regional networks. InPost reported 90% year-over-year growth in locker installations across Eastern Europe, confirming that out-of-home solutions now drive density advantages. Peak-season traffic has begun spilling into secondary airports after Warsaw Chopin reached its design threshold, increasing dwell times but also creating openings for new air gateways. The irreversible shift toward digital retail implies that the Central and Eastern Europe courier, express, and parcel (CEP) market will remain volume-positive even if macro sentiment softens[1]“CEF Transport: €2.8 billion to boost mobility,” European Climate Infrastructure and Environment Executive Agency, cinea.ec.europa.eu.
EU Cohesion-Funded Road and Rail Upgrades Slash Transit Times
Massive public investment is compressing lead times and lifting reliability across corridors that directly feed the Central and Eastern Europe courier, express, and parcel (CEP) market. Romania’s National Recovery and Resilience Plan allocates EUR 7.6 billion (USD 8.38 billion) to transport, including the DX12 Craiova–Pitesti Expressway that shortens domestic west–east truck runs by 90 minutes. The Connecting Europe Facility disbursed EUR 2.8 billion (USD 3.09 billion) to 94 transport projects in 2025, with 77% earmarked for rail electrification and ERTMS upgrades. Poland’s eastern provinces secured PLN 2.4 billion (USD 0.60 billion) for 214 km of upgraded roads that attach directly to TEN-T hubs. Rail Baltica and Czech high-speed programs promise to trim Warsaw–Prague cargo runtimes below 6 hours in future timetables. Dual-use military mobility grants worth EUR 807 million (USD 890.63 million) ensure that routes remain resilient under commercial or defense pressure, fortifying the Central and Eastern Europe courier, express, and parcel (CEP) market against geopolitical shocks[2]“Additional PLN 2.4 billion for roads in Eastern Poland,” Ministry of Development Funds and Regional Policy, gov.pl.
Rapid Parcel-Locker Roll-Outs Boosting OOH Delivery Density
More than 14,000 new automated lockers are scheduled for deployment in 2025, pushing pickup-point penetration in Polish cities above one unit per 1,000 residents. GLS expanded to 115,000 pickup points Europe-wide in mid-2024, with 90% year-over-year growth in Central Europe alone. Solar-powered locker models piloted in France are expected to migrate eastward, mitigating grid-capacity constraints that currently slow depot electrification. Out-of-home density reduces vehicle stops and positions the Central and Eastern Europe courier, express, and parcel (CEP) market to absorb rising parcel flows without matching increases in road miles. The networks also enable frictionless returns and C2C exchanges, aligning with EU waste-reduction directives. The scalability of locker ecosystems is beginning to blur competitive lines between postal incumbents and technology-first entrants, keeping pricing rational yet innovation fast.
Cross-Border SME Export Surge Within the EU Single Market
The EU’s frictionless trade area has unleashed a new wave of micro-multinationals, and their export consignments feed directly into the Central and Eastern Europe courier, express, and parcel (CEP) market. Poland transited 50% of Ukraine’s EU-bound imports in 2024, demonstrating the hub role of CEE gateways. Liberalization of EU–Ukraine road carriage removed licensing bottlenecks, while digital customs systems cut document preparation times by up to 30%. Rail Baltica linkages and Slovak–Ukrainian terminals integrated under Solidarity Lane protocols further strengthen east–west cargo elasticity. Rising export complexity favors carriers offering bundled customs, insurance, and fulfillment, driving service differentiation within the Central and Eastern Europe courier, express, and parcel (CEP) market.
Restraints Impact Analysis*
| Restraint | (~) % Impact on CAGR Forecast | Geographic Relevance | Impact Timeline |
|---|---|---|---|
| Driver shortages and wage inflation | -0.7% | Poland, Czech Republic, Hungary with acute shortages in long-haul segments | Short term (≤ 2 years) |
| Fragmented regulatory regimes for ADR/dangerous goods | -0.3% | Cross-border corridors between CEE countries and Western Europe | Medium term (2-4 years) |
| Rising airport and air-cargo user fees in secondary hubs | -0.2% | Regional airports in Poland, Czech Republic, Hungary | Medium term (2-4 years) |
| Grid-capacity bottlenecks delaying depot electrification | -0.1% | Urban logistics centers in Poland, Romania, Czech Republic | Long term (≥ 4 years) |
| Source: Mordor Intelligence | |||
Driver Shortages and Wage Inflation
The European trucking pool is missing more than 230,000 active drivers, a deficit projected to triple if retirements outpace recruitment. Wage gaps lure experienced CEE drivers west, leaving local fleets understaffed even as parcel volumes accelerate. Ukrainian entrants can command USD 1,200–1,300 monthly, versus USD 2,750 for Polish veterans, compressing margin headroom for regional carriers. GLS reported a 7.7% jump in people costs in its 2024 accounts, confirming that wage inflation is no longer localized. Automation and route-optimization software have become mandatory investments rather than optional upgrades for firms competing in the Central and Eastern Europe Courier, Express, and Parcel (CEP) market[3]“Europe Truck Driver Shortage Report 2023,” International Road Transport Union, iru.org.
Fragmented Regulatory Regimes for ADR/Dangerous Goods
ADR 2025 updates introduce tougher documentation and equipment checks, yet enforcement varies widely among CEE states. Carriers crossing three borders in one shift may face disparate inspection standards that add idle hours and penalty risk. Smaller operators struggle to absorb compliance costs, nudging market share toward scale players with in-house regulatory teams. Divergent interpretations of EU mobility-package rules on cabotage further complicate planning. While digital consignment systems promise eventual harmonization, the interim burden weighs on the Central and Eastern Europe Courier, Express, and Parcel (CEP) market outlook[4]“Military mobility funding of €807 million,” European Climate Infrastructure and Environment Executive Agency, cinea.ec.europa.eu.
*Our forecasts treat driver/restraint impacts as directional, not additive. The impact forecasts reflect baseline growth, mix effects, and variable interactions.
Segment Analysis
By End User Industry: E-Commerce and Healthcare Shape Demand
E-commerce generated 41.68% of parcels in 2025, affirming its primacy in the Central and Eastern Europe courier, express, and parcel (CEP) market. Cross-docking centers near urban rings enable one-day reach to 80% of regional households. Retailers finance locker-network densification in exchange for branded pick-up ads, lowering acquisition costs.
Healthcare is the fastest climber at 3.47% CAGR between 2026-2031, propelled by prescription-by-post and biologic medicines demanding cold-chain certification. Operators deploy temperature-controlled mini-hubs within 30 minutes of Category A hospitals, minimizing risk. Manufacturing outputs rely on just-in-time parcel feeds of critical components, while financial services shift to secure digital exchanges, slowly reducing hardcopy dispatches. The Central and Eastern Europe courier, express, and parcel (CEP) industry thus diversifies revenue streams beyond consumer retail, enhancing resilience.


By Destination: Cross-Border Momentum Surges
International consignments account for the fastest-growing slice of the Central and Eastern Europe courier, express, and parcel (CEP) market size, with a 3.46% CAGR projected between 2026-2031. Domestic networks remain dominant due to their 65.12% share in 2025, but cross-border flows receive a structural tailwind from TEN-T rail upgrades and liberalized road permits. The Central and Eastern Europe Courier, Express, and Parcel (CEP) industry leverages Poland’s geocentric access to reroute volumes away from congested German hubs, trimming transit by up to one day on Benelux lanes. Locker density inside national borders also supports cross-border returns, smoothing customer experience. Carriers that pair DDP customs solutions with zone-skipping sortation see higher parcel-completion rates and lower return-to-sender ratios.
Intensifying collaboration between parcel operators and national railways unlocks new capacity on overnight services linking Prague, Bratislava, and Warsaw. EU Solidarity Lanes aimed at Ukraine commerce inject emergency funding into transshipment yards, directly benefitting cross-border SMEs. Meanwhile, domestic services counter with premium same-day propositions targeting dense metro corridors. A shifting assessment of last-mile cost versus delivery speed will determine how share evolves inside the Central and Eastern Europe courier, express, and parcel (CEP) market by 2031.
By Speed of Delivery: Express Finds New Headroom
Express parcels are slated to expand faster than the wider Central and Eastern Europe courier, express, and parcel (CEP) market, advancing at 3.86% CAGR between 2026-2031. Real-time visibility and guaranteed time windows resonate with B2B shippers and affluent urban consumers. Non-express services keep a 75.78% baseline share, yet they integrate AI routing to shave hours from standard arrivals without price shocks. Investments such as Romania’s EUR 4.55 billion rail electrification shorten trunk-haul legs, narrowing the cost gap between service tiers.
Air-express momentum hinges on fresh runway capacity. Warsaw’s planned Central Communication Port could redirect freight if environmental approvals proceed, alleviating pressure on chopin slots. Road-based express will gain from toll-free military mobility lanes opened for civilian use during off-peak hours. The Central and Eastern Europe courier, express, and parcel (CEP) market therefore sees a blended model where express promise aligns with infrastructure reality and customer affordability.
By Shipment Weight: Light Parcels Keep the Lion’s Share
Light weight parcels dominate the Central and Eastern Europe courier, express, and parcel (CEP) market size with a 65.05% share in 2025. Automation inside hubs favors units under 3 kg that can flow through high-speed sorters without manual touches. Apparel, cosmetics, and small electronics anchor this weight band and continue to migrate from store networks to direct-to-consumer channels. Medium parcels act as buffer capacity for SMEs shipping combined orders and subscription boxes.
Heavy parcels, though only a fractional volume contributor, log a 2.72% CAGR between 2026-2031 as furniture and DIY goods pivot to online. Depot redesigns create segregated heavy-parcel chambers to prevent throughput drag on high-speed belts. The Central and Eastern Europe courier, express, and parcel (CEP) market pairs such upgrades with dynamic pricing modeled on volumetric load, allowing operators to monetise dead space in trucks during shoulder seasons.
By Mode of Transport: Road Rules, Rail Advances
Road retains 50.92% revenue share in 2025 owing to its unmatched last-mile flexibility and overnight domestic reach. However, driver scarcity and fuel volatility push operators toward load-pooling alliances that maximise axle-kilometers. Air grows at 2.81% CAGR between 2026-2031 on the back of time-critical e-commerce and pharma, yet capacity caps at Warsaw and Budapest airports temper upside.
Rail benefits from EUR 2.8 billion (USD 3.09 billion) CEF funding that electrifies cross-border tracks and implements ERTMS signaling. Carriers integrate swap-body trailers to shift road volumes onto nighttime rail slots, reducing CO₂ intensity and avoiding rest-time limits. The Central and Eastern Europe courier, express, and parcel (CEP) market sees nascent waterway solutions along the Danube, mainly for bulky e-commerce returns routed to refurbishment centers in Budapest.
By Model: B2C Dominates as C2C Gains Traction
With 51.74% of value in 2025, B2C is the anchor of the Central and Eastern Europe courier, express, and parcel (CEP) market. Marketplace entrants leverage integrated payment, customs, and delivery APIs to localize in weeks rather than months. Parcel locker penetration cuts failed deliveries, underpinning next-day guarantees at standard-service prices. B2B holds stable demand from automotive and machinery exporters that require pallet-compatible parcel networks for medium-weight parts.
C2C consignments rise at a 2.94% CAGR between 2026-2031, catalyzed by recommerce platforms that depend on fast, inexpensive returns. The Central and Eastern Europe courier, express, and parcel (CEP) industry is responding with QR code-based label-free drop-off flows that bypass post-office queues. Digital wallets credit sellers minutes after proof of handover, increasing platform liquidity and parcel stickiness. Retail incumbents now trial integrated locker-to-locker C2C modules to retain traffic otherwise lost to specialist apps.
Geography Analysis
Poland anchors the Central and Eastern Europe courier, express, and parcel (CEP) market with a 29.41% revenue share in 2025 and enjoys privileged access to both Western European and Ukrainian routes. DHL earmarked EUR 300 million (USD 331.09 million) for a Poznan mega-hub that automates 100,000 parcels per hour, while InPost’s capital plan adds 3,000 lockers to sustain locker-per-capita leadership. Airport constraints at Warsaw compel some express cargo to detour via Leipzig or Katowice, marginally extending transit for premium shippers.
Bulgaria delivers the strongest growth outlook at 3.72% CAGR between 2026-2031, helped by Danube corridor upgrades and EU cohesion grants targeting road densification. Multimodal centers near Ruse position exporters to capture Southeast European flows. Romania’s EUR 7.6 billion (USD 8.38 billion) infrastructure package reallocates 60% to rail electrification, shrinking Bucharest–Cluj freight runtimes by forecast 30%. The Sameday–Cargus merger accelerates Romanian network consolidation and primes export routes into Hungary and Serbia.
Czech Republic and Hungary capitalise on central geography and automotive clusters that funnel B2B parcels, while Baltics ride Rail Baltica’s phased completion to unlock 870 km of high-speed track. Croatia, Slovenia, and Slovakia play niche roles, pivoting to tourism-driven parcel peaks. Collectively, the Central and Eastern Europe Courier, Express, and Parcel (CEP) market earns resilience from this geographic mosaic, balancing mature high-volume nodes with fast-growing peripheral plays.
Competitive Landscape
The Central and Eastern Europe courier, express, and parcel (CEP) market is moderately consolidated and hosts a balanced rivalry between global integrators and agile regional champions. DHL, FedEx, and GLS deploy deep capital pools to automate hubs, embed AI route planning, and guarantee day-certain international lead times. InPost dominates locker ecosystems through a first-mover advantage and plans to invest PLN 1.8 billion (USD 0.45 billion) in 2025, with 60% ring-fenced for hardware roll-outs.
Regional leaders such as Fan Courier, Sameday, and Poczta Polska differentiate via cultural affinity, granular address databases, and flexible cash-on-delivery options still preferred by segments of the CEE consumer base. Sameday’s acquisition of Cargus lifts its Romanian parcel share above 30%, sharpening local competition. Meanwhile, GLS shed its U.S. freight arm to focus on European parcel core, freeing capital for automation at Prague, Budapest, and Zagreb sortation nodes.
Technology shapes the next battleground. Smart-locker patents, blockchain-anchored chain-of-custody modules, and predictive ETA interfaces all raise customer expectations. Companies unable to match innovation cadence risk relegation to subcontractor status. Environmental KPIs also loom: the EU Fit-for-55 roadmap calls for zero-emission urban deliveries by 2030, compelling fleets to invest in e-trucks and depot chargers despite grid limitations. In aggregate, the Central and Eastern Europe courier, express, and parcel (CEP) market prizes scale, tech fluency, and regulatory mastery as the triad for sustained leadership.
Central And Eastern Europe Courier, Express, And Parcel (CEP) Industry Leaders
DHL Group
InPost
La Poste Group
Poczta Polska SA
International Distribution Services (IDS)
- *Disclaimer: Major Players sorted in no particular order

Recent Industry Developments
- June 2025: Sameday (eMAG Group) acquired Cargus, pending Romanian Competition Council clearance, creating a combined entity positioned to challenge Fan Courier.
- January 2025: InPost announced nearly GBP 600 million (USD 736.81 million) investment for United Kingdom expansion by 2029, bringing total UK spend to GBP 1 billion (USD 1.27 billion) and adding hundreds of parcel lockers.
- February 2024: BRT, part of Geopost, opened a strategic hub in Cessalto, Italy, boosting capacity on northeast corridors that feed Central and Eastern Europe.
- September 2024: GLS divested its U.S. freight business to DC Logistics to refocus resources on European parcel growth.


Central And Eastern Europe Courier, Express, And Parcel (CEP) Market Report Scope
Domestic, International are covered as segments by Destination. Express, Non-Express are covered as segments by Speed Of Delivery. Business-to-Business (B2B), Business-to-Consumer (B2C), Consumer-to-Consumer (C2C) are covered as segments by Model. Heavy Weight Shipments, Light Weight Shipments, Medium Weight Shipments are covered as segments by Shipment Weight. Air, Road, Others are covered as segments by Mode Of Transport. E-Commerce, Financial Services (BFSI), Healthcare, Manufacturing, Primary Industry, Wholesale and Retail Trade (Offline), Others are covered as segments by End User Industry. Albania, Bulgaria, Croatia, Czech Republic, Estonia, Hungary, Latvia, Lithuania, Poland, Romania, Slovak Republic, Slovenia are covered as segments by Country.| Domestic |
| International |
| Express |
| Non-Express |
| Business-to-Business (B2B) |
| Business-to-Consumer (B2C) |
| Consumer-to-Consumer (C2C) |
| Heavy Weight Shipments |
| Light Weight Shipments |
| Medium Weight Shipments |
| Air |
| Road |
| Others |
| E-Commerce |
| Financial Services (BFSI) |
| Healthcare |
| Manufacturing |
| Primary Industry |
| Wholesale and Retail Trade (Offline) |
| Others |
| Albania |
| Bulgaria |
| Croatia |
| Czech Republic |
| Estonia |
| Hungary |
| Latvia |
| Lithuania |
| Poland |
| Romania |
| Slovak Republic |
| Slovenia |
| Rest of CEE |
| Destination | Domestic |
| International | |
| Speed of Delivery | Express |
| Non-Express | |
| Model | Business-to-Business (B2B) |
| Business-to-Consumer (B2C) | |
| Consumer-to-Consumer (C2C) | |
| Shipment Weight | Heavy Weight Shipments |
| Light Weight Shipments | |
| Medium Weight Shipments | |
| Mode of Transport | Air |
| Road | |
| Others | |
| End User Industry | E-Commerce |
| Financial Services (BFSI) | |
| Healthcare | |
| Manufacturing | |
| Primary Industry | |
| Wholesale and Retail Trade (Offline) | |
| Others | |
| Country | Albania |
| Bulgaria | |
| Croatia | |
| Czech Republic | |
| Estonia | |
| Hungary | |
| Latvia | |
| Lithuania | |
| Poland | |
| Romania | |
| Slovak Republic | |
| Slovenia | |
| Rest of CEE |


Market Definition
- Courier, Express, and Parcel - The Courier, Express, and Parcel services, often called as CEP Market, refers to the logistics and postal service providers which specialize in moving small goods (parcels/packages). It captures the overall market size (USD) and market volume (number of parcels) of (1) the shipments/parcels/packages which are under 70kgs/ 154lbs weight, (2) Business Customer packages viz. Business-to-Business (B2B) & Business-to-Consumer (B2C) as well as private customer packages (C2C), (3) non-express parcel delivery services (Standard and Deferred) as well as express parcel delivery services (Day-Definite-Express and Time-Definite-Express), (4) domestic as well as international shipments.
- Demographics - To analyse total addressable market demand, population growth & forecasts have been studied and presented in this industry trend. It represents population distribution across categories like gender (male/female), development area (urban/rural), major cities among other key parameters like population density and final consumption expenditure (growth and share % of GDP). This data has been used for assessing the fluctations in demand & consumption expenditure, and the major hotspots (cities) of potential demand.
- Domestic Courier Market - Domestic Courier Market refers to the CEP shipments wherein the origin and destination is within the boundary of the geography studied (country or region as per the scope of report). It captures the market size (USD) and market volume (number of parcels) of (1) the shipments/parcels/packages which are under 70kgs/ 154lbs weight, including light weight shipments, medium weight shipments and heavy weight shipments (2) Business Customer packages viz. Business-to-Business (B2B) & Business-to-Consumer (B2C) as well as private customer packages (C2C), (3) non-express parcel delivery services (Standard and Deferred) as well as express parcel delivery services (Day-Definite-Express and Time-Definite-Express).
- E-Commerce - This end user industry segment captures the external (outsourced) logistics expenditure incurred by the e-tailers, through online sales channel, on Courier, Express, and Parcel (CEP) services. The scope includes (i) the supply chain of a company's online customer orders being fulfilled, (ii) the process of getting a product from the point of manufacturing to the point at which it is delivered to consumers. It involves managing inventory (deferred as well as time critical), shipping, and distribution.
- Export Trends and Import Trends - Overall logistics performance of an economy is positively and significantly (statistically) correlated to its trade performance (exports and imports). Hence, in this industry trend, total value of trade, major commodities/ commodity groups and the major trade partners, for the studied geography (country or region as per the scope of report) have been analysed alongside the impact of major trade/logistics infrastructure investments & regulatory environment.
- Financial Services (BFSI) - This end user industry segment captures the external (outsourced) logistics expenditure incurred by the BFSI players, on Courier, Express, and Parcel (CEP) services. CEP is important to the financial services industry in shipping of confidential documents and files. The establishments in this sector are engaged in (i) financial transactions (that is, transactions involving the creation, liquidation, or change in ownership of financial assets) or in facilitating financial transactions, (ii) financial intermediation, (iii) the pooling of risk by underwriting annuities and insurance, (iv) providing specialized services that facilitate or support financial intermediation, insurance and employee benefit programs, and (v) monetary control - the monetary authorities.
- Fuel Price - Fuel price spikes can cause delays and diruption for logistics service providers (LSPs), while drops in the same can result in higher short-term profitability and increased market rivalry to offer consumers with the best deals. Hence, the fuel price variations have been studied over the review period and presented along with the causes as well as market impacts.
- GDP Distribution by Economic Activity - Nominal Gross Domestic Product and distribution of the same, across major economic sectors in the geography studied (country or region as per scope of the report) have been studied and presented in this industry trend. As GDP is positively related to the profitability and growth of logistics industry, this data has been used in adjunction to the input-output tables/ supply-use tables for analyzing the potential major contributing sectors towards the logistics demand.
- GDP Growth by Economic Activity - Growth of Nominal Gross Domestic Product across major economic sectors, for the geography studied (country or region as per scope of the report) have been presented in this industry trend. This data has been utilized for assessing the growth of logistics demand from all the market end users (economic sectors considered here).
- Healthcare - This end user industry segment captures the external (outsourced) logistics expenditure incurred by the Healthcare players (Hospitals, clinics, mrdical centres) , on Courier, Express, and Parcel (CEP) services. The scope includes CEP services involved in the defrerred as well time critical movement of medical goods & supplies (surgical supplies and instruments, including gloves, masks, syringes, equipment). The establishments in this sector (i) include the ones providing medical care exclusively (ii) deliver services by trained professionals (iii) involve processes, including labor inputs of health practitioners with the requisite expertise (iv) are defined based on the educational degree held by the practitioners included in the industry.
- Inflation - Variations in both Wholesale Price Inflation (YoY change in producer price index) and Consumer Price Inflation have been presented in this industry trend. This data has been used to assess the inflationary environment as it plays a vital role in smooth functioning of the supply chain, directly impacting the logistics operational cost components e.g., pricing of tyres, driver wages & benefits, energy/fuel prices, maintenace costs, toll charges, warehousing rents, custom brokerage, forwarding rates, courier rates etc. hence impacting the overall freight and logistics market.
- Infrastructure - As infrastructure plays a vital role in an economy's logistics performance, variables like length of roads, distribution of road length by surface category (paved v/s unpaved), distribution of road length by road classification (expressways v/s highways v/s other roads), rail length, volume of containers handled by major ports and tonnage handled by major airports have been analysed and presented in this industry trend.
- International Express Service Market - International Express Service Market refers to the CEP shipments wherein the origin or destination is not within the boundary of the geography studied (country or region as per the scope of report). It captures the market size (USD) and market volume (number of parcels) of (1) the shipments/parcels/packages which are under 70kgs/ 154lbs weight, including light weight shipments, medium weight shipments and heavy weight shipments (ii) Inter-Region as well as Intra-Region Shipments
- Key Industry Trends - The report section named "Key Industry Trends" include all the key variables/parameters studied to better analyze the market size estimates and forecasts. All the trends have been presented in the form of data points (time series or latest available data points) along with analysis of the paramter in the form of concise market relevant commentary, for the geography studied (country or region as per the scope of report).
- Key Strategic Moves - The action taken by a company to differentiate from its competitor or used as a general strategy is referred to as a key strategic move (KSM). This includes (1) Agreements (2) Expansions (3) Financial Restructuring (4) Mergers and Acquisitions (5) Partnerships, and (6) Product Innovations. Key players (Logistics Service Providers, LSPs) in the market have been shortlisted, their KSM have been studied and presented in this section.
- Logistics Performance - Logistics Performance and Logistics Costs are the backbone of trade, and influences trade costs, making countries compete globally. Logistics performance is influenced by market wide adopted supply chain management strategies, government services, investments & policies, fuel/ energy costs, inflationary environment etc. Hence, in this industry trend, the logistics performance of the geography studied (country/ region as per the scope of report) has been analysed and presented over the review period.
- Manufacturing - This end user industry segment captures the external (outsourced) logistics expenditure incurred by the Manufacturing industry (including Hi-Tech/Technology) players, on Courier, Express, and Parcel (CEP) services. The end user players considered are the establishments primarily engaged in the chemical, mechanical or physical transformation of materials or substances into new products. Logistics Service Providers (LSPs) play a crucial role in maintaining a smooth flow of raw materials across the supply chain, enabling timely delivery of finished goods to distributors or end customers and storing & supplying the raw materials to clients for just-in-time manufacturing.
- Other End Users - Other end user segment captures the external (outsourced) logistics expenditure incurred by the construction, real estate, educational services, and professional services (administrative, waste management, legal, architectural, engineering, design, consulting, scientific R&D), on Courier, Express, and Parcel (CEP) services. Logistics Service Providers (LSPs) plays a crucial role in the reliable movement of time critical supplies and documents to/from these industries such as transporting any equipment or resources required, shipping confidential documents and files.
- Primary Industry - This end user industry segment captures the external (outsourced) logistics expenditure incurred by the AFF (Agriculture, Fishing, and Forestry) and Extraction indsutry (Oil &Gas, Quarrying and Mining) players, on Courier, Express, and Parcel (CEP) services. The end user players considered are the establishments (i) primarily engaged in growing crops, raising animals, harvesting timber, harvesting fish & other animals from their natural habitats and providing related support activities; (ii) that extract naturally occurring mineral solids, such as coal and ores; liquid minerals, such as crude petroleum; and gases, such as natural gas. Herein, Logistics Service Providers (LSPs) (i) play a crucial role in acquisition, storage, handling, transportation, and distribution activities for the optimal & continuous flow of inputs (seeds, pesticides, fertilizers, equipment, and water) from manufacturers or suppliers to the producers and smooth flow of output (produce, agro-goods) to distributors/ consumers; (ii) cover entire phases from upstream to downstream and play a crucial role in the transportation of machinery, drilling equipments, extracted minerals, crude oil & natural gas and refined/ processed products from one place to another. This includes both termperature controlled and non-temperature controlled logistics, as and when required according to the shelf life of goods being transported or stored.
- Producer Price Inflation - It indicates inflation from viewpoint of the producers viz. the average selling price received for their output over a period of time. Annual change (YoY) of producer price index is reported as wholesale price inflation in the "Inflation" industry trend. As WPI captures dynamic price movements in most comprehensive way, it is widely used by governments, banks, industry, business circles and is deemed important in formulation of trade, fiscal and other economic policies. The data has been used in adjunction to consumer price inflation for better understanding the inflationary environment.
- Segmental Revenue - Segmental Revenue has been triangulated or computed and presented for all the major players in the market. It refers to the courier, express, and parcel (CEP) market specific revenue earned by the company, over the base year of study, in the geography studied (country or region as per the scope of report). It is computed through the study and analysis of major parameters like financials, service portfolio, employee strength, fleet size, investments, number of countries present in, major economies of concern, etc. that have been reported by the company in its annual reports, webpage. For companies having scarce financial disclosures, paid databases like D&B Hoovers, Dow Jones Factiva have been resorted to and verified through industry/expert interactions.
- Transport and Storage Sector GDP - Value and growth of Transport and Storage Sector GDP has a direct relation to the freight and logistics market size. Hence, this variable has been studied and presented over the review period, in value terms (USD) and as share % of total GDP, in this industry trend. The data has been supported by concise and relevant commentary around the investments, developments, and current market scenario.
- Trends in E-Commerce Industry - Enhanced internet connectivity and boom in smartphone penetration, coupled with increasing disposable incomes, has led to a phenomenal growth in the e-commerce market globally. Online shoppers require fast and efficient delivery of their orders leading to an increase in the demand for logistics services especially e-commerce fulfilment services. Hence, the Gross Merchandise Value (GMV), historial and projected growth, breakup of major commodity groups in e-commerce industry for the studied geography (country or region as per scope of the report) have been analysed and presented in this industry trend.
- Trends in Manufacturing Industry - Manufacturing industry involves the transformation of raw materials into finished products, while logistics industry ensures the efficient flow of raw materials to the factory, and the transport of manufactured products to the distributors & consumers. Demand-Supply of both industries are highly cross-linked and critical for a seamless supply chain. Hence, the Gross Value Added (GVA), breakup of GVA into major manufacturing sectors, and growth of manufacturing industry over the review period have been analysed and presented, in this industry trend.
- Wholesale and Retail Trade (Offline) - This end user industry segment captures the external (outsourced) logistics expenditure incurred by the wholesalers and retailers, through offline sales channel, on Courier, Express, and Parcel (CEP) services. The end user players considered are the establishments primarily engaged in wholesaling or retailing merchandise, generally without transformation, and rendering services incidental to the sale of merchandise. Logistics Service Providers (LSPs) plays a crucial role in the reliable movement of supplies to and finished products from production houses to the distributors and finally to the end customer covering activites like material sourcing, transportation, order fulfillment, warehousing & storage, demand forecasting, inventory management etc.
| Keyword | Definition |
|---|---|
| Axle Load | The axle load refers to the total load (weight) bearing on the roadway through wheels connected to a given axle. Across the globe, there are systems in place to ensure axle load monitoring, wherein surpassing the defined limits set by the concerned regulatory authority can lead to penalty/fine. For transportation of goods via road this can be an important determinant of costs as knowledge about the axle load limits can be used to (i) load the vehicle optimally for maximizing profits (ii) avoid exceeding the same and hence the probable fines associated (iii) avoid wear and tear of the vehicle (iv) avoid damage to pavement resulting in noticeable public maintenance and repair costs (v) achieve better turnaround time. |
| Back Haul | Backhaul is the return movement of a transport vehicle from its original destination to its original point of departure, and can include full, partial, or empty truck loads (all or part of the way) depending on the visibility of the local freight ecosystem. In this regard, transportation of empty containers to the point of origin, known as deadheading is also a significant factor, considering the supply/container shortages across the geographies, resulting in cost escalation and under optimized profit potential attainment. Generally, the carriers offer discounts on the backhaul, to secure freight for the trip. |
| Bill of Lading (BOL) | A bill of lading is a legal contract document issued by a carrier to a shipper to acknowledge reception of their cargo, and is evidence for the contract of carriage between the two parties. Broadly it details the (i) type, quantity, and other specifications of the goods being carried (ii) destination, and terms & conditions of the shipment (iii) carrier and drivers with all the necessary information to process the shipment, which can be used for insurance and customs clearance purposes (iv) assurance that the consignment is damage-free and ready to be shipped to the consignee. In this regard, a house bill of lading (HBL) is a document issued by a freight forwarder or a non-vessel operating common carrier (NVOCC) to acknowledge receipt of items for shipment (to a shipper). If shipments from several shippers are involved a master bill of lading (MBL) might be involved which is a consolidated version of the same for all the shipments being taken care of by the carrier (to a common destination) and might be issued by the carrier to the freight forwarder or the shipper (depending on who books the transport). |
| Bunkering | Bunkering is the process of supplying fuel to power the propulsion system of a ship. It includes the logistics of loading and distributing the fuel among available shipboard tanks. In this regard, (i) Bunker fuel is technically any type of fuel oil used aboard ships. It gets its name from the containers on ships and in ports that it is stored in; in the days of steam they were coal bunkers but now they are bunker-fuel tanks, (ii) Bunker refers to the spaces (Tank) on board a vessel to store fuel, (iii) Bunker trader refers to a person dealing in trade of bunker (fuel), (iv) Bunker call is made when a cargo ship anchors or berths in a port to take on bunker oil or supplies, (v) Bunkering service is the supply of a requested quality and quantity of bunkers to a ship. Bunkering is signficant from point of view of freight rates applicable to the shipper as Bunker Contribution (BUC)/ Fuel Adjustment Factor (FAF)/ Bunker Adjustment Factor (BAF) are applied by shipping lines to offset the effect of fluctuations in the cost of bunkers. |
| Cabotage | Transport by a vehicle registered in a country, performed on the national territory of another country. Cabotage law may restrict domestic cargo traffic to be carried in its own nationally registered, and sometimes built and crewed vehicles, though regulations vary across industries/commodity groups/countries and sometimes specify maximum allowable percentage of cabotage that can be serviced by foreign registered fleet. |
| C-commerce | Collaborative commerce (also known as C-commerce), (i) describes electronically enabled business interactions among an enterprise’s internal personnel, business partners and customers throughout a trading community (industry, industry segment, supply chain or supply chain segment); (ii) is the optimization of supply and distribution channels to capitalize on the global economy by using new technology efficiently. Advantages of C-commerce, to detail few include (i) maximization of organization's efficiency and profitability (ii) technology integration with physical channels to allow companies to work together (iii) increased information exchange such as inventory and product specifications, using the web as an intermediary (iv) increased competitiveness by reaching a broader audience. Examples of C-commerce, also known as peer-to-peer commerce, include (i) companies that allow consumers to rent things from each other, or marketplaces, such as Meta (formerly Facebook) Marketplace, that allow the sale of used goods; (ii) DoorDash teamed up with many national brands, such as McDonald’s and Chipotle, to offer fast food delivery, building their business model on c-commerce. They have since expanded their delivery service from restaurants to retailers and even offer 'fleets' of drivers to businesses. |
| Courier | A business/company that delivers packages/parcels/shipments (upto 70 kgs) including quick door to door pickup and delivery service for goods or documents, domestically or internationally, on a commercial contract basis. Example, DHL Group, FedEx, United Parcel Service of America, Inc., USPS, International Distributions Services, J&T Express, SF Express among several others |
| Cross docking | Cross docking is a practice in logistics management that includes unloading incoming delivery vehicles and loading the materials directly into outbound delivery vehicles, omitting traditional warehouse logistical practices and saving time and money. It requires close synchronization of both inbound and outbound movements. It is highly significant in reduction of costs pertaining to warehousing & storage (and the associated Value Added Services). |
| Cross Trade | International transport between two different countries performed by a vehicle registered in a third country. A third country is a country other than the country of loading/embarkation and the country of unloading/disembarkation. Cross Trade law may restrict international cargo traffic to be carried by respective country's registered vehicles, and sometimes built and crewed vehicles, though regulations vary across industries/commodity groups/countries and sometimes specify maximum allowable percentage of cross trade that can be serviced by foreign registered fleet. |
| Customs Clearance | The process of declaring and clearing cargoes through customs. It includes the procedures involved in getting cargo released by Customs through designated formalities such as presenting import license/permit, payment of import duties and other required documentations by the nature of the cargo. In this regard, a customs broker is a person or company licensed by the respective department of the country to act on behalf of freight importers and exporters. |
| Dangerous Goods | Dangerous goods (or hazardous materials or HAZMAT) include flammable liquids/solids, gases (compressed, liquified, dissolved under pressure), corrosives, oxidising substances, explosive substances and articles, substances which on contact with water emit flammable gasses, organic peroxides, toxic substances, infectious substances, radioactive materials, miscellaneous dangerous goods and articles. |
| First mile Delivery | First mile delivery refers to the (i) first stage of the freight/shipment/cargo/courier transportation (ii) the transportation of goods from a merchant’s premises or warehouse to the next fulfillment centre/warehouse/hub from where the goods are forwarded (iii) shipping goods from local distribution centers to stores (For retailers) (iv) transportation of finished goods from a plant or a factory to a distribution center (For manufacturers), (v) pick up of goods from the end-customer’s home or store followed by movement to a warehouse or storage location (movers and packers), (vi) process where goods are picked up from a retailer and then transferred to third-party logistics providers or courier service providers to be delivered to the end-consumer (e-commerce). Once the package reaches the next warehouse or the courier’s hub, it is then sorted and transported further until it reaches the customer’s doorstep. Example, if one chooses UPS as a courier, first-mile delivery will be the product being delivered from manufacturer's/retailer's warehouse to the UPS’s warehouse/ fulfilment centre. |
| Last Mile Delivery | Last mile delivery refers to the very last step of the delivery process when a parcel is moved from a transportation hub (warehouse or a distribution center or fulfillment centre) to its final destination, which usually is a personal residence/retail store/ business, or parcel locker. It accounts for around half of the total cost involved in entire process of first mile, middle mile, and last mile delivery, though it can vary shipment to shipment, based on commodity, business model and similar factors. |
| Milkrun | A Milk Run is a delivery method used to transport mixed loads from various suppliers to one customer, using lean management principles applied to logistics. Instead of each supplier sending a truck every week to meet the needs of one customer, one truck (or vehicle) visits the suppliers to pick up the loads for that customer. This method of transport got its name from the dairy industry practice, where one tanker used to collect milk from several dairy farms for delivery to a milk processing company. A milk run can be a more efficient way to handle logistics but require proper planning. If the route involves products from different companies, there is need for an agreement about cost-sharing and other aspects of the cooperative delivery arrangement. Once the group settles these issues, this delivery method can save time and money for everyone by pooling operation costs and resources. |
| Multi country consolidation | Multi-Country Consolidation (MCC) is a cost-effective solution that consolidates one's cargo from different countries of origin to build Full Container Loads (FCL). MCC is most suitable for companies that import light volumes of goods from multiple countries but want to take advantage of the more economic FCL freight rates. Apart from costing some of the other advantages include (i) flexibility to choose suppliers from a wider range of origin countries without worrying about the logistics to final destination from each origin, (ii) ability to pick the most suitable suppliers from many different countries for one's business operations. The increase in one's sourcing options by MCC provides the kind of flexibility needed in competitive global markets. |
| Q-commerce | Q-commerce, also referred to as quick commerce, is a type of e-commerce where emphasis is on quick deliveries, typically in less than an hour. The companies providing Q-Commerce services might have vertically intergrated model or might be using third party delivery platforms (outsourced logistics). It has advantages like (i) competitve USP, (ii) potential to earn greater profit margins, (iii) better customer experience, (iv) guaranteed availability of products, (v) traceability, and (vi) scaleability. |
| ReverseLogistics | Reverse logistics is a type of supply chain management that moves goods from customers back to the sellers or manufacturers and may involve ciruclar economy principles (3Rs) viz. recycling, reuse (repurposing, reselling), reducing or repairing. In this regard, reverse commerce (or Recommerce) is the selling of previously owned items through physical or online marketplaces/distribution channels to buyers who reuse, recycle or resell them. |


Research Methodology
Mordor Intelligence follows a four-step methodology in all our reports.
- Step-1: Identify Key Variables: In order to build a robust forecasting methodology, the variables and factors identified in Step-1 are tested against available historical market numbers. Through an iterative process, the variables required for market forecast are set and the model is built on the basis of these variables.
- Step-2: Build a Market Model: Market-size estimations for the forecast years are in nominal terms. Inflation is considered to be a part of the pricing, and the average selling price (ASP) is varying throughout the forecast period for each country
- Step-3: Validate and Finalize: In this important step, all market numbers, variables and analyst calls are validated through an extensive network of primary research experts from the market studied. The respondents are selected across levels and functions to generate a holistic picture of the market studied.
- Step-4: Research Outputs: Syndicated Reports, Custom Consulting Assignments, Databases & Subscription Platforms


