Cell Dissociation Market Size and Share
Market Overview
| Study Period | 2020 - 2031 |
|---|---|
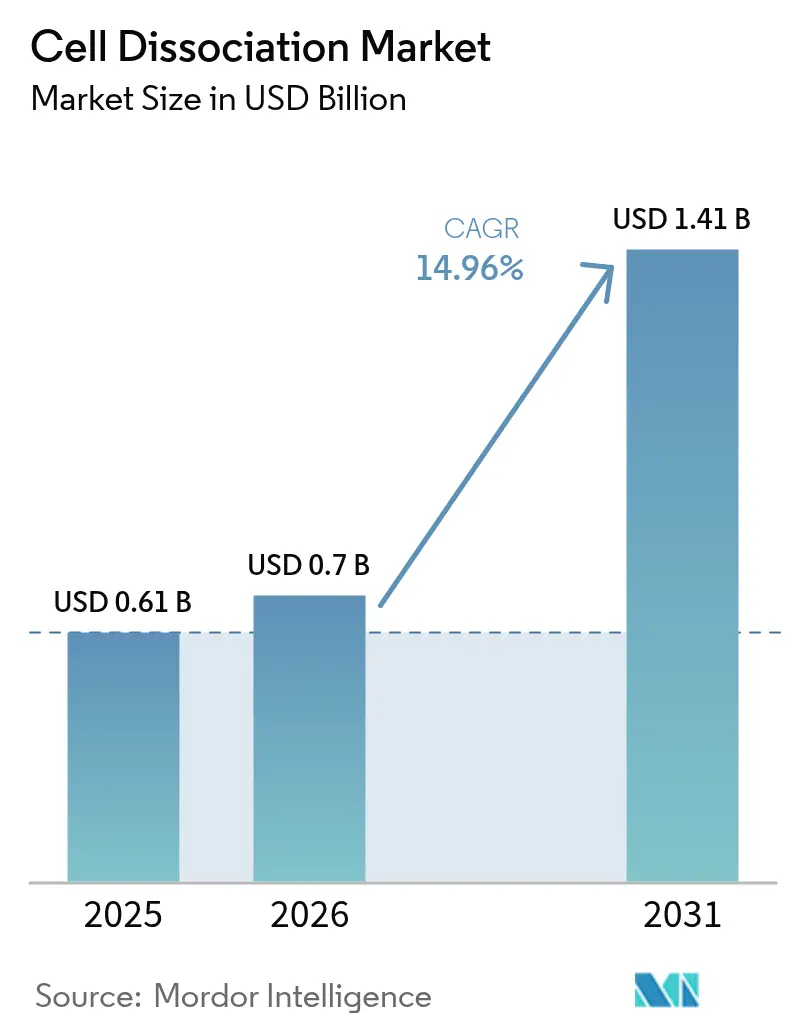
| Market Size (2026) | USD 0.7 Billion |
| Market Size (2031) | USD 1.41 Billion |
| Growth Rate (2026 - 2031) | 14.96% CAGR |
| Fastest Growing Market | Asia Pacific |
| Largest Market | North America |
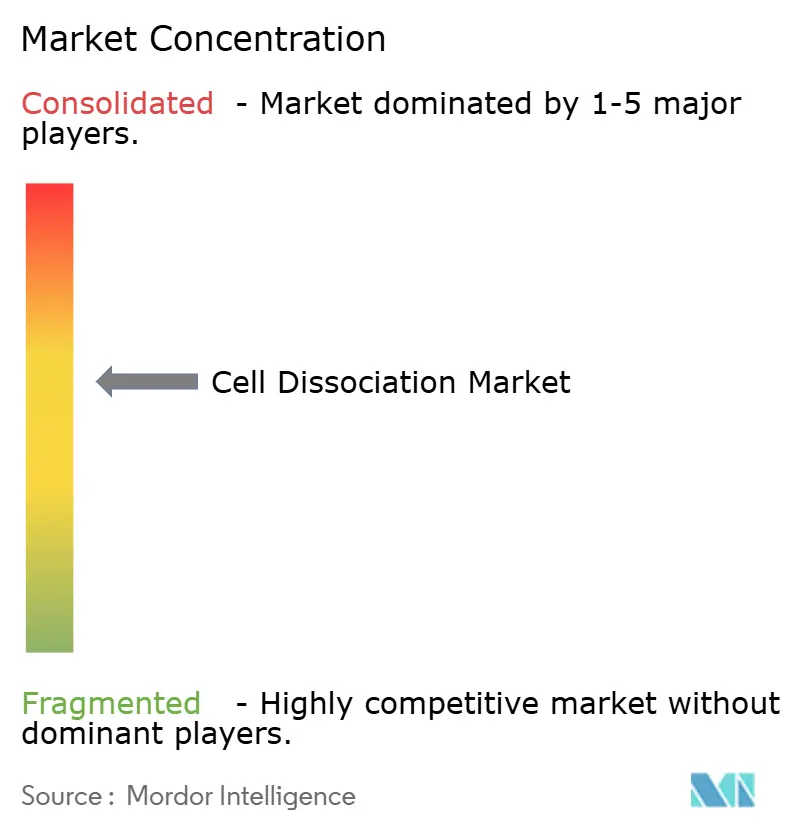
| Market Concentration | Medium |
Major Players *Disclaimer: Major Players sorted in no particular order Image © Mordor Intelligence. Reuse requires attribution under CC BY 4.0. | |
Cell Dissociation Market Analysis by Mordor Intelligence
The cell dissociation market size was valued at USD 0.61 billion in 2025 and estimated to grow from USD 0.7 billion in 2026 to reach USD 1.41 billion by 2031, at a CAGR of 14.96% during the forecast period (2026-2031). The market’s ascent is tied to its enabling role in cell and gene therapy production, single-cell omics, and personalized-medicine pipelines. Regulatory approvals for advanced therapies, automation breakthroughs, and large-scale public biotechnology funding collectively accelerate adoption. Pharmaceutical and biotechnology firms remain the primary purchasers, yet contract research organizations (CROs) capture rising share as sponsors outsource complex tasks. North America keeps the lead owing to established infrastructure, while Asia-Pacific posts the fastest growth backed by multibillion-dollar national programs in China, Japan, and India.
Key Report Takeaways
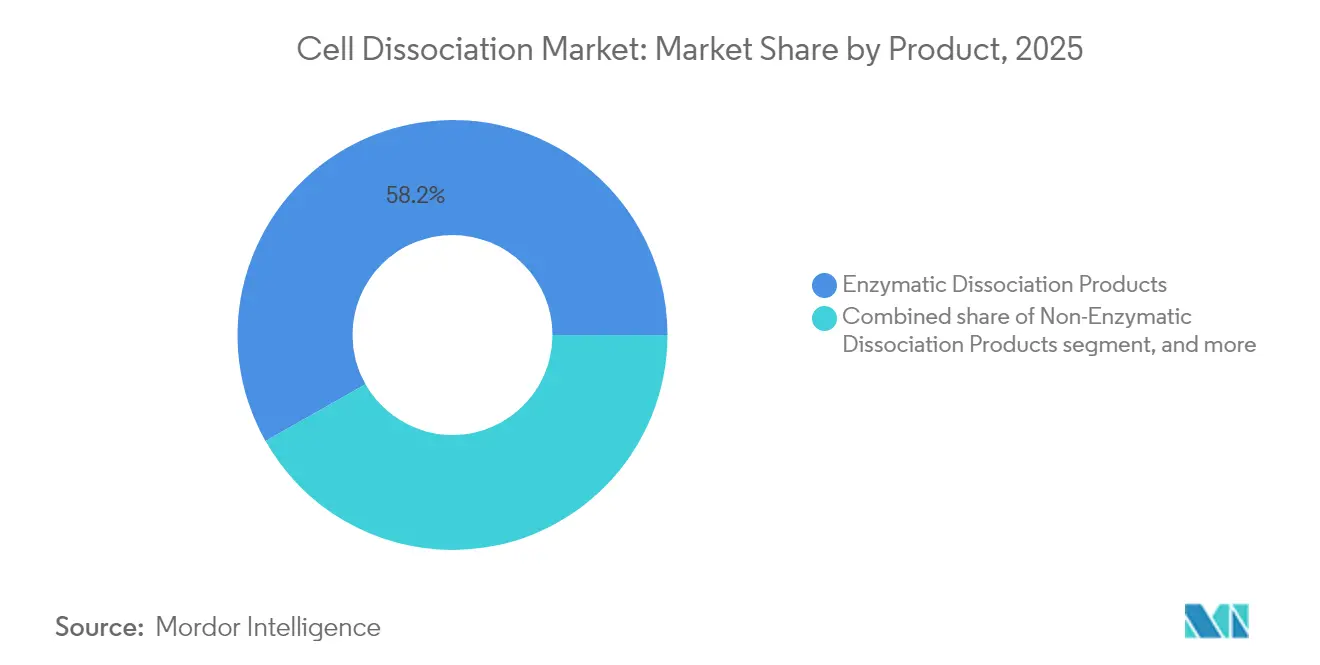
- By product category, enzymatic reagents led with 58.21% of cell dissociation market share in 2025, whereas non-enzymatic products are projected to expand at 17.08% CAGR through 2031.
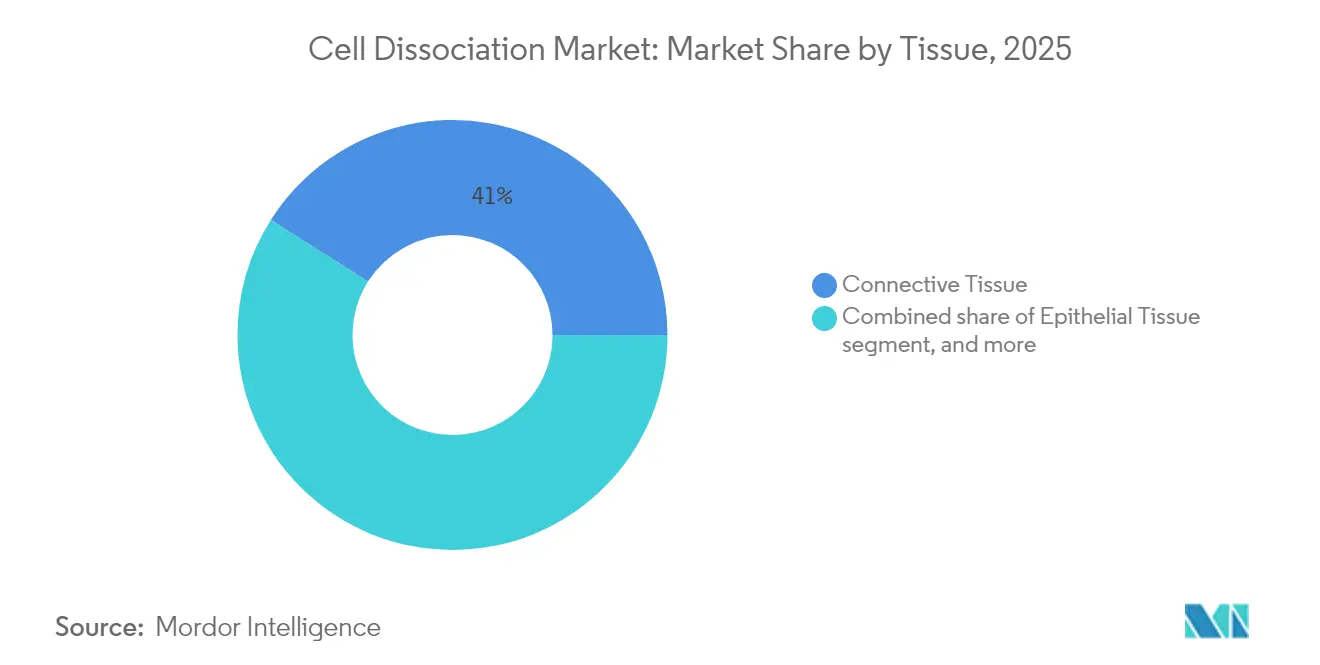
- By tissue type, connective tissue commanded 41.02% of cell dissociation market size in 2025; tumor and organoid applications advance at 17.32% CAGR to 2031.
- By end-user, pharmaceutical and biotechnology companies held 46.18% of cell dissociation market size in 2025, while CROs register the highest 17.85% CAGR through 2031.
- By geography, North America accounted for 38.32% of cell dissociation market share in 2025, whereas Asia-Pacific is forecast to post a 16.21% CAGR between 2026-2031.
Note: Market size and forecast figures in this report are generated using Mordor Intelligence’s proprietary estimation framework, updated with the latest available data and insights as of 2026.
Global Cell Dissociation Market Trends and Insights
Driver Impact Analysis*
| Driver | % Impact on CAGR Forecast | Geographic Relevance | Impact Timeline |
|---|---|---|---|
| Expansion of cell and gene therapy pipelines | +3.2% | North America & Europe | Medium term (2-4 years) |
| Rising adoption of single-cell omics technologies | +2.8% | North America & Asia-Pacific | Short term (≤2 years) |
| Surge in biomanufacturing for personalized medicine | +2.1% | North America & EU | Long term (≥4 years) |
| Growing investments in regenerative medicine research | +1.9% | Global with APAC acceleration | Medium term (2-4 years) |
| Increasing demand for high-throughput automation | +1.7% | North America & EU | Short term (≤2 years) |
| Government initiatives to strengthen biotechnology infrastructure | +1.5% | Asia-Pacific & Middle East-Africa | Long term (≥4 years) |
| Source: Mordor Intelligence | |||
Expansion of Cell and Gene Therapy Pipelines
Seven cell and gene therapies secured FDA approval in 2024, and the agency expects 10-20 clearances annually through 2025[1]International Society for Cell & Gene Therapy, “Cell and Gene Therapy Approvals 2024,” isctglobal.org. Each product requires sophisticated cell-isolation protocols, elevating demand for automated dissociation platforms that can cut lot-release costs by 50%. Solid-tumor and autoimmune programs diversify tissue inputs, intensifying reagent-quality and scalability requirements. Allogeneic formats further raise batch volumes per donor, underscoring the need for standardized, GMP-grade workflow.
Rising Adoption of Single-Cell Omics Technologies
Microfluidic chips now process upward of 100,000 cells per run, a step-change from prior capacities. To preserve RNA integrity, new FixNCut protocols enable reversible tissue fixation before dissociation, easing sample transport without data loss. Oncology applications dominate demand as heterogeneity studies rely on high-viability single-cell suspensions. AI-augmented pipelines intensify the push for standardized protocols that minimize variability.
Surge in Biomanufacturing for Personalized Medicine
Patient-derived organoids reach a 62% establishment success rate and predict effective therapies in 91% of pancreatic-cancer cases. Hospitals pursuing point-of-care manufacturing seek compact, closed-system dissociators fit for Grade C cleanrooms. FDA guidance on animal-derived materials heightens scrutiny of reagent provenance, steering buyers toward well-documented suppliers.
Increasing Demand for High-Throughput Automation
Surface-acoustic-wave devices yield label-free, high-compatibility micromixing that preserves fragile cells. Sartorius’ CellCelector Flex integrates imaging and gentle dissociation to accelerate clone selection for GMP lines. BD and Biosero have robot-ready flow cytometers that streamline screening workflows.
Restraints Impact Analysis*
| Restraints Impact Analysis | (~) % Impact on CAGR Forecast | Geographic Relevance | Impact Timeline |
|---|---|---|---|
| High cost of advanced dissociation technologies | -2.1% | Global, stronger in emerging markets | Medium term (2-4 years) |
| Variability and standardization challenges | -1.8% | Global, impacts scalable manufacturing | Short term (≤2 years) |
| Stringent regulatory and validation requirements | -1.6% | North America, EU & high-regulation markets | Medium term (2-4 years) |
| Limited availability of GMP-grade enzymes | -1.5% | Global, acute in Asia-Pacific & Latin America | Short term (≤2 years) |
| Source: Mordor Intelligence | |||
High Cost of Advanced Dissociation Technologies
Closed, fully automated suites frequently exceed USD 1 million, limiting adoption among smaller labs. The global pancreatic-enzyme shortage further inflates raw-material costs and delivery times. China’s CAR-T landscape shows how high production costs can shift most payments out-of-pocket.
Variability and Standardization Challenges
Donor-derived variability complicates automation, demanding custom protocols that resist harmonization. The European Pharmacopoeia Commission’s new monograph sets stricter QC for cell-based products, yet cross-application compliance remains complex. Transitioning manual steps to robots requires extensive bridging studies that slow time-to-market.
*Our forecasts treat driver/restraint impacts as directional, not additive. The impact forecasts reflect baseline growth, mix effects, and variable interactions.
Segment Analysis
By Product: Non-Enzymatic Solutions Drive Innovation
Enzymatic reagents retained 58.21% share in 2025, with bacterial collagenase from Clostridium histolyticum prized for specificity. Trypsin dominates routine passaging, while dispase and elastase service niche applications. Non-enzymatic formulations post the fastest 17.08% CAGR as single-cell workflows shy away from protease exposure. ATCC’s chelator-based solution and recombinant TrypLE exemplify this regulatory-friendly shift. Automated tissue dissociators now come bundled with reagent cartridges to minimize operator variability.


By Tissue: Tumor Applications Lead Growth
Connective tissue captured 41.02% of market share in 2025 thanks to well-standardized collagenase protocols across liver and lung studies. Tumor and organoid samples log the highest 17.32% CAGR, with electric-field-assisted workflows achieving 95% tissue dissociation in under five minutes while maintaining viability. Mouse mammary tumor methods now reach 90% viable cell recovery for single-cell transcriptomic analysis.
By End-User: CROs Experience Rapid Expansion
Pharmaceutical and biotech firms retained 46.18% market share in 2025 but CROs rise fastest at 17.85% CAGR thanks to capacity constraints at large sponsors. Contract manufacturing held 67.13% of the USD 9.95 billion 2023 cell-and-gene-therapy production market, highlighting outsourcing momentum. Charles River’s acquisition of Cognate BioServices typifies vertical integration of development and GMP supply.
Geography Analysis
North America held 38.32% of market share in 2025, buoyed by FDA fast-track pathways for advanced therapies. New York’s USD 430 million BioGenesis Park adds 1,530 jobs and new GMP suites. Canada’s USD 22.5 million investment in STEMCELL Technologies ensures domestic reagent capacity. Sartorius and Siemens collaborate on digital-twin automation that trims lot-release time.
Asia-Pacific advances at 16.21% CAGR, led by China’s USD 4.17 billion biopark program. Japan’s Startup Development Five-Year Plan and aging-society needs push biotech growth toward ¥15 trillion by 2030. India’s BioE3 policy aims to position local CDMOs as global suppliers in anticipation of supply-chain diversification from U.S. Biosecure Act compliance.
Europe benefits from the EU biotechnology strategy targeting greater participation in the EUR 720 billion global market. EMA guidelines for cell-based products and new European Pharmacopoeia QC chapters provide regulatory clarity. Lonza’s Dutch plant produces CASGEVY for Vertex, underscoring Europe’s relevance as a high-volume contract-manufacturing hub.


Competitive Landscape
Thermo Fisher Scientific dominates through broad reagent lines and plans USD 40-50 billion in acquisitions targeting complementary technologies. BD will spin off its Biosciences and Diagnostics arm into a USD 3.4 billion life-science tools specialist to sharpen focus on growth areas. Sartorius’ CellCelector Flex and Siemens’ digital-twin automation deliver end-to-end solutions that minimize labor and increase consistency. Miltenyi Biotec leverages MACS technology to enable point-of-care manufacturing at hospital sites. Enzyme suppliers lock in long-term contracts to hedge against shortages, while microfluidic start-ups launch chip-based dissociators aimed at single-cell labs.
Cell Dissociation Industry Leaders
Thermo Fisher Scientific, Inc.
Becton, Dickinson And Company
Merck KGaA
Miltenyi Biotec
STEMCELL Technologies
- *Disclaimer: Major Players sorted in no particular order

Recent Industry Developments
- June 2025: Thermo Fisher unveiled Orbitrap Astral Zoom and Excedion Pro mass spectrometers at ASMS 2025.
- May 2025: BD introduced the FACSDiscover A8 Cell Analyzer with real-time imaging and spectral flow capabilities.
- May 2025: Sartorius launched the Octet R8e biolayer interferometer for rapid, label-free binding analysis.
- April 2025: Thermo Fisher released the 5 L DynaDrive single-use bioreactor, boosting cell-culture productivity by 27%.
- February 2025: Aurora Biosynthetics debuted in Asia-Pacific via an AU$200 million RNA-manufacturing alliance.


Research Methodology Framework and Report Scope
Market Definitions and Key Coverage
Our study defines the cell dissociation market as all commercially packaged enzymatic and non-enzymatic reagents, plus purpose-built instruments, that detach or disaggregate viable cells from primary tissues or adherent cultures for research, bioprocess, and diagnostic workflows. The valuation tracks spending that flows through supplier catalogs and institutional procurement, not lab-made buffers or generic labware.
Scope exclusion: Single-cell analysis hardware and basal culture media lie outside scope unless bundled with dissociation kits.
Segmentation Overview
- By Product
- Enzymatic Dissociation Products
- Collagenase
- Trypsin
- Papain
- Dispase
- Elastase & Hyaluronidase
- Non-Enzymatic Dissociation Products
- Chelating Agents
- Recombinant Enzyme-Free Solutions (Accutase, TrypLE)
- Mechanical Dissociation Kits & Filters
- Instruments & Accessories
- Automated Tissue Dissociators
- Microfluidic Dissociation Devices
- Cell Strainers & Filtration Units
- Consumable Accessories (Tubes, Rotors)
- Enzymatic Dissociation Products
- By Tissue
- Connective Tissue
- Epithelial Tissue
- Muscular Tissue
- Nervous Tissue
- Tumor & Organoid Samples
- By End-User
- Pharmaceutical & Biotechnology Companies
- Research & Academic Institutes
- Contract Research Organizations
- Hospitals & Diagnostic Laboratories
- Other End-Users
- Geography
- North America
- United States
- Canada
- Mexico
- Europe
- Germany
- United Kingdom
- France
- Italy
- Spain
- Rest of Europe
- Asia-Pacific
- China
- Japan
- India
- Australia
- South Korea
- Rest of Asia-Pacific
- Middle East & Africa
- GCC
- South Africa
- Rest of Middle East & Africa
- South America
- Brazil
- Argentina
- Rest of South America
- North America
Detailed Research Methodology and Data Validation
Desk Research
We began by mapping demand with open sources such as NIH RePORTER grant logs, FDA 510(k) listings, Eurostat HS 382219 trade data, PubMed clinical-trial counts, and World Bank R&D spend. Company 10-Ks, investor decks, large tenders, and reputable press widened the evidence base. Paywalled lenses from D&B Hoovers and Dow Jones Factiva helped us reconcile supplier revenues and shipment footprints. Many other public and subscription sources were also consulted to double-check facts.
A follow-up sweep normalized historic prices and currencies so regional series aligned before modeling.
Primary Research
Structured interviews and short surveys with bench scientists, purchasing managers, and regional distributors in North America, Europe, and Asia-Pacific clarified vial sizes, monthly run rates, and discount ranges, allowing Mordor analysts to close gaps that documents alone could not.
Market-Sizing & Forecasting
According to Mordor Intelligence, the model starts with a top-down reconstruction of global spending that fuses HS trade flows, disclosed supplier revenues, and active oncology trial volumes. Results are then tested with selective bottom-up checks, average selling price multiplied by lab throughput from interviews, to fine-tune totals. Key variables such as enzyme-to-chelator penetration, single-cell omics uptake, trial starts, bioprocess batch size, and reagent price inflation drive annual shifts. A multivariate regression, backed by scenario analysis, extends the outlook to 2030 while channel coefficients bridge small private-vendor gaps.
Data Validation & Update Cycle
Outputs pass variance and plausibility screens, two-level peer review, and re-contact triggers where anomalies persist. Reports refresh yearly; material events prompt interim updates, and an analyst reruns core metrics just before delivery.
Why Our Cell Dissociation Baseline Earns Trust
Published estimates often diverge because each publisher selects its own product basket, geography mix, and growth levers. Common gap drivers include lumping single-cell prep consumables into totals, aggressive multipliers tied to cell-therapy optimism, and refresh cycles that miss recent reagent price normalization.
Benchmark comparison
| Market Size | Anonymized source | Primary gap driver |
|---|---|---|
| USD 0.61 B (2025) | Mordor Intelligence | - |
| USD 0.355 B (2023) | Global Consultancy A | Excludes instruments, uses 2022 currency base |
| USD 0.462 B (2025) | Trade Journal B | Relies on shipment surveys only, limited geography |
| USD 0.282 B (2021) | Industry Association C | Conservative trial count, no price-inflation factor |
The comparison shows that Mordor's disciplined scope selection, annual refresh, and dual validation give decision-makers a balanced, transparent baseline that can be traced to observable variables and repeatable steps.


Key Questions Answered in the Report
How large is the cell dissociation market in 2026 and what is its growth outlook?
The cell dissociation market is valued at USD 0.7 billion in 2026 and is projected to reach USD 1.41 billion by 2031, advancing at a 14.96% CAGR during the forecast period (2026-2031).
Which product category leads the cell dissociation market?
Enzymatic reagents lead, accounting for 58.21% of cell dissociation market share in 2025, largely due to their well-established efficacy in a wide range of tissues.
What is driving the rapid growth of non-enzymatic dissociation solutions?
Non-enzymatic products grow at a 17.08% CAGR because single-cell omics and immunophenotyping workflows demand gentler methods that preserve surface markers and gene-expression fidelity.
Why are CROs emerging as the fastest-growing end-user segment?
CROs post an 17.85% CAGR as pharmaceutical companies outsource complex cell-therapy process development and manufacturing to specialized partners with dedicated capacity.
Which region shows the highest growth, and why?
Asia-Pacific demonstrates the fastest 16.21% CAGR through 2031, supported by multi-billion-dollar government investments, expanding clinical trial pipelines, and cost-advantaged manufacturing infrastructure.
What are the main restraints that could slow market expansion?
High capital costs for advanced automation and the challenge of standardizing protocols across variable tissue sources can shave up to 2.1% and 1.8% off the forecast CAGR, respectively.
Page last updated on:


