
Live Cell Encapsulation Market Size and Share
Market Overview
| Study Period | 2020 - 2031 |
|---|---|
| Market Size (2026) | USD 244.64 Million |
| Market Size (2031) | USD 292.48 Million |
| Growth Rate (2026 - 2031) | 3.64 % |
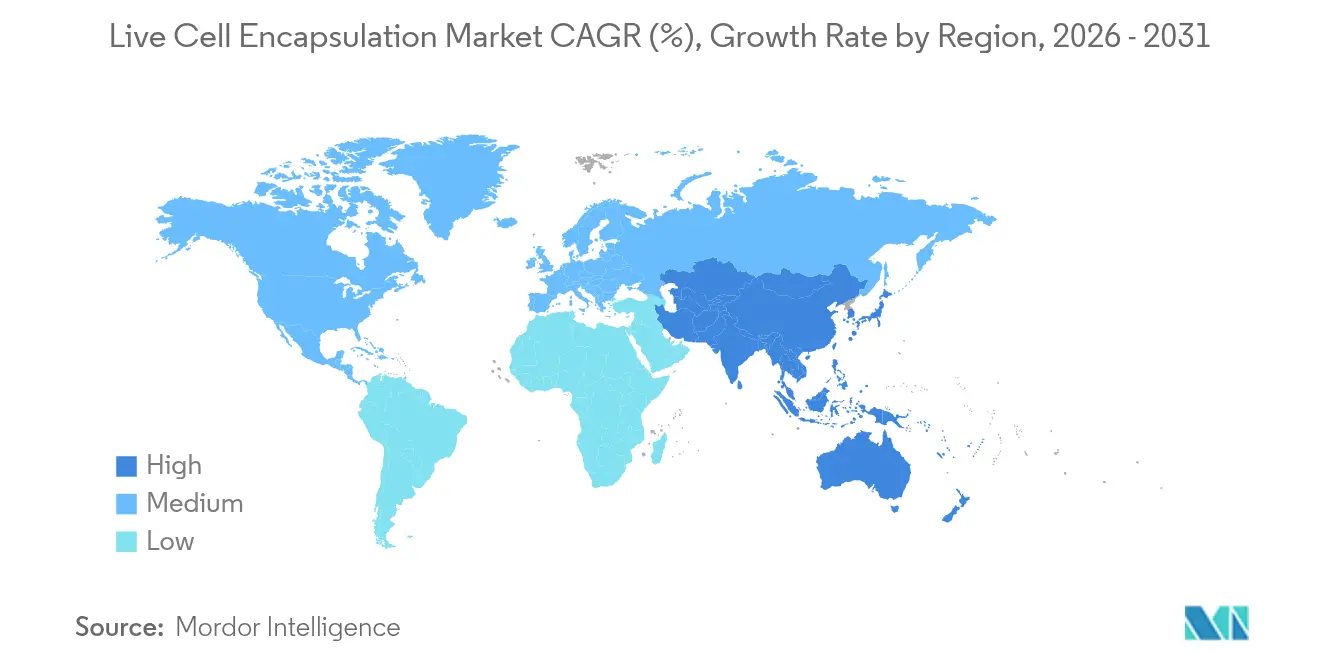
| Fastest Growing Market | Asia Pacific |
| Largest Market | North America |
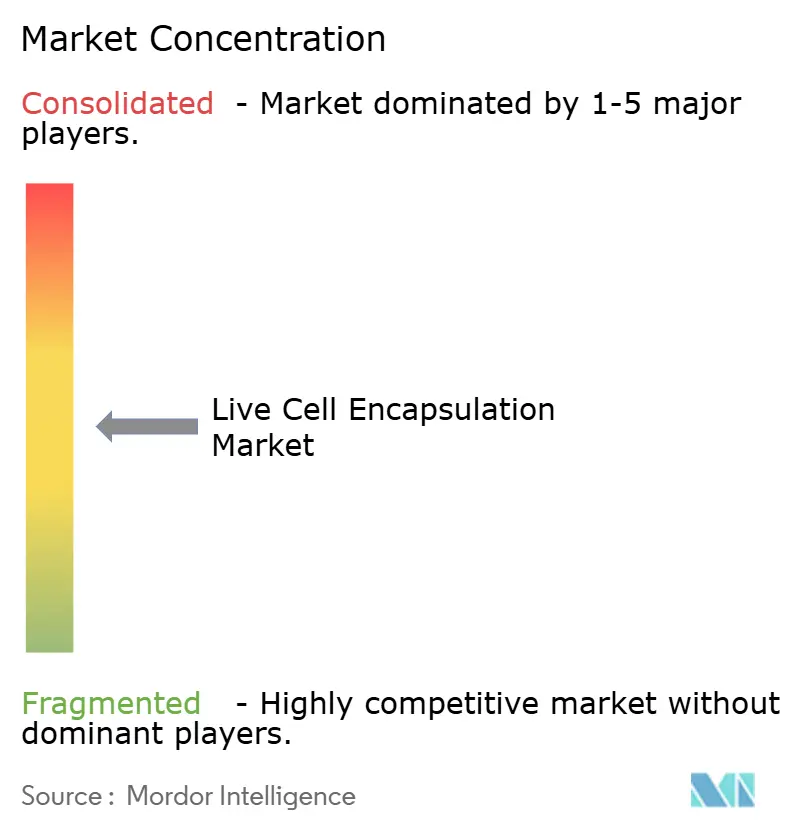
| Market Concentration | Medium |
Major Players *Disclaimer: Major Players sorted in no particular order Image © Mordor Intelligence. Reuse requires attribution under CC BY 4.0. | |
Live Cell Encapsulation Market Analysis by Mordor Intelligence
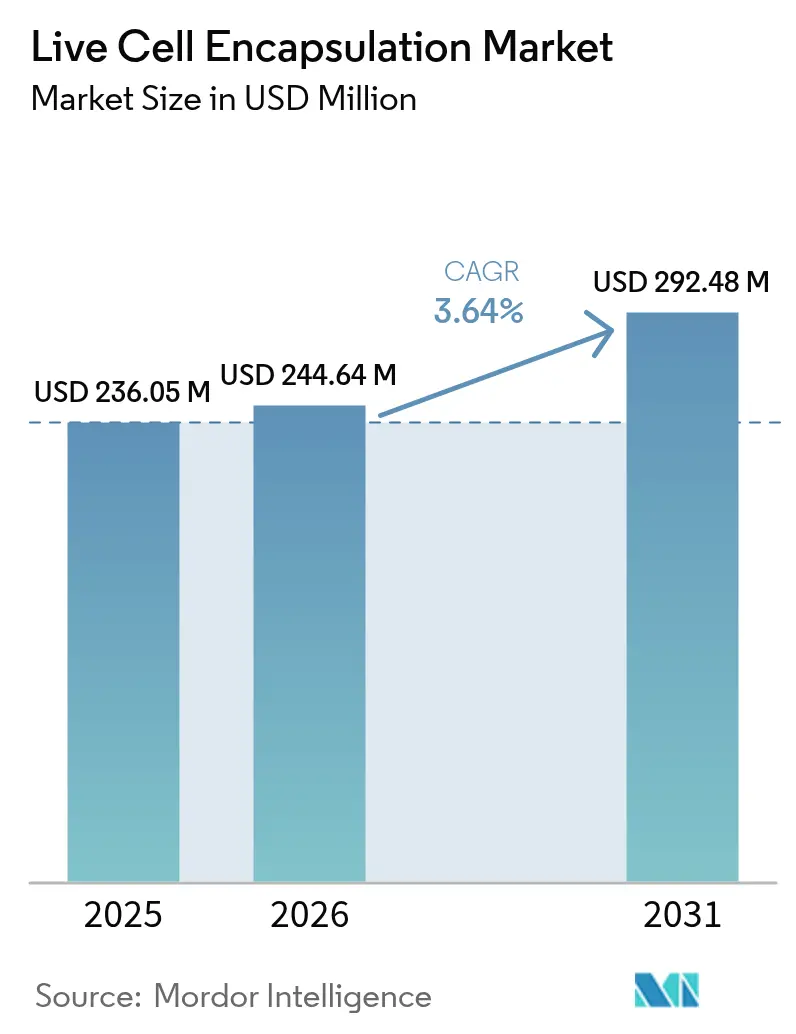
The live cell encapsulation market size is expected to grow from USD 236.05 million in 2025 to USD 244.64 million in 2026 and is forecast to reach USD 292.48 million by 2031 at 3.64% CAGR over 2026-2031. This steady expansion demonstrates the field’s migration from laboratory experiments to regulated commercial products, powered by landmark approvals such as Encelto’s NT-501 for macular telangiectasia in 2024 and the continued progress of VX-880 for Type 1 diabetes in Phase III trials. Momentum also stems from consumer demand for functional foods that carry proven health claims, coupled with regulatory acceptance of encapsulated probiotics in Japan, the European Union and North America. Biopharma investment in automated microfluidic production lines now lowers per-dose costs by 30–40%, enabling companies to move beyond pilot runs and service larger patient populations. Meanwhile, venture capital and strategic funding continue to flow into start-ups that refine biomaterials, improve capsule uniformity or integrate real-time quality-control sensors. All these factors reinforce investor confidence and signal that the live cell encapsulation market is on track to occupy a stable niche within both therapeutic and nutrition sectors.
Key opportunities revolve around chronic disease prevalence, expanding clinical indications and breakthroughs in sustainable polymers. The United States, Canada, Germany, and Japan benefit from established regulatory frameworks that shorten approval timelines for advanced therapy products, while China and South Korea leverage cost-efficient manufacturing and tax incentives to accelerate clinical trial throughput. Market barriers persist in the form of limited GMP-grade raw-material supply and high fixed costs in sterile manufacturing, yet the outsourcing boom is gradually easing these constraints. Automated encapsulation platforms equipped with inline optical monitoring now achieve single-cell capture efficiencies exceeding 79%, translating into more predictable therapeutic outputs and lower batch failure rates. At the same time, food and beverage multinationals are expanding their premium product lines by incorporating encapsulated probiotics that remain viable through pasteurization, establishing a new source of recurring demand for the live cell encapsulation market.
Key Report Takeaways
- By manufacturing technique, electrostatic dripping held 38.12% revenue share in 2025, while rotating disk atomization is forecast to advance at a 5.12% CAGR through 2031.
- By polymer type, alginate controlled 42.05% of the live cell encapsulation market share in 2025; cellulose sulfate is on course to grow at a 6.39% CAGR to 2031.
- By application, drug delivery represented 45.88% of the live cell encapsulation market size in 2025, whereas probiotics and functional foods are projected to post a 6.42% CAGR to 2031.
- By cell source, allogeneic cells accounted for 38.21% market share in 2025, but xenogeneic programs are rising fastest with a 5.78% CAGR to 2031.
- By encapsulation scale, micro-encapsulation accounted for 55.12% market share in 2025, but macro-encapsulation are rising fastest with a 5.06% CAGR to 2031.
- Biopharma and biotech firms together drove 42.95% of end-user demand in 2025, though CROs and CMOs hold the highest growth outlook at 6.11% CAGR on the back of outsourcing trends.
- By geography, North America dominated revenue at 43.12% in 2025; Asia-Pacific is the quickest-expanding region, exhibiting a 4.55% CAGR through 2031.
Note: Market size and forecast figures in this report are generated using Mordor Intelligence’s proprietary estimation framework, updated with the latest available data and insights as of 2026.
Global Live Cell Encapsulation Market Trends and Insights
Drivers Impact Analysis*
| Driver | % Impact on CAGR Forecast | Geographic Relevance | Impact Timeline |
|---|---|---|---|
| Growing public-private investments in biotechnology research | +1.2% | North America, Europe, spill-over to Asia-Pacific | Medium term (2–4 years) |
| Rising burden of chronic and degenerative diseases | +0.8% | Global, intensified in aging economies | Long term (≥ 4 years) |
| Advancements in biomaterials and encapsulation technologies | +0.7% | North America, Europe, expanding in Asia-Pacific | Medium term (2–4 years) |
| Supportive regulatory pathways for advanced cell-based therapies | +0.6% | North America, Europe, emerging in Asia-Pacific | Short term (≤ 2 years) |
| Incorporation of encapsulated probiotics into functional foods and beverages | +0.4% | Global, led by Asia-Pacific consumer markets | Short term (≤ 2 years) |
| Integration of encapsulated cells with implantable or wearable delivery devices | +0.3% | North America, Europe, early-adoption phase | Long term (≥ 4 years) |
| Source: Mordor Intelligence | |||
Growing Public-Private Investments in Biotechnology Research
Venture and strategic capital continue to pour into cell-based platforms. Formation Bio raised USD 372 million in a 2024 Series D round, and Vertex inked a license with TreeFrog Therapeutics featuring USD 215 million in potential milestones[1]Formation Bio Press Office, “Formation Bio Raises USD 372 Million in Series D,” formationbio.com. This influx of funds helps companies shift from proof-of-concept to clinical execution, exemplified by 15 new encapsulated-cell therapy programs that entered Phase I in 2024. The FDA’s expedited designations cut development cycles from 8–10 years to roughly 5–7 years, reducing risk and drawing more capital. Europe’s Horizon Europe grants complement private money, while Asia-Pacific countries sweeten the pot with tax rebates and subsidized lab space. Taken together, these initiatives enlarge the live cell encapsulation market by fueling R&D pipelines and expanding manufacturing footprints in multiple continents.
Rising Burden of Chronic and Degenerative Diseases
More than 1.1 million Americans live with Type 1 diabetes, creating a strong rationale for beta-cell replacement solutions that leverage immune-protected capsules[2]Frontiers Editorial Team, “Bioartificial Pancreas Advances,” frontiersin.org. Age-related macular degeneration already affects 196 million people worldwide, underscoring the unmet need that NT-501 now addresses. Chronic-care expenditures exceed USD 3.8 trillion annually in high-income nations, so health systems increasingly evaluate cell therapies that might offer one-time or infrequent dosing in lieu of lifelong regimens. Demographic aging and lifestyle shifts amplify these pressures, expanding target populations for encapsulated-cell products aimed at endocrine, ophthalmic and neurodegenerative indications. As disease prevalence rises, so does payer willingness to reimburse therapies that promise durable or curative outcomes, thereby increasing the revenue horizon for the live cell encapsulation market.
Advancements in Biomaterials and Encapsulation Technologies
Droplet microfluidics now delivers single-cell encapsulation rates above 79%, improving dose homogeneity and reducing wastage[3]Mujtaba N. et al., “Single-Cell Encapsulation via Droplet Microfluidics,” nature.com. Integrated optical fibers measure oxygen and pH in real time, heading off batch failures early in the run. Modified alginate blends and cellulose nanocrystals boost mechanical strength, lengthening therapeutic persistence from weeks to months, while UPM Biomedicals’ FibGel offers an injectable nanocellulose hydrogel option. Manufacturing automation trims per-dose cost by up to 40%, enabling scale-out facilities that can process millions of capsules hourly. These combined improvements transform what was once an artisanal bench procedure into an industrial-grade platform, broadening the customer base for the live cell encapsulation market across medical and nutritional domains.
Supportive Regulatory Pathways for Advanced Cell-Based Therapies
The FDA’s approval of CASGEVY, the first CRISPR-edited therapy, sets precedents for highly complex biological products. Harmonization efforts between FDA, EMA and MHRA now reduce redundant clinical requirements, while Japan’s Pharmaceuticals and Medical Devices Act allows conditional approval of regenerative products within 2–3 years of pivotal data. Breakthrough and RMAT designations attract venture funding by shortening time-to-market, and clear guidance on raw-material traceability eases supplier qualification. As rules mature, regulatory compliance shifts from a deterrent to a competitive differentiator for companies with robust quality systems, reinforcing growth in the live cell encapsulation market.
Restraints Impact Analysis*
| Restraints Impact Analysis | (~) % Impact on CAGR Forecast | Geographic Relevance | Impact Timeline |
|---|---|---|---|
| Limited availability of pharmaceutical-grade biomaterials | –0.5% | Global, acute in emerging markets | Short term (≤ 2 years) |
| High development and manufacturing costs | –0.4% | Global, pronounced in cost-sensitive regions | Medium term (2–4 years) |
| Stringent regulatory and quality compliance requirements | –0.3% | Global, stricter in North America & Europe | Short term (≤ 2 years) |
| Competition from gene-edited and allogeneic cell-therapy alternatives | –0.2% | Global, highest in developed markets | Long term (≥ 4 years) |
| Source: Mordor Intelligence | |||
Limited Availability of Pharmaceutical-Grade Biomaterials
Only about a dozen suppliers worldwide meet FDA and EMA standards for encapsulation-grade alginate or chitosan, leading to 6–8 week lead times and price premiums of 15–20%. Supply disruptions can ripple across the live cell encapsulation market because raw materials account for 25–30% of finished-goods cost. Geographic concentration in Asia-Pacific adds freight and currency exposure. To mitigate risk, many developers are adopting dual-source strategies or investing in in-house purification lines, but new capacity won’t come online quickly. Until then, raw-material scarcity remains a near-term drag on expansion.
High Development and Manufacturing Costs
Bringing an encapsulated-cell product from concept to market still costs USD 50–80 million, with GMP facility builds running above USD 20 million and specialized electrostatic systems priced beyond USD 500,000 per line. Quality-control assays consume up to 20% of the cost of goods, and skilled technicians earn 25–30% salary premiums. Firms offset these expenses by outsourcing to CDMOs, adopting closed-loop automation and scaling out rather than scaling up. Even so, capital intensity slows market entry for smaller players and tempers overall CAGR in the live cell encapsulation market.
*Our forecasts treat driver/restraint impacts as directional, not additive. The impact forecasts reflect baseline growth, mix effects, and variable interactions.
Segment Analysis
By Manufacturing Technique: Electrostatic Dominance Faces Automation Challenge
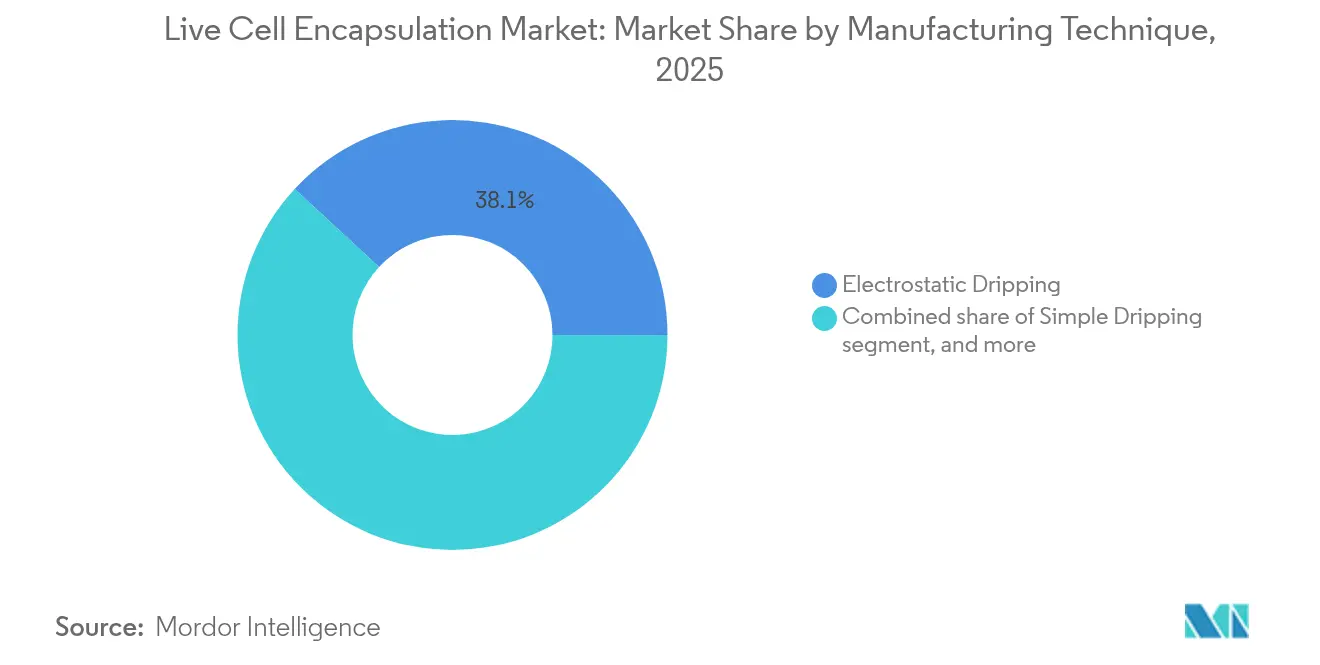
The live cell encapsulation market continues to rely on electrostatic dripping, which captured 38.12% revenue in 2025 thanks to precision droplet formation and long-standing regulatory familiarity. GMP runs demonstrate narrow capsule-diameter ranges that satisfy dose-uniformity specifications for ocular and endocrine implants. However, throughput per nozzle remains moderate, compelling manufacturers to deploy multi-nozzle arrays or hybridize with rotating disk feeders to raise volume. Capital outlays per GMP-grade electrostatic unit top USD 500,000, and each unit still needs HEPA-filtered isolators and automated media exchanges to maintain sterility.
Rotating disk atomization, advancing at a 5.12% CAGR, offers three- to five-fold higher throughput, an advantage for high-volume probiotics and functional-food lines. Uniform centrifugal forces yield capsule diameters under 200 µm while maintaining ≥ 90% viability. Producers integrate inline imaging to verify droplet size in real time, allowing rapid corrective actions and lower scrap rates. Simple dripping persists in academic settings because equipment costs are low, though its adoption in clinical manufacturing remains limited. Meanwhile, coaxial airflow and ultrasonic methods find traction where delicate strains require ultra-low shear, especially in beverage applications. Microfluidics, while currently a niche, promises disruptive precision for patient-specific therapies once unit economics improve.



By Polymer Type: Alginate Leadership Challenged by Cellulose Innovation
Alginate held 42.05% market share in 2025, bolstered by decades of clinical data and predictable gelation kinetics. Calcium-crosslinking makes process validation straightforward, and regulators are comfortable with impurity profiles when GMP purification is documented. Nonetheless, alginate batches vary by seaweed harvest, leading to viscosity shifts that complicate process control. Producers now employ inline rheometers and add mechanical stabilizers to reduce lot-to-lot variability, thereby safeguarding therapeutic consistency.
Cellulose sulfate is the fastest-growing polymer, with a 6.39% CAGR, due to superior tensile strength and controllable porosity that extends drug release from weeks to months. Its plant origin enables renewable sourcing, aligning with ESG targets that major pharmas publicize in annual reports. Hybrid matrices combine alginate with nanocellulose or chitosan to tailor diffusion rates for pancreatic or retinal implants. Silica-based formulations-accounting for a modest share-target harsh-processing environments such as high-temperature spray drying. Synthetic biodegradable polymers also occupy specialized niches where time-controlled degradation matches therapeutic endpoints. Polymer selection is thus governed more by indication-specific needs than raw-material cost, fostering a diverse landscape within the live cell encapsulation market.
By Application: Drug Delivery Maturity Contrasts Probiotics Growth
Drug delivery maintained 45.88% revenue share in 2025, underpinned by validated clinical pathways and tangible outcomes in ocular, endocrine and neurological disorders. Hospitals favor these products because dosage schedules are well understood and often reimbursed. Yet saturation looms in established markets, prompting developers to pursue combination devices that integrate sensors or remote-controlled valves to personalize dosing.
Probiotics and functional foods represent the fastest-growing application at 6.42% CAGR, driven by consumers’ preventive-health mindset and by regulatory frameworks such as Japan’s Foods with Function Claims that legitimize well-defined health claims. Encapsulation helps probiotic cultures survive pasteurization and acidic gastric transit, enabling food and beverage marketers to offer premium SKUs at 20-30% higher prices. Regenerative medicine and cell transplantation segments show solid pipelines in diabetes, spinal cord injury and corneal repair but command smaller revenue today. The broadened application mix reduces concentration risk and establishes multiple growth avenues for the live cell encapsulation market.
By Cell Source: Allogeneic Dominance Meets Xenogeneic Innovation
Allogeneic products captured 38.21% market share in 2025, leveraging batch manufacturing efficiencies and standardized donor screening that satisfy regulators. Cryopreserved cell banks facilitate repeatable production, lowering variable costs per patient. Nevertheless, supply remains finite, and immune response risks persist despite encapsulation.
Xenogeneic approaches, registering a 5.78% CAGR, attract interest as encapsulation materials now provide effective immunoisolation. Porcine islet cells, for example, maintain glucose regulation in animal models for six months without systemic immunosuppression. Developers see opportunities to alleviate organ shortages, with more than 100,000 Americans on transplant waiting lists. Autologous products continue to serve personalized-medicine niches but are inherently costly and logistically complex. Engineered cell lines extend versatility by secreting specific growth factors or antibodies on cue. The widening palette of cell sources bolsters resilience and expands the live cell encapsulation market’s potential addressable pool.
By Encapsulation Scale: Micro-Encapsulation Leads Through Versatility
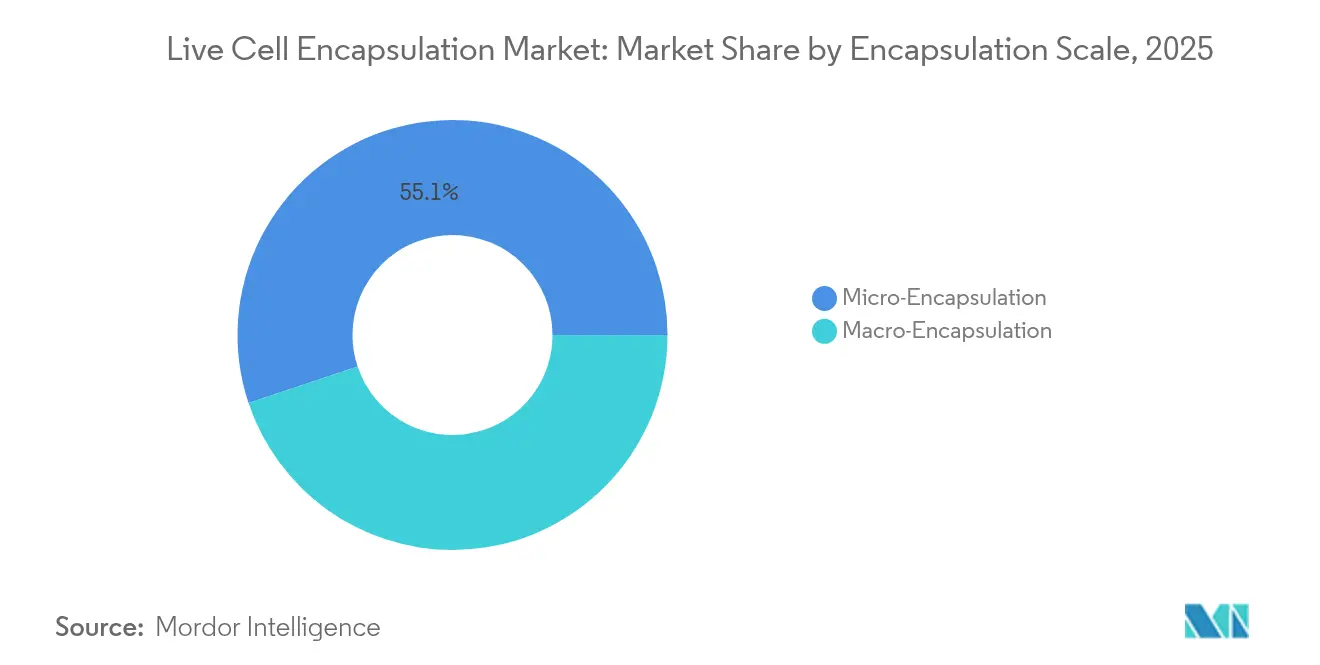
Micro-encapsulation captured 55.12% of revenue in 2025, thanks to its compatibility with minimally invasive administration and superior mass-transfer rates. Automated platforms now achieve coefficients of variation under 5% for capsule diameter, assuring tight dose control. High surface-to-volume ratios enhance nutrient diffusion, a critical factor for dense beta-cell implants targeting insulin independence.
Macro-encapsulation, growing at 5.06% CAGR, gains traction for indications where device retrieval is valued, such as first-in-human trials. Flat-sheet or pouch devices allow higher cell loading and simplified monitoring, albeit at the cost of surgical implantation. Hybrid architectures place microcapsules within macro-devices, marrying retrieval capability with micro-scale diffusion. Scale selection thus aligns with clinical objectives rather than technical constraints, underscoring flexibility within the live cell encapsulation market.
By End User: Biopharma Leadership Faces CRO Competition
Biopharma and biotech companies drove 42.95% of demand in 2025, sustaining internal R&D pipelines and often maintaining captive manufacturing to protect intellectual property. AstraZeneca’s acquisition of EsoBiotech in March 2025 widened its in vivo cell-therapy toolkit while adding GMP-compliant suites configured for encapsulated products. Yet the financial burden of building sterile facilities pushes many sponsors toward outsourcing.
CROs and CMOs, expanding at 6.11% CAGR, benefit from economies of scale. Lonza’s USD 1.2 billion purchase of Genentech’s Vacaville site converts a large-molecule plant into a multi-suite cell-therapy campus. ViSync Technologies, a 2025 joint venture between Hovione and iBET, focuses on downstream washing, filling and cryopreservation. Academic centers remain hotbeds of polymer innovation, spinning out start-ups that license technology to manufacturers. Food and cosmetics companies join as newcomers, commissioning tailored probiotics or dermal-regeneration products, further diversifying the live cell encapsulation market customer base.
Geography Analysis
North America retained 43.12% revenue share in 2025. The region’s robust venture ecosystem funnels capital into Boston’s Kendall Square, the San Francisco Bay Area and North Carolina’s Research Triangle. The FDA’s Breakthrough and RMAT pathways encourage early clinical adoption, while reimbursement milestones for NT-501 validate payers’ willingness to cover encapsulated-cell therapies when clinical outcomes meet endpoints. Interstate collaborations streamline logistics, digital batch records and real-time release testing, collectively shortening lead times for domestic deployments.
Asia-Pacific is the fastest-growing territory, projected at a 4.55% CAGR to 2031. China hosts 37% of global cell- and-gene therapy trials thanks to policy incentives and provincial grants that offset clinical expenses. Local governments fund infrastructure, while contract manufacturers in Suzhou and Shanghai offer lower labor costs yet maintain ISO and cGMP certification. Japan’s Foods with Function Claims regime boosts probiotic demand, and South Korea channels subsidies into closed-system bioprocessing. India’s pharmaceutical ecosystem adds volume, supplying media components and single-use assemblies at competitive pricing. Cost advantages and rising chronic-disease prevalence collectively expand the live cell encapsulation market footprint across Asia-Pacific.
Europe presents a mature but innovation-driven environment. EMA’s centralized review covers 27 member states, though post-Brexit divergence requires duplicated filings for the United Kingdom, introducing administrative overhead. Germany, France and the Nordic countries back sustainability initiatives that spur cellulose-based encapsulation materials, aligning industrial policies with ESG drivers. Academic-industry consortia tap Horizon Europe funding to develop low-carbon manufacturing workflows, reflecting regional emphasis on green bioprocessing. Though growth is slower than in Asia-Pacific, Europe’s stringent quality standards and strong purchasing power keep the live cell encapsulation market lucrative.
Elsewhere, South America, the Middle East and Africa remain nascent but show double-digit growth potential. Brazil’s ANVISA guidance on advanced therapies, Saudi Arabia’s Vision 2030 healthcare investment and South Africa’s aspiration to become a biomanufacturing hub all hint at future demand. However, limited cold-chain infrastructure and reimbursement uncertainty currently constrain volume. Over the medium term, technology-transfer agreements and multilateral financing could unlock further regional uptake, contributing incremental revenue to the global live cell encapsulation market.

Regulatory Landscape
Live cell encapsulation products that enter clinical use generally sit within established biologics and advanced-therapy frameworks, with compliance spanning drug GMP controls and human cell and tissue handling rules. In the United States, FDA oversight commonly combines 21 CFR 210/211 expectations for manufacturing and control with 21 CFR 1271 requirements for donor eligibility and tissue practices, while in the European Union many cell-based products go through the EMA advanced therapy medicinal product (ATMP) framework and its risk-based review approach.
A near-term regulatory anchor is the FDA finalization of guidance on Chemistry, Manufacturing, and Control (CMC) flexibilities for cell and gene therapy products in May 2026. This reinforces phase-appropriate GMP and risk-based comparability expectations that affect encapsulated-cell process changes, scale-up, and analytic control strategies. International standards also shape quality systems and cross-border readiness, including ISO 13022:2012 (risk management for processing viable human cells for medical products) and ISO 23033:2021 (technical requirements for analytical testing of cell therapy products). These standards provide concrete reference points for risk, testing, and traceability when companies qualify polymers, establish release specifications, and validate aseptic encapsulation operations.
Competitive Landscape
The live cell encapsulation market is moderately fragmented. No single player controls more than 10% of worldwide revenue, and the top five likely command 35–40%. Differentiation centers on proprietary polymers, microfluidic chip designs and automated quality-control suites. Patent filings now exceed 200 annually, yet most cover incremental advances such as novel cross-linkers or inline sensing algorithms rather than radical breakthroughs.
Consolidation is picking up. AstraZeneca’s March 2025 acquisition of EsoBiotech adds in vivo encapsulation capability for oncology, while Alcon’s majority stake in Aurion Biotech moves the ophthalmology giant into corneal-endothelial therapies. Vertex’s milestone-laden license with TreeFrog Therapeutics secures access to high-throughput microfluidic encapsulation for diabetes programs, illustrating how big pharma often opts for licensing over internal development to mitigate risk.
CDMOs scale aggressively. Lonza’s Vacaville acquisition converts a stainless-steel monoclonal antibody plant into a multi-product cell-therapy facility that features closed isolators and automated fill-finish lines tuned for microcapsules. DHL’s purchase of CRYOPDP bolsters ultracold logistics, addressing a critical bottleneck for global distribution of live products. Start-ups like Dolomite and Sphere Fluidics leverage precision engineering to capture niche share in single-cell encapsulation for personalized oncology, while UPM Biomedicals enters with renewable-polymer expertise. The result is dynamic competition, where established pharma, agile biotechs and specialized service providers jockey for position in the expanding live cell encapsulation market.
Live Cell Encapsulation Industry Leaders
ViaCyte Inc.
Living Cell Technologies Limited.
Sigilon Therapeutics Inc.
Sernova Corp.
PharmaCyte Biotech Inc.
- *Disclaimer: Major Players sorted in no particular order

Market Opportunities and Future Outlook
Manufacturing simplification and scale economics remain a central whitespace area in live cell encapsulation, since many clinical and commercial programs still rely on specialized, capital-intensive microfluidic or high-precision droplet systems. A concrete 2026 proof point is the University of Tokyo-reported Emulsion-Templated Gel-Embedding (ETE) workflow (June 2026). The approach is described as a microfluidics-free method that uses simple laboratory tools to generate over 100,000 uniform hydrogel microcapsules in a single workflow, pointing to a more accessible pathway for process development and faster iteration on capsule uniformity and throughput.
On the application side, Type 1 diabetes and transplant-adjacent indications keep driving materials and device innovation around immunoisolation and oxygen transport, where hypoxia and nutrient diffusion constraints still limit durability, particularly in macroencapsulation formats. Named encapsulation systems for pancreatic islet transplantation, including Adoshell presented at an ADA 2026 venue, and ongoing research into oxygen-carrying materials and barrier architectures support openings for suppliers of high-performance polymers, oxygen-permeable designs, and analytical testing packages that match evolving CMC expectations. At the same time, opportunities extend into regulated functional foods where encapsulation helps protect viability through processing and gastric transit, supporting demand for scalable micro-encapsulation lines and standardized viability and stability testing to support compliant positioning across major regions.
Recent Industry Developments
- May 2026: The US FDA finalized guidance on CMC flexibilities for cell and gene therapy products, reinforcing phase-appropriate GMP and risk-based comparability approaches for manufacturing changes. This directly influences encapsulated-cell developers as they adjust polymers, capsule formation steps, or scale-out strategies without derailing clinical progress. The update also raises the value of robust analytical control and traceability packages that can justify process evolution during development.
- April 2025: Atelerix signed an exclusive distribution agreement with MineBio to expand reach into China. The agreement strengthens channel access for cold-chain and cell-handling solutions that support live-cell workflows, including encapsulated formats sensitive to transport and handling conditions. It also reflects a broader push to localize commercialization pathways in Asia-Pacific alongside the region’s growing cell-therapy activity.
- December 2024: Lonza announced strategic restructuring to exit capsules and focus on CDMO services. By reallocating resources toward contract development and manufacturing, the company reinforced outsourcing as a route for sponsors facing high fixed costs in sterile production and fill-finish operations. This shift supports a market environment where capacity, quality systems, and end-to-end manufacturing services become differentiators for moving encapsulated-cell programs beyond pilot scale.


Research Methodology Framework and Report Scope
Market Definition and Coverage
This market tracks revenues generated from technologies and materials used to encapsulate living cells into protective micro-scale structures for research and therapeutic workflows, where encapsulation helps cell viability, controlled release, or immune isolation.
Scope exclusions: It excludes general cell culture consumables and non-encapsulation delivery formats that do not form an encapsulating polymer or material layer around cells.
Segmentation Overview
- By Manufacturing Technique
- Simple Dripping
- Electrostatic Dripping
- Coaxial Airflow
- Rotating Disk Atomisation
- Other Manufacturing Techniques
- By Polymer Type
- Alginate
- Chitosan
- Silica
- Cellulose Sulfate
- Other Polymer Types
- By Application
- Drug Delivery
- Regenerative Medicine
- Cell Transplantation
- Probiotics & Functional Foods
- Other Applications
- By Cell Source
- Autologous
- Allogeneic
- Xenogeneic
- Genetically-Engineered
- By Encapsulation Scale
- Micro-Encapsulation
- Macro-Encapsulation
- By End User
- Biopharma & Biotech Firms
- Academic & Research Institutes
- CROs & CMOs
- Other End Users
- Geography
- North America
- United States
- Canada
- Mexico
- Europe
- Germany
- United Kingdom
- France
- Italy
- Spain
- Rest of Europe
- Asia-Pacific
- China
- Japan
- India
- Australia
- South Korea
- Rest of Asia-Pacific
- Middle East & Africa
- GCC
- South Africa
- Rest of Middle East & Africa
- South America
- Brazil
- Argentina
- Rest of South America
- North America
Data Sources, Market Sizing, and Validation
Desk Research
Desk work started with public science and health sources that help us map the demand pool and the pace of real-world adoption, such as NIH and PubMed records, FDA and EMA approvals and trial registries, and OECD and World Bank health and R&D indicators. We also used patent databases and selected peer-reviewed journals to understand which encapsulation techniques and biomaterials are moving from lab use toward repeatable manufacturing.
On the commercial side, we relied on company annual reports, investor presentations, and press releases to capture product launches, capacity expansions, and strategic focus areas tied to encapsulation workflows. We used a paid subscription for company financials and intelligence to standardize revenue cues and business mix where public reporting is uneven. These desk sources are illustrative only, and many other public and paid references were also checked for data collection, validation, and clarification.
Primary Interviews and Surveys
Primary calls and surveys were done with a mix of technology providers, biomaterial specialists, and downstream users in regenerative medicine, drug delivery, and cell transplantation programs. Respondent input was used to confirm typical use rates by technique, expected shifts toward automated and microfluidic production, and how pricing changes as projects move from research use to regulated use. Because this is a global market, the responses were balanced across major regions to stress-test assumptions that were too optimistic or too conservative.
Distribution of primary research fieldwork respondents
| Company type | Respondent position | Region |
|---|---|---|
| Top tier: 34% | CXOs: 14% | APAC: 42% |
| Mid tier: 52% | Functional/Unit leaders: 36% | EMEA: 34% |
| Smaller Players: 14% | Managers: 50% | Americas: 24% |
Market-Sizing & Forecasting
The core model uses a top-down build where procedure and program activity signals are converted into a realistic demand pool for encapsulation inputs, and then translated into value using typical price bands by technique and polymer type. In live cell encapsulation, the practical anchors include clinical trial activity and approvals related to cell therapies, the mix of applications (drug delivery, regenerative medicine, and cell transplantation), and the split of manufacturing techniques that drive different throughput and cost structures.
To keep totals grounded, results are corroborated through selective bottom-up checks such as sampling product price points, applying volume assumptions to known end-use workflows, and sanity-checking supplier revenue cues when they are clearly attributable. Key model variables used as inputs include active clinical programs using encapsulated cell approaches, adoption of alginate and other polymers in commercial-scale runs, expected yield loss and rework rates in encapsulation steps, average selling price progression as buyers shift from research batches to more controlled production, and region-level funding intensity for advanced therapies. When a data point is missing for smaller geographies or niche techniques, we fill gaps using proxy ratios from similar markets and then re-test those ratios with expert feedback.
For forecasting, scenario analysis is used, and then narrowed to a base case using the directionality shared by respondents on capacity scale-up timing and near-term regulatory milestones. That base case is further checked against macro indicators like R&D spend trends and therapy pipeline growth so year-to-year changes stay explainable.
Data Validation & Update Cycle
Outputs are validated through several checks so the numbers do not rely on one assumption. We compare the modeled totals against independent signals like trial and approval momentum, regional funding patterns, and observed pricing ranges for encapsulation materials and workflows, and then outliers are investigated before sign-off. If a large variance shows up, we re-check the input series, revisit conversion factors, and re-contact select experts to confirm whether the change is structural or a one-off.
The report is refreshed annually, and interim adjustments are made when material events occur, such as meaningful regulatory decisions, major capacity additions, or sharp shifts in biomaterial availability. Before delivery, a final analyst pass is completed so clients receive an updated view aligned to the latest public information and field feedback.
Mordor Intelligence's Live Cell Encapsulation Market Sizing Compared With Other Published Estimates
Published market sizes for live cell encapsulation often vary because the counted boundary is not the same across studies, and the conversion from scientific activity into revenue can be handled in different ways. Differences usually come from what gets included around biomaterials and services, which year is treated as the base, and how pricing is carried forward over time.
Clinical trial and regulatory activity signals, along with technique-level adoption checks from interviews, are the evidence used to keep Mordor Intelligence's 2026 estimate tied to encapsulation-specific demand rather than the broader cell therapy toolchain. Another common gap driver is scope creep, where some estimates appear to fold in adjacent lab workflows or wider cell processing spend, and then apply faster growth expectations without re-testing those assumptions against realistic manufacturing throughput and regional uptake.
Benchmark comparison
| Source | Market Size | Gaps in Research Methodology |
|---|---|---|
| Mordor Intelligence | USD 244.64 M (2026) | |
| Global Consultancy A | USD 382.30 M (2025) | Uses a broader revenue capture that likely includes adjacent cell therapy processing and enabling tool spend, and it also reflects a different base year which can inflate comparisons when pricing and volume assumptions are not aligned to the same period. |
| Industry Publisher B | USD 320.00 M (2024) | Earlier base year and high-level segmentation can create reliance on blended averages, which may not separate encapsulation techniques and polymer types that carry very different throughput and pricing, leading to a higher rolled-up total. |
The spread in the table is best explained by scope boundaries and base-year alignment, followed by how quickly pricing and adoption are allowed to rise in the forecast. Our approach stays traceable because the sizing logic is anchored to observable demand signals and then cross-checked with practical price and volume checks that can be repeated each update cycle.


Key Questions Answered in the Report
What is the expected size of the live cell encapsulation market by 2031?
The live cell encapsulation market is forecast to reach USD 292.48 million by 2031, growing at a 3.64% CAGR.
Which manufacturing technique currently dominates the live cell encapsulation market?
Electrostatic dripping holds the largest share at 38.12% thanks to proven scalability and regulatory familiarity.
Why is Asia-Pacific the fastest-growing region?
Favorable policy reforms, extensive clinical trial activity in China and Japan’s supportive framework for functional foods drive a 4.55% regional CAGR.
Which application segment is expanding most rapidly?
Probiotics and functional foods post the strongest growth at 6.42% CAGR because encapsulation enhances probiotic survivability and allows health claims under evolving food regulations.
How are high production costs being mitigated?
Industry players increasingly outsource to specialized CDMOs, adopt automation that lowers batch costs by up to 40% and pursue vertical integration to secure GMP-grade biomaterials.
What are the key materials used in encapsulation today?
Alginate remains the leading polymer, while cellulose sulfate and nanocellulose hydrogels are gaining momentum due to superior mechanical strength and sustainability profiles.
Page last updated on:





