Cell And Gene Therapy Manufacturing Services Market Size and Share
Market Overview
| Study Period | 2020 - 2031 |
|---|---|
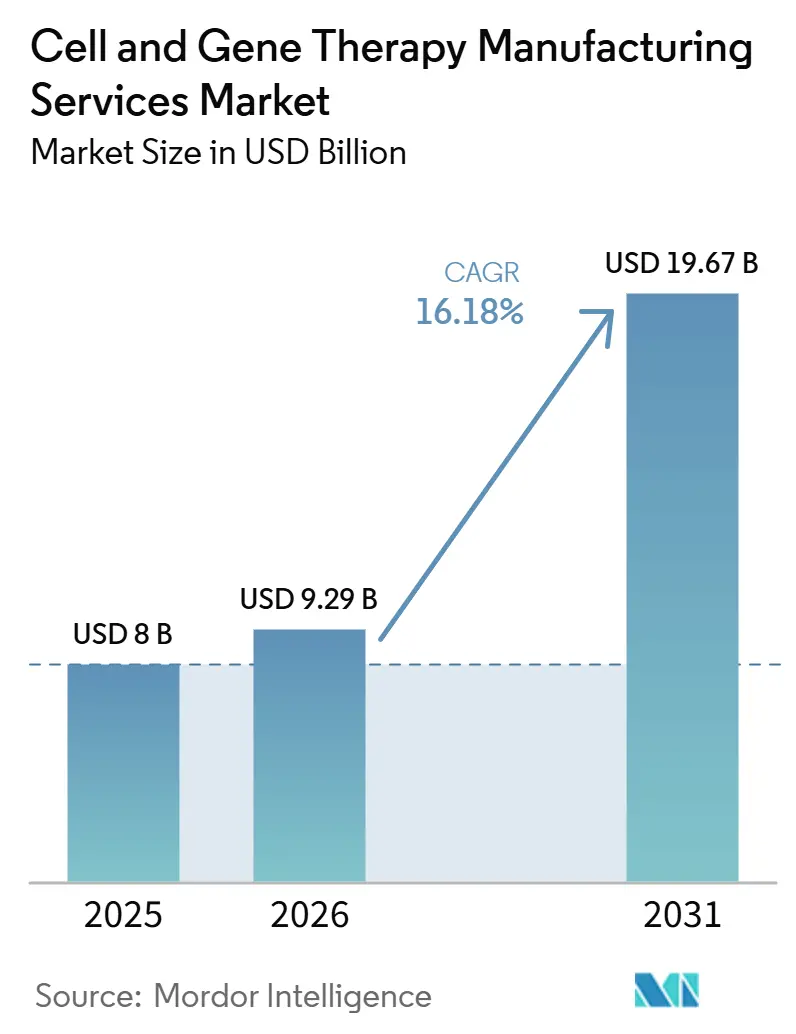
| Market Size (2026) | USD 9.29 Billion |
| Market Size (2031) | USD 19.67 Billion |
| Growth Rate (2026 - 2031) | 16.18% CAGR |
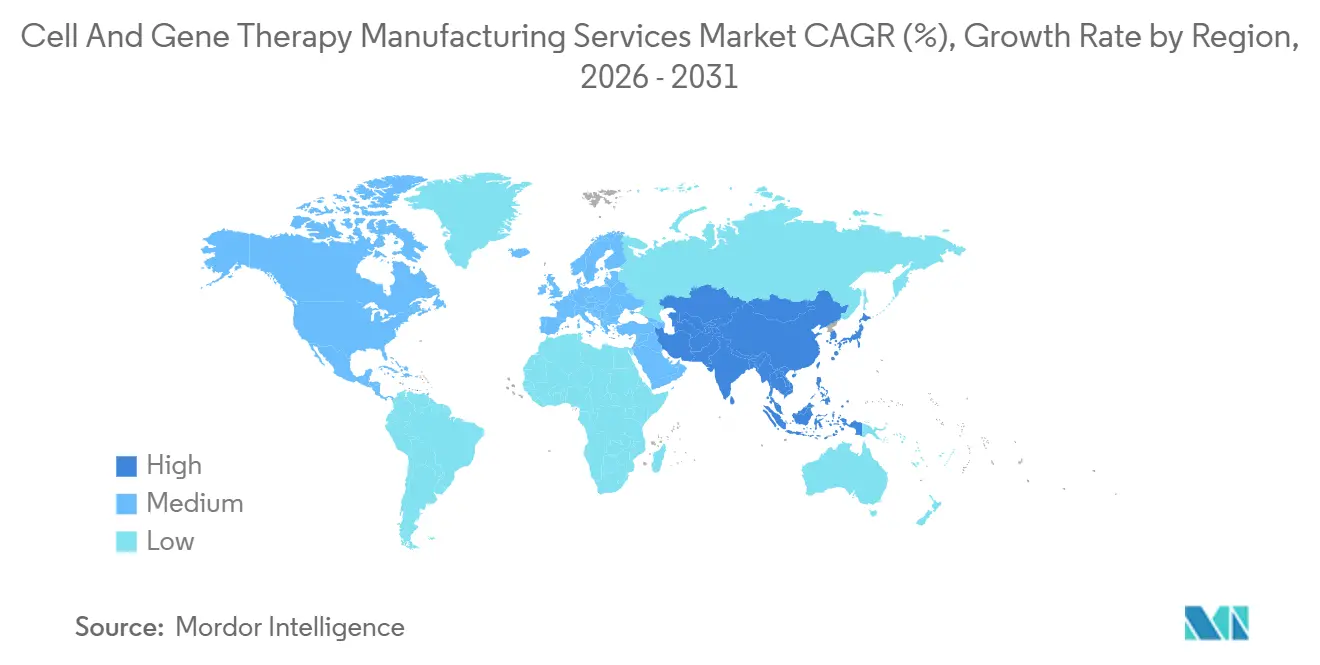
| Fastest Growing Market | Asia-Pacific |
| Largest Market | North America |
| Market Concentration | Medium |
Major Players.webp) *Disclaimer: Major Players sorted in no particular order Image © Mordor Intelligence. Reuse requires attribution under CC BY 4.0. | |
Cell And Gene Therapy Manufacturing Services Market Analysis by Mordor Intelligence
The Cell And Gene Therapy Manufacturing Services Market size is projected to expand from USD 8 billion in 2025 and USD 9.29 billion in 2026 to USD 19.67 billion by 2031, registering a CAGR of 16.18% between 2026 to 2031.
The rapid pace encapsulates the sector’s shift from experimental modalities toward commercially viable therapeutics, a progression that increasingly obliges manufacturers to replicate pharmaceutical‐style reliability without sacrificing the scientific flexibility these living medicines require. Industry executives monitoring capital allocation are already factoring in the likelihood that every incremental regulatory approval immediately tightens available capacity, effectively bringing forward investment decisions by at least two to three years compared with traditional biologics.
Key Report Takeaways
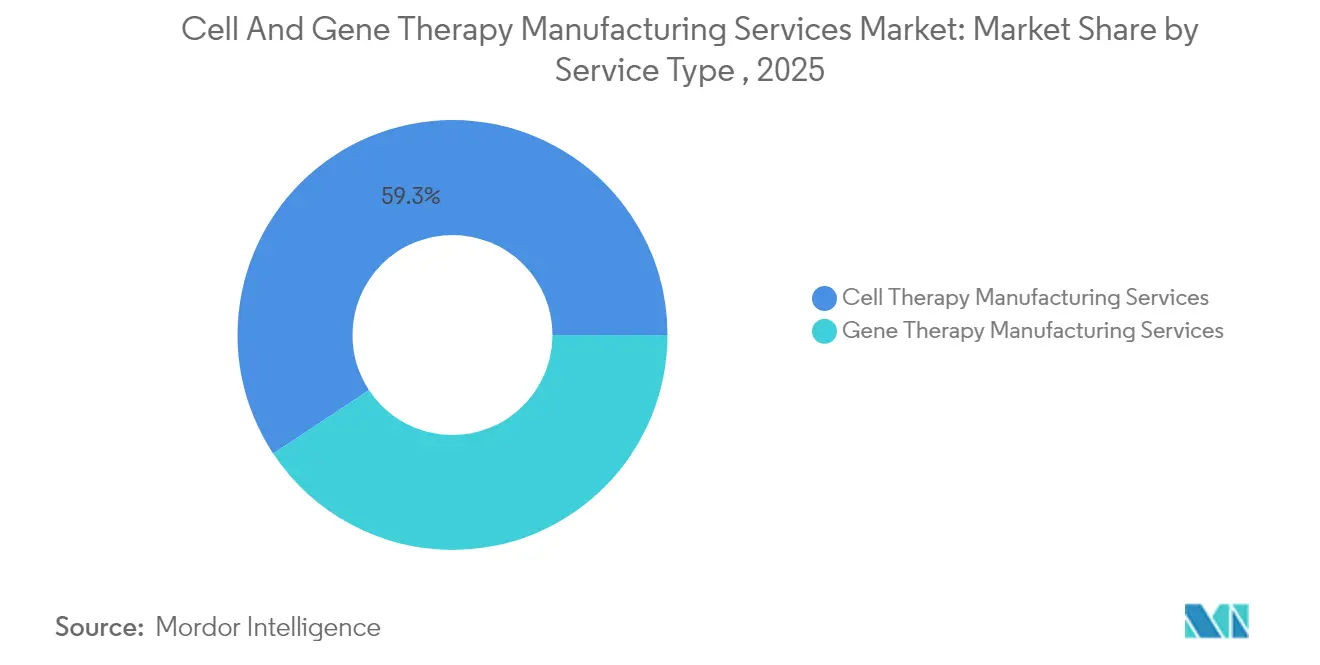
- By service type, cell therapy manufacturing accounted for approximately 59.30% of current revenue, whereas gene therapy services are expected to grow at a 23.3% CAGR.
- By phase, phase II accounted for 45.10%, whereas commercial manufacturing is expected to grow at a 27.6% CAGR.
- By application, clinical manufacturing currently represents 73.60% of the market in 2025, whereas commercial manufacturing is growing at a substantially faster rate (22.4% CAGR from 2026-2031).
- By mode of operation, Contract/outsourced manufacturing dominates the market with a 64.40% share in 2025 and is growing at 18.1% CAGR (2026-2031), significantly outpacing in-house operations.
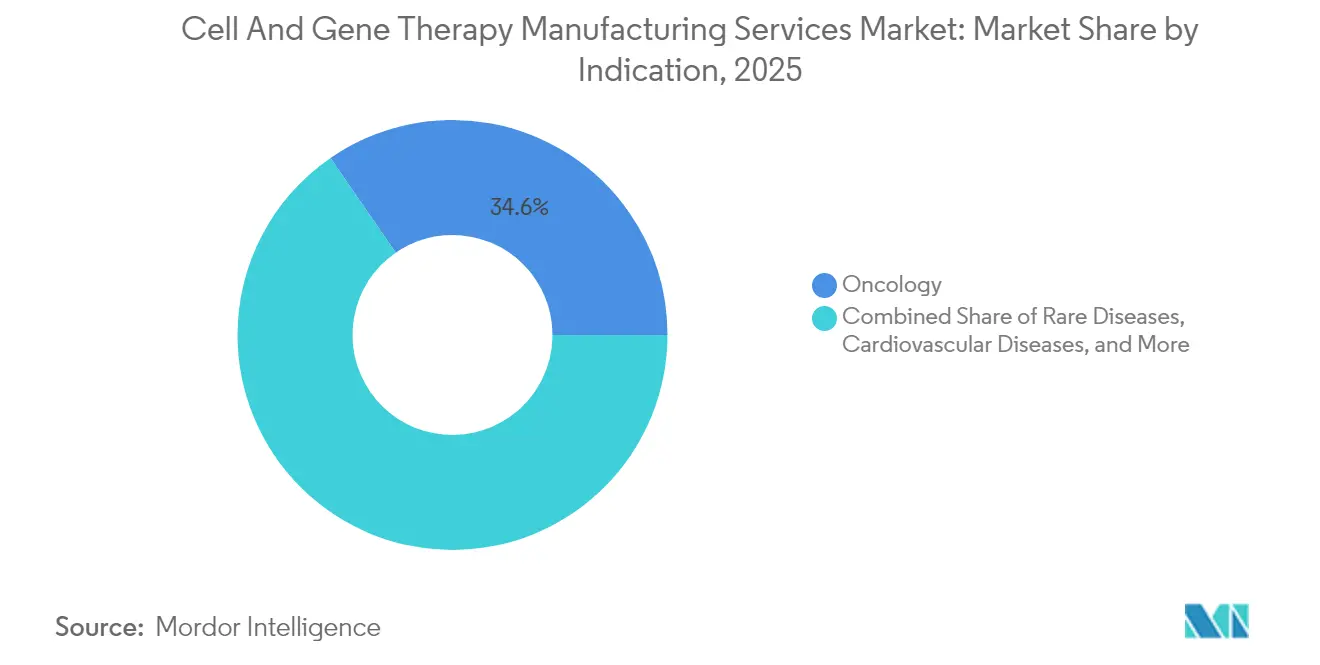
- By indication, oncology remains the dominant cluster, with a 34.60% share, whereas rare diseases are growing at a 17.9% CAGR.
- By end user, pharma and biotech companies anchor demand holding 41.50% share, yet academic and research institutes are playing a larger role by growing with CAGR of 18.2%.
- By geography, North America retains leadership with an estimated 44.30% share in 2025, yet Asia-Pacific records the fastest growth of 20.8% owing to supportive policies and expanding specialist capacity.
Note: Market size and forecast figures in this report are generated using Mordor Intelligence’s proprietary estimation framework, updated with the latest available data and insights as of 2026.
Global Cell And Gene Therapy Manufacturing Services Market Trends and Insights
Drivers Impact Analysis*
| Driver | (~) % Impact on CAGR | Forecast Geographic Relevance | Impact Timeline |
|---|---|---|---|
| Surge in prevalence of cancer and other chronic diseases | +3.2 % | Global | Long term (≥ 4 years) |
| Shift towards personalized medicine | +2.8 % | North America, Europe | Medium term (2-4 years) |
| Surge in rare-disease designations driving CGT pipeline | +1.9 % | North America, Europe | Medium term (2-4 years) |
| Shift toward allogeneic “off-the-shelf” platforms requiring large-scale bioreactors | +2.4 % | Global | Long term (≥ 4 years) |
| Growing approvals and robust clinical pipelines | +3.6 % | Global | Short term (≤ 2 years) |
| Increasing investment and funding | +2.5 % | North America, Asia-Pacific | Short term (≤ 2 years) |
| Source: Mordor Intelligence | |||
Surge in Prevalence of Cancer and Other Chronic Diseases
Cancer remains the second leading global cause of death, and regulators continue to expedite oncology submissions. The FDA’s Oncology Center of Excellence has created rare-tumor review pathways that transform small-population indications into commercially viable segments [1]Robert Califf, “List of Approved Cellular and Gene Therapy Products,” U.S. Food and Drug Administration, fda.gov. A less obvious implication is that CDMOs are launching disease-clustered cleanroom suites so developers can pre-book capacity years in advance, preserving supply for ultra-orphan oncology products even when utilisation hovers below traditional efficiency benchmarks.
Shift Towards Personalized Medicine
Autologous therapies, sourced from each individual patient, require agile facilities capable of running dozens of parallel micro-batches daily. The logistical orchestration around chain-of-identity tracking now rivals the scientific complexity of the drug itself, and many senior operations managers privately concede that digital traceability platforms are becoming the single biggest differentiator when bidding for new client programs. A notable inference here is the emergence of “manufacturing as a data service”; some CDMOs are monetising their proprietary software for sample tracking separately from their capacity, creating a dual-revenue stream and increasing client switching costs irrespective of physical location.
Simultaneously, allogeneic approaches promise scale economies but must confront immunogenicity and efficacy questions, resulting in a bifurcated capital plan where sponsors hedge their bets: they commission small-footprint autologous suites while reserving adjacent shell space for eventual large-scale allogeneic bioreactors. This real-estate arbitrage, essentially paying today for the right to expand tomorrow, is quietly inflating the asset base of many manufacturers and could pressure future return on invested capital if clinical data fail to validate allogeneic pipelines.
Growing Approvals and Robust Clinical Pipelines
The United States Food and Drug Administration (FDA) lists more than twenty approved cell and gene therapies as of early 2024, and agency officials continue to signal that review resources are being added to manage the volume of submissions. Practically, each approval triggers an almost immediate move from engineering-run to commercial-run status in the manufacturing plant, compressing timelines that historically stretched over eighteen months. A secondary consequence is that quality-by-design frameworks—once considered best practice—are now mandatory just to secure investor confidence ahead of commercial launch.
Viral vector production remains the critical industry bottleneck, particularly for adeno-associated virus (AAV) and lentiviral systems. Savvy CDMOs are beginning to guarantee vector slots under multi-year take-or-pay agreements, effectively mirroring semiconductor foundry strategies. While this secures capacity for larger biopharma clients, it unintentionally crowds out smaller venture-backed developers, nudging them toward novel non-viral delivery solutions sooner than originally forecast.
Increasing Investment and Funding
A wave of capital is targeting specialised infrastructure rather than generic square footage. For example, Amgen confirmed a USD 900 million investment in an Ohio site dedicated to advanced therapies, with leadership indicating that modular cleanrooms will permit simultaneous autologous and allogeneic production [2]Kevin Lowery, “Amgen to Invest USD 900 Million in New Ohio Manufacturing Facility,” Amgen, amgen.com. From an industry planning standpoint, the existence of multi-suite hubs in Midwestern U.S. locations subtly shifts workforce migration patterns: talent once concentrated on the two coasts now finds competitive opportunities inland, marginally alleviating nationwide staffing shortages while pressuring coastal sites to refine retention incentives.
On a policy front, the National Security Commission on Emerging Biotechnology urged the establishment of a national coordination office to bolster on-shore biomanufacturing and safeguard supply chains. Executives interpret this as an early harbinger of potential procurement preference for domestically produced advanced therapies, a dynamic that may raise the strategic value of U.S.-based capacity even if per-batch costs remain higher than emerging-market alternatives.
Restraints Impact Analysis*
| Restraint | (~) % Impact on CAGR | Forecast Geographic Relevance | Impact Timeline |
|---|---|---|---|
| High operational costs | −2.7 % | Global | Short term (≤ 2 years) |
| High autologous CAR-T batch-failure rates (≈ 15 %) eroding CDMO margins | −1.3 % | North America, Europe | Short term (≤ 2 years) |
| Scarcity of skilled cell-processing workforce | −2.1 % | Asia-Pacific, North America | Medium term (2-4 years) |
| Regulatory harmonization gaps | −1.0 % | Europe, Asia-Pacific | Medium term (2-4 years) |
| Source: Mordor Intelligence | |||
High Operational Costs
Manufacturing costs for approved cell and gene therapies routinely exceed USD 1 million per treatment, driven by customised raw materials, extensive quality control testing and low batch volumes. A notable ripple effect is that reimbursement negotiations increasingly reference factory yield data; payers seek assurances that lot failure rates stay within single-digit thresholds to mitigate drug waste. Consequently, operations leaders are piloting closed, automated systems that reduce human manipulation points, thereby improving reproducibility.
Interestingly, large CDMOs are beginning to quantify automation return on investment not merely in direct labour savings but in expanded regulatory capacity; every reduction in manual interventions potentially reduces FDA inspection scope, freeing finite quality-assurance headcount to support more concurrent programs. This reframing elevates automation from a cost-containment initiative to a revenue-expandability lever.
Scarcity of Skilled Cell-Processing Workforce
The talent supply gap remains acute. Facilities in rapidly growing regions such as Asia–Pacific report that onboarding experienced cell-processing engineers can take six to nine months, prolonging facility start-ups and delaying revenue recognition. Some manufacturers are responding by embedding academic partnerships within their campus footprint, offering students practicum rotations inside GMP suites. A less obvious strategic implication is that such arrangements give CDMOs an early look at promising graduate researchers who may later join client companies, enhancing business development intelligence ahead of formal RFP cycles.
In the United States, congressional debate on the BIOSECURE Act is adding complexity; global companies fear restrictions on cross-border staffing could constrain their ability to rotate experienced personnel. As a hedge, several multinationals have begun duplicating standard operating procedures across facilities in different jurisdictions to facilitate rapid technology transfer should talent mobility tighten.
*Our forecasts treat driver/restraint impacts as directional, not additive. The impact forecasts reflect baseline growth, mix effects, and variable interactions.
Segment Analysis
Service Type: Viral Vectors Driving Gene Therapy Growth
Cell therapy manufacturing controls approximately 59.30 % of current revenue, yet gene therapy services—anchored on viral vector supply—are expanding at a projected 23.3 % CAGR from 2026 to 2031. CDMOs with vertically integrated plasmid-to-fill capabilities are uniquely positioned to capitalise, as they can compress lead times by eliminating inter-company tech-transfer steps. While non-viral delivery technologies attract investor interest, they remain largely pre-commercial, so vector demand will likely outstrip supply through the end of the decade.


Phase: Commercial Scale-Up Challenges Traditional Models
Phase II projects constitute the largest slice of today’s workload, but commercial manufacturing is growing fastest, at an estimated 27.6 % CAGR. Late-stage sponsors are discovering that validation protocols designed for monoclonal antibodies do not automatically translate to living therapies. CDMOs that invested early in process analytical technologies are therefore winning contracts, as real-time monitoring meets regulators’ expectations for consistent product quality even in patient-specific batches.
Application: Clinical Manufacturing Dominates While Commercial Accelerates
Clinical manufacturing currently represents 73.60% of the market in 2025, reflecting the large number of therapies in development compared to those that have achieved commercial approval. However, commercial manufacturing is growing at a substantially faster rate (22.4% CAGR from 2026-2031) as more therapies receive regulatory approval and transition to commercial production. A strategic nuance is that many CDMOs now design clinical suites with future commercial retrofits in mind—larger airlocks, ceiling height for bigger bioreactors and scalable data infrastructure—so that upgrade cycles involve minimal downtime. Sponsors appreciate the foresight, knowing that any weeks-long shutdown could jeopardise launch timelines.
Mode of Operation: Outsourcing Reshapes Manufacturing Landscape
Contract/outsourced manufacturing dominates the market with a 64.40% share in 2025 and is growing at 18.1% CAGR (2026-2031), significantly outpacing in-house operations. Emerging biopharmaceutical companies, responsible for the majority of pipeline assets, seldom invest in captive capacity; instead, they form multiyear master-service agreements that lock in unit pricing while allowing schedule flexibility. Larger pharma firms are also divesting non-core facilities, channelling freed-up capital into pipeline acquisitions and digital-supply-chain upgrades.
Indication: Oncology Applications Lead Therapeutic Focus
Oncology remains the dominant indication cluster holding 34.60% share, propelled by CAR-T approvals that demonstrate clear survival benefits in haematologic cancers. Rare Diseases is emerging as fastest growing segment, propelling at CAGR of 17.9%. Rare cancer therapies typically pursue label expansions within one to two years, so CDMOs servicing oncology must maintain surge capacity. Conversely, rare disease programmes often cover small patient populations spread across multiple markets, making logistics coordination as important as bioreactor scale. Manufacturers that combine regional vector hubs with global release-testing centres can meet both demand profiles without sacrificing efficiency.
End User: Pharmaceutical Companies Drive Market Demand
Pharma and biotech companies anchor demand holding 41.50% share, yet academic and research institutes are playing a larger role by growing with CAGR of 18.2%. By running early-phase trials in on-site GMP suites, universities generate data packages attractive to venture backers, who then contract larger CDMOs for later-phase work. Hospital-based GMP units, meanwhile, have begun offering micro-production services for compassionate-use cases, carving out a niche that formal CDMOs may later absorb through partnership or acquisition.
Geography Analysis
North America’s 44.30% share reflects deep venture markets in 2025, mature regulatory frameworks, and a dense network of specialist CDMOs. The strategic placement of facilities near integrator air hubs in Louisville, Memphis, and Cincinnati shortens autologous vein-to-vein cycles, an operational advantage that now factors into payer reimbursement discussions.
Asia-Pacific’s projected 20.80% CAGR is driven by government incentives, workforce investments, and rapid patient adoption. Countries such as South Korea have enacted accelerated approval routes for regenerative treatments, spurring developers to build local capacity. Yet the region must still scale specialized training programs to avoid labor shortages that could erode its cost advantage.
Europe combines stringent but transparent regulation with robust academic networks. Manufacturers here are pioneering real-time release testing pilots, aiming to reduce batch-release timelines and offset higher wage costs. In addition, EU sustainability directives are nudging facilities toward greener single-use systems, a differentiator for sponsors with corporate-social-responsibility mandates.

Competitive Landscape
The market remains moderately consolidated around CDMOs that control critical capabilities—viral vectors, plasmid DNA and automated autologous systems. Novo Holdings’ USD 16.5 billion acquisition of Catalent reallocates some capacity to Novo Nordisk, tightening third-party slot availability and forcing smaller developers to lock in agreements earlier than planned [3]Morten Ulsted, “Novo Holdings to Acquire Catalent for USD 16.5 Billion,” Catalent Press Release, catalent.com. CDMOs with robust electronic batch-record platforms and transparent quality metrics are able to command premium pricing, reinforcing a quality-over-quantity paradigm.
White-space opportunities persist in cell-processing automation, closed upstream vector production and distributed point-of-care manufacturing. Smaller technology-centric firms that solve discrete pain points—such as real-time potency assays or high-density bioreactor liners—are attracting strategic investment from larger CDMOs seeking differentiation beyond raw capacity.
Cell And Gene Therapy Manufacturing Services Industry Leaders
Charles River Laboratories
Merck KGaA
Thermo Fisher Scientific Inc.
F. Hoffmann-La Roche Ltd
Fujifilm Holdings Corporation
- *Disclaimer: Major Players sorted in no particular order

Recent Industry Developments
- April 2025: Amgen confirmed a USD 900 million build-out of an Ohio advanced-therapy facility to meet anticipated commercial demand for its pipeline of cell and gene candidates
- December 2024: Novo Holdings announced its intent to purchase Catalent for USD 16.5 billion, planning subsequent asset transfers to Novo Nordisk and altering independent CDMO supply dynamics


Research Methodology Framework and Report Scope
Market Definitions and Key Coverage
Our study defines the cell and gene therapy manufacturing services market as revenue earned from outsourced and in-house GMP production of autologous or allogeneic cell therapies and viral or non-viral gene therapies, across clinical and commercial phases. Activities tracked include process development, vector production, cell banking, upstream and downstream processing, fill-finish, and related quality services.
Scope exclusion: sales of consumables, single-use equipment, and commercialized finished drugs are not counted.
Segmentation Overview
- By Service Type
- Cell Therapy Manufacturing Services
- Allogeneic
- Autologous
- Gene Therapy Manufacturing Services
- Viral Vector
- Adeno-Associated Virus (AAV)
- Lentivirus
- Retrovirus
- Non-Viral Vector
- Plasmid DNA
- Lipid Nanoparticles (LNP)
- Viral Vector
- Cell Therapy Manufacturing Services
- By Phase
- Pre-clinical
- Phase I
- Phase II
- Phase III
- Commercial
- By Application
- Clinical Manufacturing
- Commercial Manufacturing
- By Indication
- Oncology
- Rare Diseases
- Cardiovascular Diseases
- Orthopedic Diseases
- Infectious Diseases
- Other Indications
- By Mode of Operation
- In-house
- Contract / Outsourced
- By End User
- Pharmaceutical & Biotechnology Companies
- Academic & Research Institutes
- Hospital-Based GMP Units
- Other End Users
- By Geography
- North America
- United States
- Canada
- Mexico
- Europe
- Germany
- United Kingdom
- France
- Italy
- Spain
- Rest of Europe
- Asia-Pacific
- China
- Japan
- India
- South Korea
- Australia
- Rest of Asia-Pacific
- Middle East
- GCC
- South Africa
- Rest of Middle East
- South America
- Brazil
- Argentina
- Rest of South America
- North America
Detailed Research Methodology and Data Validation
Primary Research
Mordor analysts schedule structured calls with process engineers, QC managers, CDMO business-development leads, and hospital GMP unit directors across North America, Europe, and Asia Pacific. These conversations clarify true utilization rates, batch sizes, tech-transfer timelines, and price-discount corridors that are rarely disclosed in public reports.
Desk Research
We begin by mapping the industry landscape through public sources such as the US FDA's biological license approvals, EMA's ATMP registry, NIH clinical-trial databases, and customs shipment dashboards for vectors. Trade associations like ARM, ISCT, and PhRMA provide annual capacity and pipeline statistics that anchor early assumptions. Company 10-Ks, investment presentations, and press releases enrich our understanding of contract backlogs, facility footprints, and average selling prices. Paid repositories, D&B Hoovers for company financials and Dow Jones Factiva for deal news, supply hard revenue clues. This list is illustrative; many other sources guide data collection and gap checks.
Market-Sizing & Forecasting
A blended top-down and bottom-up construct is applied. We first size global demand using trial counts, average batches per trial, commercial patient pools, and typical doses per patient, which are then multiplied by validated service price bands to approximate spend. Supplier roll-ups for leading CDMOs, selective channel checks, and sampled ASP x volume math provide a reasonableness screen. Variables feeding the model include annual CGT product approvals, vector yield per liter, clean-room square footage coming online, average clinical success probabilities, and outsourcing penetration. Forecasts to 2030 rely on multivariate regression, with growth drivers vetted in expert panels before scenarios are finalized.
Data Validation & Update Cycle
Outputs pass a multi-level review where analysts reconcile unusual jumps against independent signals and re-contact sources if deviations exceed preset tolerances. Models refresh each year, with interim revisions triggered by major capacity additions or regulatory shifts, ensuring clients always receive the latest view.
Why Our Cell and Gene Therapy Manufacturing Services Baseline Is Trusted
Published values often diverge because firms pick different activity buckets, discount ladders, and refresh cadences.
Key gap drivers include: some providers lump consumables and vector plasmid supply into revenue; others quote only outsourced spend while Mordor integrates in-house production where financials are visible; a few forecasts assume uniform 30 percent annual ASP erosion, whereas our base case moderates price compression using primary-confirmed tiered contracts. Currency conversion years and differing trial-to-commercial transition rates add further spread.
Benchmark comparison
| Market Size | Anonymized source | Primary gap driver |
|---|---|---|
| USD 8.0 B | Mordor Intelligence | - |
| USD 23.1 B | Global Consultancy A | Includes consumables and vector raw materials, relies mainly on capacity announcements |
| USD 9.3 B | Industry Journal B | Omits in-house manufacturing and pre-clinical spend, limited primary validation |
In sum, our disciplined scoping, dual-source validation, and annual refresh cadence provide a balanced, traceable baseline that decision-makers can rely on with confidence.


Key Questions Answered in the Report
What is the projected cell and gene therapy manufacturing services market size in 2031?
The market size is forecast to reach USD 19.67 billion by 2031, reflecting sustained double-digit growth driven by expanding commercial approvals and capacity investments.
Which region is currently growing the fastest for cell and gene therapy manufacturing?
Asia–Pacific registers the highest CAGR, supported by favourable regulatory regimes, government incentives and significant foreign direct investment in specialised facilities.
Why are viral vectors considered a bottleneck in gene therapy manufacturing?
AAV and lentiviral vectors require complex, high-containment production environments, and global capacity remains limited; securing vector slots often dictates overall programme timelines.
What impact does outsourcing have on biopharma manufacturing strategy?
Outsourcing to CDMOs provides immediate access to expertise and infrastructure, reduces capital risk and is increasingly preferred by both large pharmaceutical companies and emerging biotechs.
Page last updated on:


