Carrier Screening Market Size and Share
Market Overview
| Study Period | 2020 - 2031 |
|---|---|
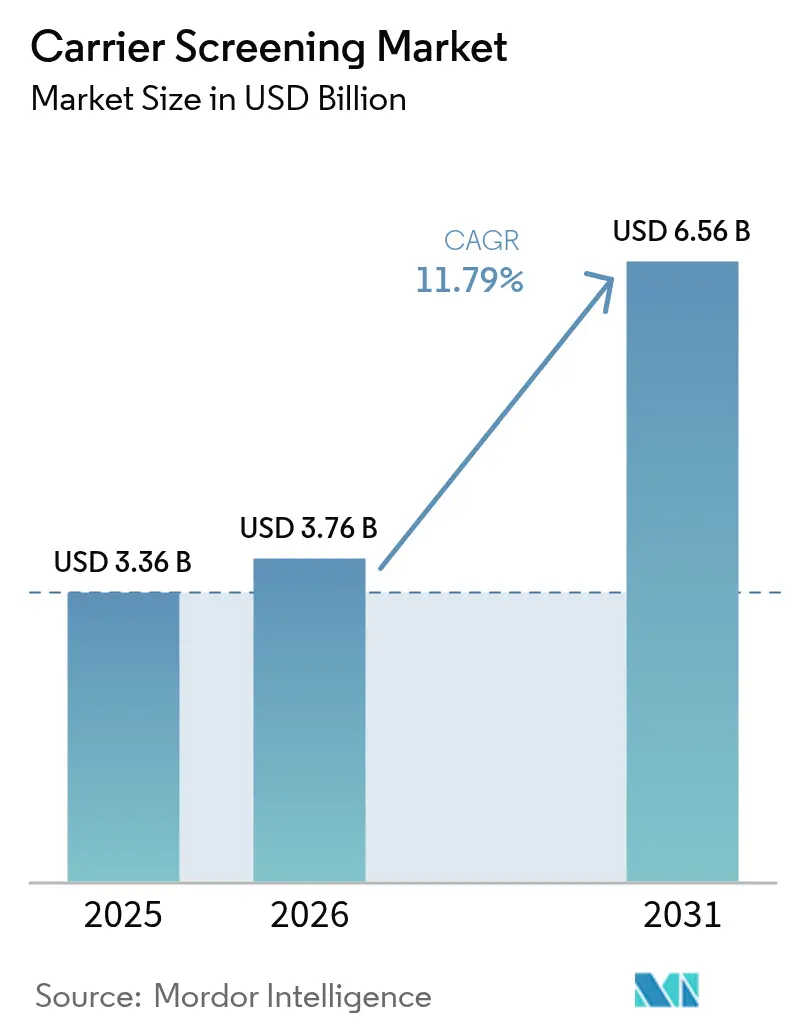
| Market Size (2026) | USD 3.76 Billion |
| Market Size (2031) | USD 6.56 Billion |
| Growth Rate (2026 - 2031) | 11.79% CAGR |
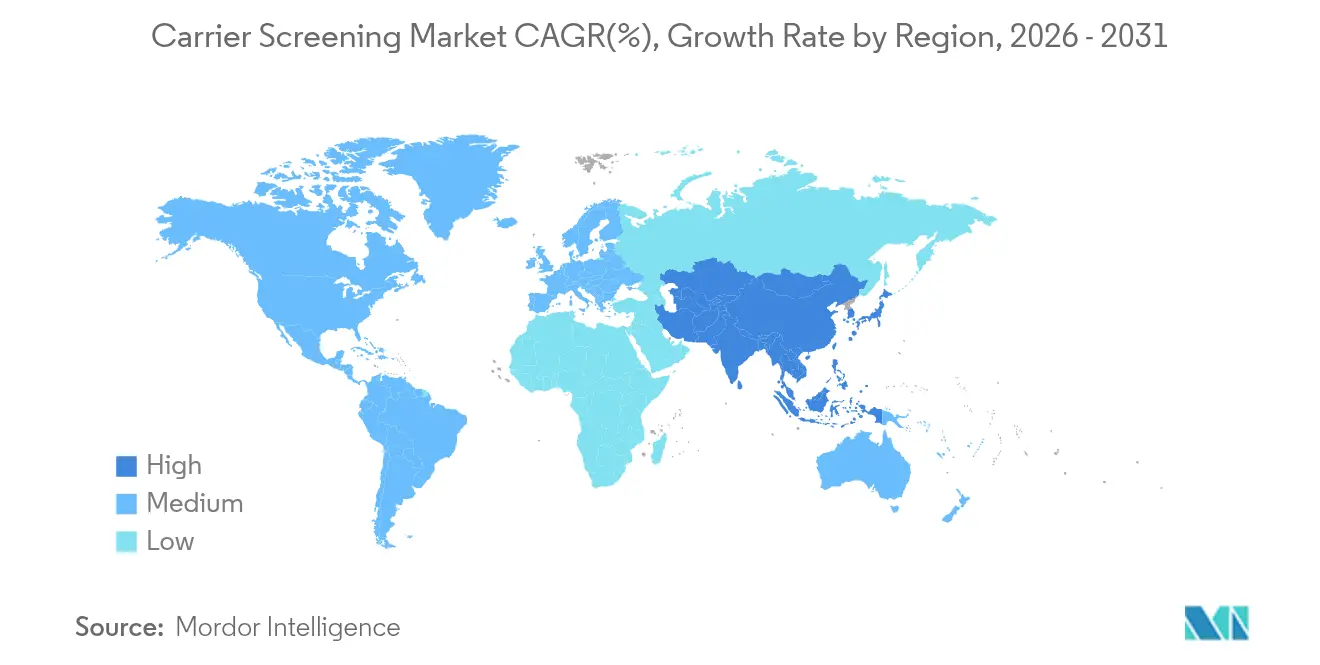
| Fastest Growing Market | Asia-Pacific |
| Largest Market | North America |
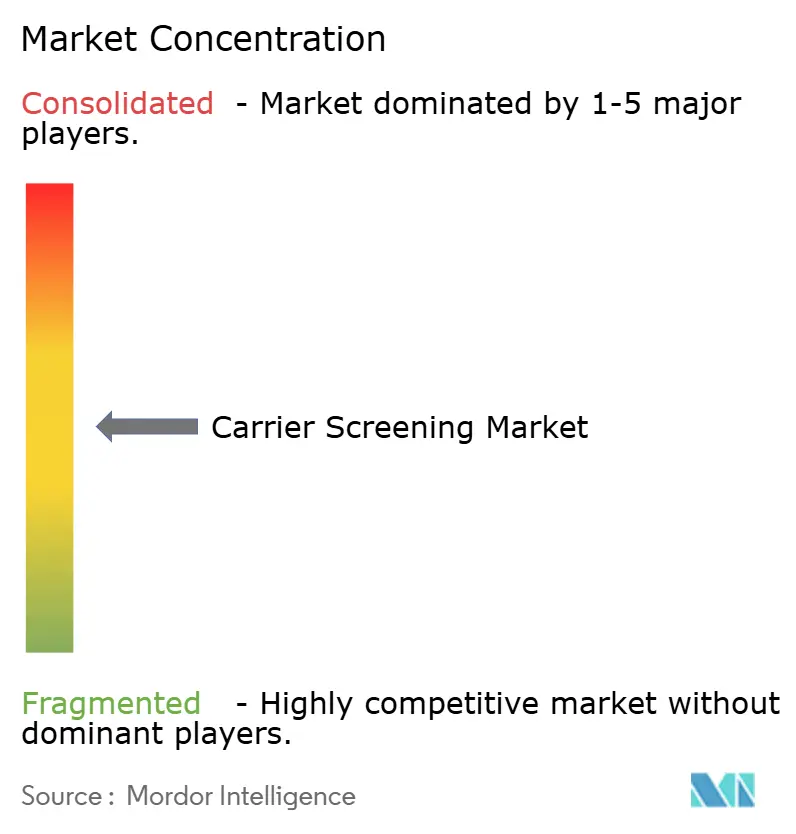
| Market Concentration | Medium |
Major Players *Disclaimer: Major Players sorted in no particular order Image © Mordor Intelligence. Reuse requires attribution under CC BY 4.0. | |
Carrier Screening Market Analysis by Mordor Intelligence
The global carrier screening market size in 2026 is estimated at USD 3.76 billion, growing from 2025 value of USD 3.36 billion with 2031 projections showing USD 6.56 billion, growing at 11.79% CAGR over 2026-2031. Growth stems from falling next-generation sequencing prices, tightening but clearer Laboratory Developed Test rules, and deeper integration of genetic screening across fertility medicine. Providers now weave carrier testing into routine reproductive decision-making, while employer genetic-benefit programs, wider insurance coverage, and population pilots boost test volumes. Consolidation among reference laboratories accelerates scale advantages, and multi-gene panel uptake signals a shift from single-gene assays toward broad, cost-effective genomic screens. At the same time, shortages of trained genetic counselors and uneven reimbursement temper near-term expansion, pressing stakeholders to adopt tele-genetics and AI-supported result interpretation.
Key Report Takeaways
- By test type, molecular screening captured 62.74% revenue share in 2025; biochemical assays trail yet remain clinically relevant.
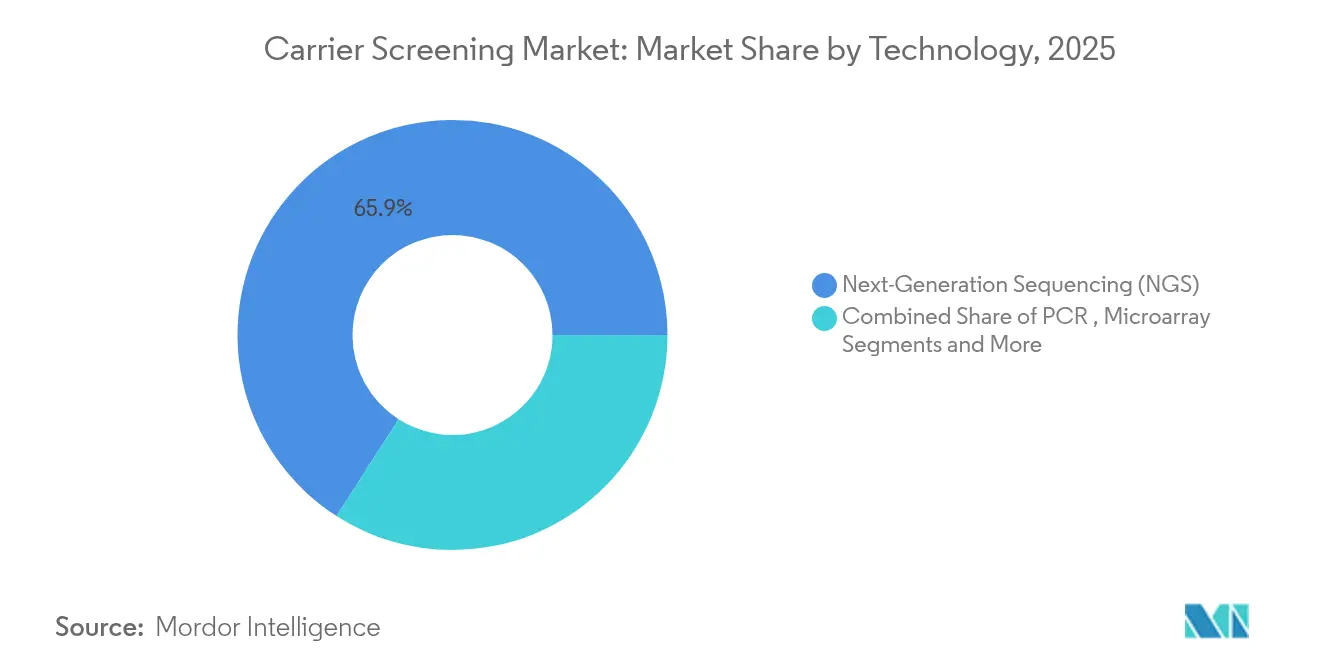
- By technology, next-generation sequencing led with 65.93% share in 2025 and is projected to advance at 14.98% CAGR to 2031.
- By disease, cystic fibrosis held 58.96% of the carrier screening market share in 2025, while spinal muscular atrophy posts the highest projected CAGR at 12.41% through 2031.
- By panel breadth, targeted single-gene tests claimed 46.12% of the carrier screening market size in 2025, but expanded multi-gene panels are set to expand at 13.95% CAGR.
- By end user, diagnostic laboratories accounted for 41.03% of the carrier screening market size in 2025 and are tracking 12.62% CAGR through 2031.
- By geography, North America dominated with 43.88% share in 2025; Asia-Pacific is the fastest-growing region with 13.32% CAGR.
Note: Market size and forecast figures in this report are generated using Mordor Intelligence’s proprietary estimation framework, updated with the latest available data and insights as of 2026.
Global Carrier Screening Market Trends and Insights
Drivers Impact Analysis*
| Driver | ( ~ ) % Impact on CAGR Forecast | Geographic Relevance | Impact Timeline |
|---|---|---|---|
| Increasing emphasis on early disease detection and prevention | +2.8% | North America and Europe with strong global spillover | Medium term (2-4 years) |
| Rising demand for personalized reproductive medicine | +2.1% | Developed markets worldwide | Long term (≥ 4 years) |
| Declining NGS costs enabling expanded panels | +3.2% | Fast uptake in Asia-Pacific with global relevance | Short term (≤ 2 years) |
| Integration of carrier screening in IVF and ART protocols | +1.9% | North America and Europe and emerging Asia-Pacific | Medium term (2-4 years) |
| Employer-sponsored genetic-benefit programs | +1.1% | Predominantly North America | Medium term (2-4 years) |
| Payer mandates tied to population pilots | +1.4% | North America and select European and Australian markets | Long term (≥ 4 years) |
| Source: Mordor Intelligence | |||
Increasing Emphasis on Early Disease Detection and Prevention
Payers and public-health agencies increasingly see comprehensive genomic screening as a cost-saving path rather than a discretionary service. Australia’s microsimulation of 569 recessive disorders predicted 2,067 affected births avoided at 50% test uptake, dwarfing outcomes from limited panels.[1]Tamar Nov-Klaiman, Ruth Horn & Aviad Raz, “More of the Same? Israel's Expanded Carrier Screening for Cystic Fibrosis,” Nature, nature.comLarge newborn initiatives in the United Kingdom and New York City covering 200,000 infants further spotlight the pivot toward preventive genomics.[2]Jocelyn Kaiser, “Sequencing Projects Will Screen 200,000 Newborns for Disease Genes,” Science, science.orgGeisinger’s MyCode program found clinically actionable results in 1 in 30 participants, most of whom were unaware of inherited risks. These demonstrations of clinical and fiscal value propel wider adoption of broad multi-gene carrier screening, cementing preventive genomics as routine care.
Rising Demand for Personalized Reproductive Medicine
Assisted reproduction now defaults to genetic scrutiny for both partners. Johns Hopkins Fertility Center recommends expanded panels covering more than 400 recessive conditions for every patient regardless of ancestry. Non-invasive embryo assays allow preimplantation genetic assessment without biopsy-related viability concerns, easing patient acceptance. Australia’s Medicare reimbursement for reproductive carrier screening underscores official endorsement of such proactive planning. Couples now desire genomic clarity before pregnancy, pushing clinics to embed carrier testing into routine fertility workflows and lifting test volumes within the carrier screening market.
Declining NGS Costs Enabling Expanded Panels
Whole-genome sequencing has fallen from USD 100 million in 2001 to just over USD 500 in 2023.[3]WIPO Global Health Unit, “Measuring Genome Sequencing Costs and Its Health Impact,” World Intellectual Property Organization, wipo.intIllumina’s USD 600 genome and Ultima’s USD 100 genome now make comprehensive multi-gene panels as affordable as legacy single-gene tests. The University of Minnesota processes 320 whole genomes weekly on the UG 100, expanding capacity for population pilots. Cheap sequencing lowers per-condition costs and incentivizes payers to reimburse broader panels, intensifying growth of the carrier screening market.
Integration of Carrier Screening in IVF and ART Protocols
Professional societies have broadened panel requirements; the American College of Medical Genetics now recommends testing 100 CFTR variants instead of 23. IVF centers embed screening into cycle planning to choose optimal gametes or embryos. Belgium’s BabyDetect pilot screened 165 disorders at birth with 90% parental acceptance, showing high receptivity to genomic data. The seamless alignment of genetic counseling, laboratory workflows, and reproductive decisions deepens clinical demand and fortifies the carrier screening market trajectory.
Restraints Impact Analysis*
| Restraint | (~) % Impact on CAGR Forecast | Geographic Relevance | Impact Timeline |
|---|---|---|---|
| High costs and inconsistent reimbursement | −1.8% | Most acute in emerging nations | Short term (≤ 2 years) |
| Ethical and psychosocial concerns over incidental findings | −0.9% | Markets with established bioethics regulation | Long term (≥ 4 years) |
| Limited genetic-counseling workforce capacity | −1.4% | Global with rural concentration | Medium term (2-4 years) |
| Data-privacy regulations limiting secondary data use | −0.7% | Europe and North America and expanding Asia-Pacific | Long term (≥ 4 years) |
| Source: Mordor Intelligence | |||
High Costs and Inconsistent Reimbursement
UnitedHealthcare explicitly excludes carrier tests from Medicare Advantage coverage, and limited CPT codes complicate claims for novel panels. Belgium recorded EUR 365 per newborn genomic test, well above conventional screens, challenging health-system budgets. Fragmented policies slow the spread of comprehensive screening in lower-income regions.
Limited Genetic-Counseling Workforce Capacity
Acceptance rates for genetic-counseling graduates fell to 30% by mid-2024, underscoring supply shortages. The US projects only 600 new counselors this decade, insufficient for soaring demand. Limited counseling delays result disclosure, prolongs care pathways, and could dampen the pace at which the carrier screening market scales.
*Our forecasts treat driver/restraint impacts as directional, not additive. The impact forecasts reflect baseline growth, mix effects, and variable interactions.
Segment Analysis
By Test Type: Molecular Dominance Drives Innovation
Molecular assays commanded 62.74% of 2025 revenue and are advancing at 12.98% CAGR, eclipsing biochemical methods in sensitivity and multiplexing scope. This dominance propels the carrier screening market as providers prefer direct variant detection over indirect metabolite proxies. The Comprehensive Analysis of Thalassemia Alleles protocol in southern China illustrates the efficacy of ultra-high-throughput sequencing where carrier prevalence exceeds 16%.
Biochemical screens still matter for enzyme or protein conditions and blend well with genomic assays in newborn programs such as Belgium’s BabyDetect. Economic analyses confirm tandem mass spectrometry’s value in certain metabolic scenarios, ensuring that diversified testing menus persist alongside molecular expansion.


By Disease Type: Cystic Fibrosis Leadership Amid SMA Surge
Cystic fibrosis retained 58.96% share in 2025 thanks to universal guidelines and payer familiarity, securing a large slice of the carrier screening market share. Expanded 100-variant CFTR panels raise detection rates in multiethnic populations.
Spinal muscular atrophy, projected at 12.41% CAGR, benefits from transformative therapies and inclusion in most newborn panels. Ancestry-driven programs for Tay-Sachs, Gaucher, and sickle cell disease continue, while rare autosomal recessive conditions gain traction as sequencing costs fall.
By Panel Type: Expansion Beyond Targeted Approaches
Targeted single-gene panels still held 46.12% of the carrier screening market size in 2025, yet expanded multi-gene panels are scaling at 13.95% CAGR on the back of sub-USD 200 genome economics. LabCorp’s Inheritest product suite exemplifies broad panels that streamline risk stratification across heterogeneous ancestry groups.
Ethnicity-specific panels persist where founder mutations dominate, but the march toward universal expanded screening is clear. Thailand’s exome-wide carrier survey found pathogenic variants in 34% of individuals, proving comprehensive panels expose clinically actionable risks otherwise unrecognized.
By Technology: NGS Acceleration Transforms Market Dynamics
Next-generation sequencing contributed 65.93% of revenue in 2025 and is growing fastest at 14.98% CAGR as system throughput soars. Illumina’s NovaSeq X processes 64 genomes per flow cell, while its 5-base chemistry merges genomic and epigenomic reads for richer insights.
Polymerase chain reaction retains value for rapid confirmatory testing, and microarrays continue for structural variation analysis. Third-generation platforms shine in repeat-rich or structurally complex loci; China’s application in thalassemia underscores future hybrid approaches.
By End User: Laboratory Consolidation Reshapes Service Delivery
Diagnostic labs comprise 41.03% of the carrier screening market size with 12.62% growth projected, aided by M&A that pools bioinformatics, wet-lab, and counseling assets. LabCorp’s USD 239 million Invitae purchase and subsequent alliance with Ultima Genomics typify a push toward population-scale sequencing services.
Hospitals and clinics increasingly bring carrier screening in-house, bolstered by guidelines from health systems such as Penn Medicine. IVF centers and physician offices remain pivotal in preconception workflows, while academic consortia like Virginia’s PrIMeD demonstrate research-driven community outreach. Tele-genetics vendors offer scalable counseling, alleviating workforce constraints and broadening the carrier screening market reach.
Geography Analysis
North America secured 43.88% revenue in 2025 on the strength of employer genetic benefits, robust counseling networks, and an FDA framework that balances oversight with innovation. Geisinger’s MyCode enrollment surpassed 175,000 individuals, evidencing appetite for population genomics. South Carolina’s In Our DNA initiative recruited 50,000 participants toward a 100,000 goal, reinforcing state-level momentum.
Asia-Pacific exhibits the strongest growth at 13.32% CAGR. China’s iHope project assisted 513 rare-disease families by mid-2024 and targets 1,800 by 2026, while national thalassemia screening addresses carrier rates up to 24% in southern provinces. Australia’s Medicare-funded panels set a regional precedent for reimbursement.
Europe records balanced expansion. The UK aims to sequence 100,000 newborn genomes, while Belgium’s 90% parental acceptance rates for genomic newborn screening prove public trust. Israel’s Ministry of Health funds a 650-variant program comprising 290 genes, underlining governmental support for broad panels.

Competitive Landscape
The carrier screening market is moderately consolidated. LabCorp’s asset acquisition and Natera’s USD 52.5 million reproductive portfolio purchase reconfigure competitive hierarchies. Quest Diagnostics added digital pathology through PathAI to bolster AI analytics amid pathologist shortages. Myriad Genetics secured a foundational patent for molecular residual disease assays, reinforcing its IP moat.
Technology differentiation thrives. Illumina readies spatial transcriptomics and combinatorial multiomic workflows, and Roche earned FDA Breakthrough status for an Lp(a) assay targeting hereditary cardiovascular risk, showcasing a pivot to integrated risk profiling. AI-powered variant interpretation tools aim to counter counseling bottlenecks and expedite result delivery.
White-space opportunities include employer benefits, low-and-middle income population pilots, and AI tele-counseling platforms. As payer mandates expand and sequencing costs decline, integrated firms able to couple laboratory throughput with digital counseling and analytics hold competitive advantage within the carrier screening market.
Carrier Screening Industry Leaders
Illumina Inc.
Thermo Fisher Scientific Inc.
Abbott Laboratories
F.Hoffmann-La Roche Ltd
Danaher Corporation (Cepheid)
- *Disclaimer: Major Players sorted in no particular order

Recent Industry Developments
- June 2025: Myriad Genetics Inc. announced early access launch of its FirstGene Multiple Prenatal Screen through a large-scale clinical study.
- May 2025: BillionToOne Inc. launched an expanded offering for providers using the UNITY Fetal Risk Screen.
- March 2025: Bio-Techne’s Asuragen partnered with Oxford Nanopore Technologies to release the AmplideX Nanopore Carrier Plus Kit for research carrier screening.
- August 2024: LabCorp finalized acquisition of select Invitae assets, enhancing leadership in genetic testing for oncology and rare diseases while integrating advanced genetic testing with existing services.


Research Methodology Framework and Report Scope
Market Definitions and Key Coverage
According to Mordor Intelligence, the carrier screening market covers all commercial genetic tests that detect autosomal-recessive or X-linked variants in prospective parents before conception or in early pregnancy, while capturing revenue from both test kits and the associated laboratory services.
Screening conducted purely for research, newborn metabolic panels, and direct-to-consumer ancestry offerings are outside the scope.
Segmentation Overview
- By Test Type
- Molecular Screening Tests
- Biochemical Screening Tests
- By Disease Type
- Cystic Fibrosis
- Tay-Sachs Disease
- Gaucher Disease
- Sickle Cell Disease
- Spinal Muscular Atrophy
- Other Autosomal Recessive Disorders
- By Panel Type
- Targeted Single-Gene Panels
- Ethnicity-Specific Panels
- Expanded Multi-Gene Panels
- By Technology
- Next-Generation Sequencing (NGS)
- Polymerase Chain Reaction (PCR)
- Microarrays
- Others
- By End-User
- Hospitals & Clinics
- Diagnostic Laboratories
- Physician Offices & IVF Centers
- Academic & Research Institutes
- By Geography
- North America
- United States
- Canada
- Mexico
- Europe
- Germany
- United Kingdom
- France
- Italy
- Spain
- Rest of Europe
- Asia-Pacific
- China
- Japan
- India
- Australia
- South Korea
- Rest of Asia-Pacific
- Middle East and Africa
- GCC
- South Africa
- Rest of Middle East and Africa
- South America
- Brazil
- Argentina
- Rest of South America
- North America
Detailed Research Methodology and Data Validation
Primary Research
Mordor analysts interviewed genetic counselors, laboratory directors, and fertility clinicians across North America, Europe, and Asia-Pacific. Discussions clarified real-world panel pricing, typical uptake among high-risk couples, and expected NGS turnaround improvements, guiding adjustments to secondary assumptions.
Desk Research
Our team began with open datasets anchoring live-birth counts, such as the CDC National Vital Statistics, Eurostat, and UNDESA. Guidelines from ACOG, the National Society of Genetic Counselors, and the WHO framed prevalence rates and recommended panel breadth. Annual filings and investor decks informed laboratory revenue splits, while Dow Jones Factiva news archives and D&B Hoovers profiles helped verify capacity shifts. Patent activity monitored through Questel signaled technology uptake. This list is illustrative; many additional public sources supported data gathering and clarification.
Market-Sizing & Forecasting
A blended top-down model converts country live-birth numbers into a testable couple pool, multiplies that by carrier prevalence, guideline-driven uptake, and the average panel price. Supplier roll-ups and channel checks offer bottom-up reasonableness tests before totals are finalized. Key variables tracked include NGS share of tests, payer reimbursement ratios, fertility clinic visit volumes, live-birth trends, and panel average selling price. Multivariate regression projects these drivers, with scenario bands for guideline expansion.
Data Validation & Update Cycle
Outputs pass three layers of peer review, variance checks against historical sales signals, and anomaly flags that trigger re-contact. The database refreshes annually; material events such as new universal screening mandates prompt mid-cycle updates so clients receive the latest view.
Why Mordor's Carrier Screening Baseline Stands Up
Published figures often diverge because firms vary in panel mix, pricing logic, and refresh cadence. Our disciplined scope alignment and yearly checks keep the baseline steady yet current.
Key gap drivers include some rivals counting only kit revenues, others applying one global ASP, and a few extrapolating pandemic-era volumes without adjusting for postponed pregnancies. Mordor factors all revenue streams, models regional ASP curves, and normalizes anomalies before projection.
Benchmark comparison
| Market Size | Anonymized source | Primary gap driver |
|---|---|---|
| USD 3.36 B (2025) | Mordor Intelligence | - |
| USD 3.17 B (2025) | Global Consultancy A | Counts only expanded panels and applies uniform 16 % CAGR globally |
| USD 2.66 B (2024) | Market Data Provider B | Excludes prenatal tests and uses single ASP across countries |
| USD 1.26 B (2023) | Research Publisher C | Bases model on 2022 data and omits NGS-driven adoption gains |
The comparison shows that, by considering the full revenue chain and refreshing inputs each year, Mordor Intelligence delivers a balanced, transparent baseline that decision-makers can rely on.


Key Questions Answered in the Report
What is the current value of the carrier screening market?
The carrier screening market is valued at USD 3.76 billion in 2026 and is forecast to reach USD 6.56 billion by 2031 at an 11.79% CAGR.
Which technology drives the fastest growth within the carrier screening market?
Next-generation sequencing holds 65.93% revenue share and is expanding at 14.98% CAGR, making it the market’s primary growth driver.
Why are expanded multi-gene panels gaining momentum?
Sequencing costs have fallen below USD 600 per genome, allowing laboratories to offer comprehensive panels that detect hundreds of conditions at prices comparable to legacy single-gene tests.
How does the shortage of genetic counselors affect market growth?
Limited counselor availability lengthens result-turnaround times and may slow adoption in regions without tele-genetic solutions, creating operational bottlenecks.
Which region is growing fastest and why?
Asia-Pacific is pacing the market with 13.32% CAGR as China, Australia, and Japan fund large-scale screening programs and clarify laboratory-test regulations.
What are the main reimbursement challenges?
Coverage varies widely; some US Medicare Advantage plans exclude carrier testing, and limited CPT codes complicate billing, deterring labs from rolling out new panels in certain markets.
Page last updated on:


