
Cardiac Mapping Market Size and Share
Market Overview
| Study Period | 2020 - 2031 |
|---|---|
| Market Size (2026) | USD 2.36 Billion |
| Market Size (2031) | USD 3.62 Billion |
| Growth Rate (2026 - 2031) | 8.88 % |
| Fastest Growing Market | Asia-Pacific |
| Largest Market | North America |
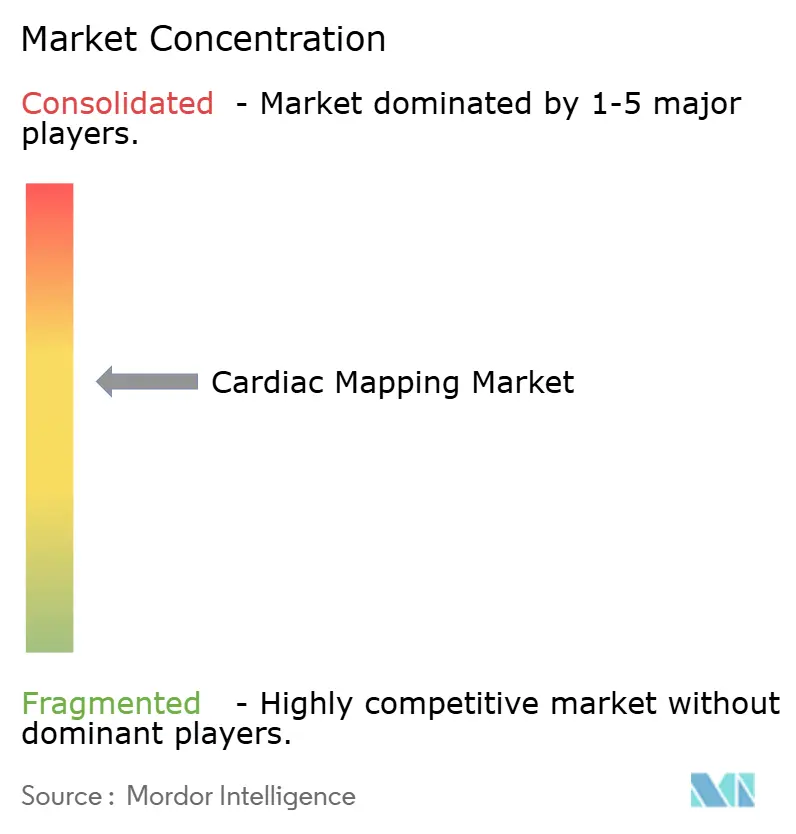
| Market Concentration | Medium |
Major Players *Disclaimer: Major Players sorted in no particular order Image © Mordor Intelligence. Reuse requires attribution under CC BY 4.0. | |
Cardiac Mapping Market Analysis by Mordor Intelligence
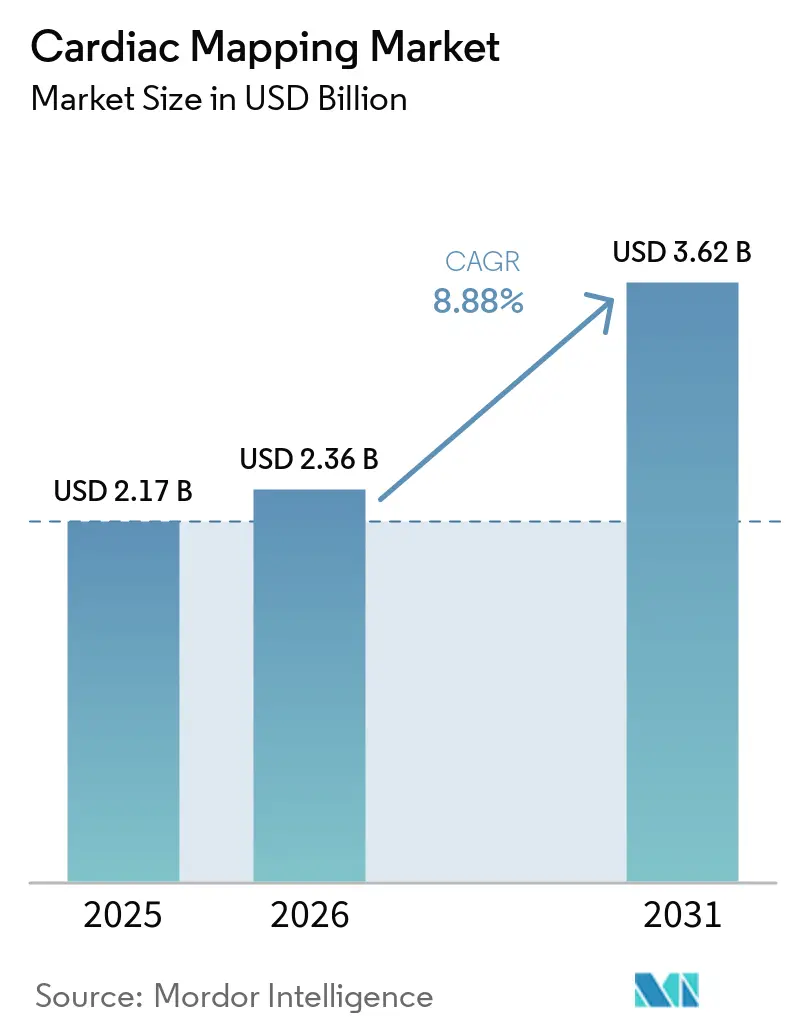
The cardiac mapping market size was valued at USD 2.17 billion in 2025 and estimated to grow from USD 2.36 billion in 2026 to reach USD 3.62 billion by 2031, at a CAGR of 8.88% during the forecast period (2026-2031). North America leads with 43.12% revenue share in 2024, yet Asia-Pacific delivers the fastest 9.54% CAGR as hospital networks add electrophysiology capacity and embrace artificial-intelligence-enabled platforms. Demand accelerates because atrial fibrillation affects more than 60 million people worldwide, compelling providers to adopt precision mapping systems that shorten procedures and cut readmissions. Contact technologies still command 64.23% share, but non-contact innovations are expanding at 10.43% CAGR on the back of ultrasound and body-surface algorithms that reduce fluoroscopy time. Competitive intensity has elevated since 2024 as manufacturers introduce dual-energy ablation and AI-guided navigation, while hospitals pivot toward same-day discharge models that trim per-case costs by EUR 850-1,301. Reimbursement headwinds—such as a 2.8% CMS conversion-factor cut for 2025—push administrators to extract higher throughput and verifiable outcomes from every device purchase.
Key Report Takeaways
- By product type, contact mapping systems held 63.45% of the cardiac mapping market share in 2025, while non-contact platforms posted the fastest 10.12% CAGR through 2031.
- By indication, atrial fibrillation accounted for 57.92% of the cardiac mapping market size in 2025; ventricular tachycardia is projected to expand at an 11.45% CAGR during 2026-2031.
- By end-user, tertiary hospitals led with 54.66% share in 2025, whereas ambulatory surgical centers are forecast to grow at an 11.25% CAGR to 2031.
- By geography, North America captured 42.55% revenue share in 2025; Asia-Pacific is advancing quickest at a 9.21% CAGR throughout the forecast period.
Note: Market size and forecast figures in this report are generated using Mordor Intelligence’s proprietary estimation framework, updated with the latest available data and insights as of 2026.
Market Trends and Insights
Drivers Impact Analysis of Cardiac Mapping Market*
| Driver | % Impact on CAGR Forecast | Geographic Relevance | Impact Timeline |
|---|---|---|---|
| Growing burden of cardiovascular diseases | +2.1% | Global; strongest in North America & Asia-Pacific | Long term (≥4 years) |
| Advancements in electrophysiology mapping technologies | +1.8% | Global; led by North America & Europe | Medium term (2-4 years) |
| Increasing adoption of minimally invasive ablation procedures | +1.5% | Global; rapid uptake in Asia-Pacific | Medium term (2-4 years) |
| Favorable regulatory and reimbursement policies | +1.2% | North America & Europe | Short term (≤2 years) |
| Expansion of cardiac electrophysiology infrastructure in emerging markets | +1.0% | Asia-Pacific, Middle East & Africa | Long term (≥4 years) |
| Integration of artificial intelligence and cloud analytics in mapping workflows | +0.8% | Global; early adoption in developed markets | Medium term (2-4 years) |
| Source: Mordor Intelligence | |||
Growing Burden of Cardiovascular Diseases
Atrial fibrillation prevalence doubled in South Korea from 1.1% to 2.2% of adults between 2013 and 2022, illustrating how aging populations and lifestyle factors magnify arrhythmia caseloads[1]Hyeon-Cheol Gwon, “AF Prevalence Trends in Korea,” International Journal of Arrhythmia, ijarrhythmia.org. Higher CHA₂DS₂-VASc scores and multiple comorbidities mean physicians need granular electrical roadmaps to guide targeted lesions. More than 9,500 clinicians attended Heart Rhythm 2024, underscoring infrastructural expansion and professional focus on electrophysiology. Emerging economies mirror this trajectory as cardiovascular disease incidence rises alongside urbanization. Hospitals therefore allocate larger capital budgets to high-density mapping consoles, ensuring readiness for a patient cohort that will persist for decades. The result is predictable, long-cycle demand that anchors the cardiac mapping market.
Advancements in Electrophysiology Mapping Technologies
Randomized evidence confirms technology gains: the TAILORED-AF study reported 88% 12-month freedom-from-AF when AI directed lesion sets, eclipsing the 70% rate for routine pulmonary vein isolation[2]TAILORED-AF Investigators, “AI-Guided Ablation Outcomes,” Nature Medicine, nature.com. Hardware moves in lockstep, with 64-electrode catheters embedding contact-force sensors that relay sub-gram accuracy in real time. Companies such as Volta Medical and GE Healthcare combine algorithmic mapping with established recording systems, creating integrated ecosystems. Pulsed field ablation shifts lesion creation from thermal to non-thermal energy, with trials documenting 100% acute PV isolation and minimal oesophageal impact. Continuous innovation imposes upgrade pressure on hospitals that wish to maintain competitive clinical outcomes and referral volumes. Consequently, capital budgets for mapping platforms remain resilient even in constrained reimbursement environments.
Increasing Adoption of Minimally Invasive Ablation Procedures
Health systems increasingly discharge ablation patients on the same day, a model proven non-inferior to overnight observation while improving satisfaction and resource utilization. Pulsed field ablation trims procedure time and reduces post-operative complications, reinforcing the shift toward outpatient pathways. Regulators back the trend; in 2024 the FDA cleared Boston Scientific’s FARAPULSE and Medtronic’s Affera systems, validating PFA safety and efficacy. As electrophysiologists gain familiarity with new energy sources and catheters, peer-to-peer diffusion accelerates adoption curves. The economic argument is decisive: independent analyses show cumulative savings of EUR 850-1,301 per patient compared with conventional thermal techniques. These clinical and financial advantages collectively enlarge the cardiac mapping market because every ablation relies on accurate electro-anatomical imaging.
Integration of Artificial Intelligence and Cloud Analytics in Mapping Workflows
Artificial intelligence transforms mapping consoles into predictive engines. Johns Hopkins researchers built an MRI-based model that predicted sudden cardiac death risk with nearly 90% accuracy. Real-time guidance further shortens procedures; algorithms terminated AF acutely in 40% of cases and kept 70% of patients arrhythmia-free over two years. Cloud connectivity allows every case to refine neural-network weights, improving performance on subsequent patients. Vendors such as Vektor Medical claim 23% shorter procedures and 18% higher lab throughput using AI-assisted localization. As reimbursement increasingly ties payment to quality metrics, AI-enhanced accuracy and efficiency create compelling value propositions that fuel equipment purchases.
Restraints Impact Analysis of Cardiac Mapping Market*
| Restraints Impact Analysis | (~) % Impact on CAGR Forecast | Geographic Relevance | Impact Timeline |
|---|---|---|---|
| Shortage of skilled electrophysiologists | -1.4% | Global; most acute in emerging markets | Long term (≥ 4 years) |
| High capital and procedural costs | -1.1% | Global; strongest in price-sensitive markets | Medium term (2-4 years) |
| Cybersecurity and patient data privacy concerns | -0.9% | Global; heightened focus in developed markets | Short–medium term (≤ 4 years) |
| Semiconductor supply chain vulnerabilities | -0.7% | Global; most pronounced in Asia-Pacific manufacturing hubs | Short term (≤ 2 years) |
| Source: Mordor Intelligence | |||
Shortage of Skilled Electrophysiologists
Fellowship programs cannot match demand; US training pipelines deliver too few specialists according to the Journal of the American College of Cardiology. Emerging markets feel the pinch more acutely because hospital expansion outstrips staff growth. AdventHealth built an 8-month orientation curriculum covering 48 team members to accelerate in-house capability, yet the gap persists. Skill shortages delay utilization of installed systems and lengthen patient wait times. Vendors respond with automation and intuitive user interfaces to reduce learning curves. Health systems also explore tele-mentoring, yet credentialling and liability frameworks remain underdeveloped, extending the constraint’s long-term influence on the cardiac mapping market.
High Capital and Procedural Costs
Full-function mapping suites and pulsed field generators require large upfront outlays. Even though PFA cuts operating-room time, cost-effectiveness models can be marginal in price-sensitive environments, as detailed in Innovations in Cardiac Rhythm Management. Medicare’s 2.8% payment reduction for 2025 sharpens hospital focus on return-on-investment. Capital committees now demand clear data on reduced complications and shortened length of stay before approving purchases. Some suppliers offer value-based contracting where payment depends on achieving specific outcome benchmarks. The trend favors technologies that deliver measurable efficiency while avoiding incremental disposables that inflate per-case costs.
*Our forecasts treat driver/restraint impacts as directional, not additive. The impact forecasts reflect baseline growth, mix effects, and variable interactions.
Cardiac Mapping Market Segment Analysis
By Product Type:
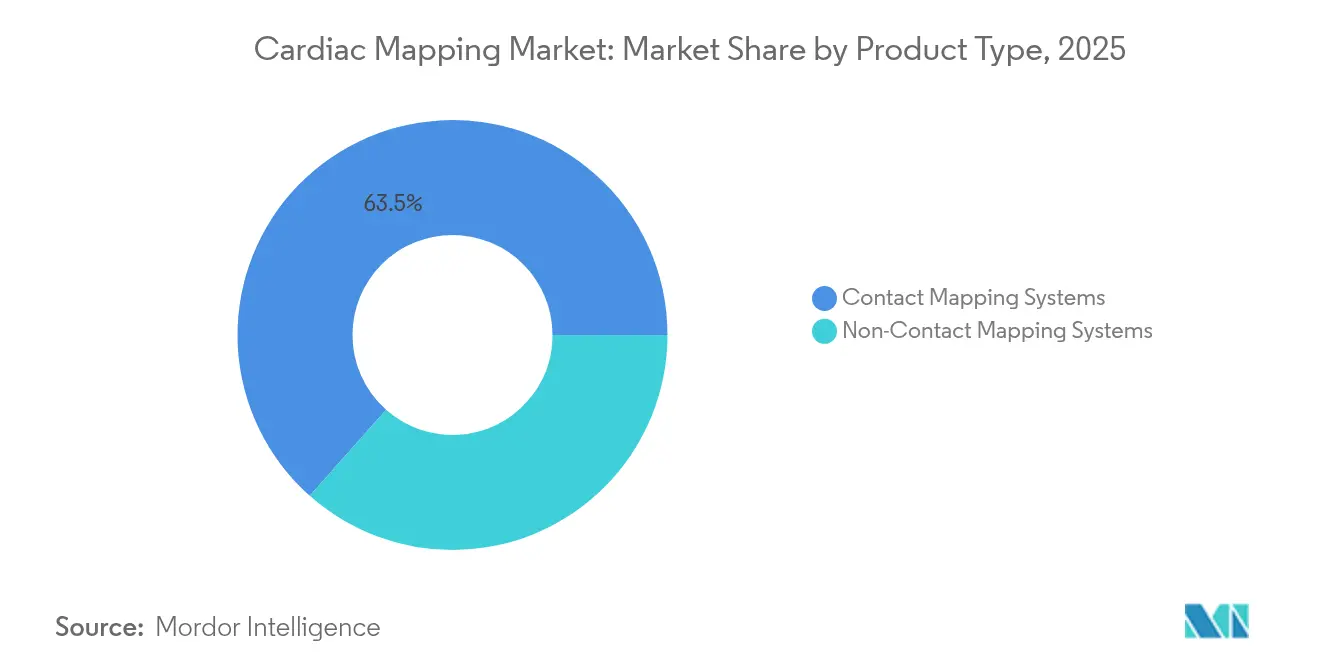
Contact Systems Dominate Despite Non-Contact InnovationContact platforms delivered 63.45% of the cardiac mapping market size in 2025 owing to widespread clinical familiarity, robust reimbursement, and improvements such as 64-electrode grids that yield sub-millimeter resolution. Abbott’s TactiCath catheter registers 0.3 gram precision that helps operators titrate energy safely. The segment’s momentum is fortified by integration with popular ablation generators, ensuring procedural continuity.
Non-contact modalities are advancing at a 10.12% CAGR because AI body-surface algorithms and ultrasound acoustical sensors can reconstruct 3-D chambers without extensive catheter manipulation, thereby reducing fluoroscopy exposure. Basket and multi-electrode arrays provide panoramic data that identifies extra-pulmonary triggers overlooked by point-by-point systems. Hybrid workflows merge contact accuracy for lesion validation with global non-contact scans that guide strategy, illustrating technology convergence that will sustain segment diversity within the cardiac mapping market.



By Indication:
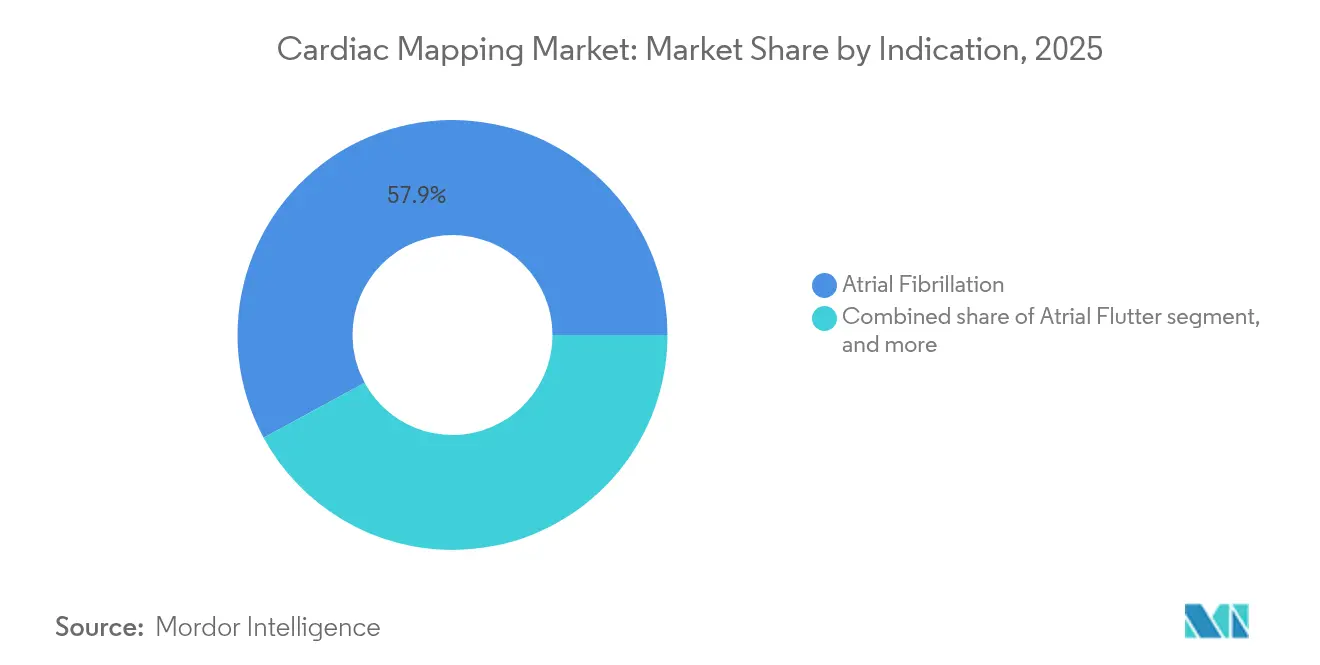
Atrial Fibrillation Leadership Faces VT ChallengeAtrial fibrillation represented 57.92% of the cardiac mapping market share during 2025 on the strength of a vast patient pool and standardized procedural pathways. Over 12 million Americans are projected to carry an AF diagnosis within ten years, guaranteeing steady procedural volumes. PFA platforms already post 88% arrhythmia-free survival at one year, enhancing position.
Ventricular tachycardia is growing fastest at 11.45% CAGR because substrate mapping innovations like the S3 technique raise long-term success to 77.9%. Although VT cases are fewer, they carry higher mortality risk, motivating tertiary centers to procure sophisticated 3-D systems that image intramural circuits. Personalised AI-guided maps now tailor lesions based on real-time conduction patterns, narrowing the efficacy gap between VT and AF treatments and expanding the cardiac mapping market size among high-acuity patients.
By End-User:
Hospital Dominance Shifts Toward Ambulatory CareTertiary hospitals captured 54.66% revenue because they house multidisciplinary teams, hybrid operating rooms, and advanced imaging that underpin complex ablations. They act as reference sites where vendors launch upgrades and collect early-use data.
Ambulatory surgical centers are projected to grow at 11.25% CAGR since same-day discharge protocols have proven safe and cost-efficient. Portable consoles, simplified workflows, and regulatory discussion around ASC inclusion for catheter ablations accelerate this move. Electrophysiology labs embedded within community hospitals compete on volume efficiency, while academic institutes emphasize first-in-human trials and upgrades to 3d cardiac mapping systems that support advanced ablation procedures. This care-setting diversification enlarges the cardiac mapping market by deploying systems beyond flagship institutions.
Geography Analysis
North America Cardiac Mapping Market
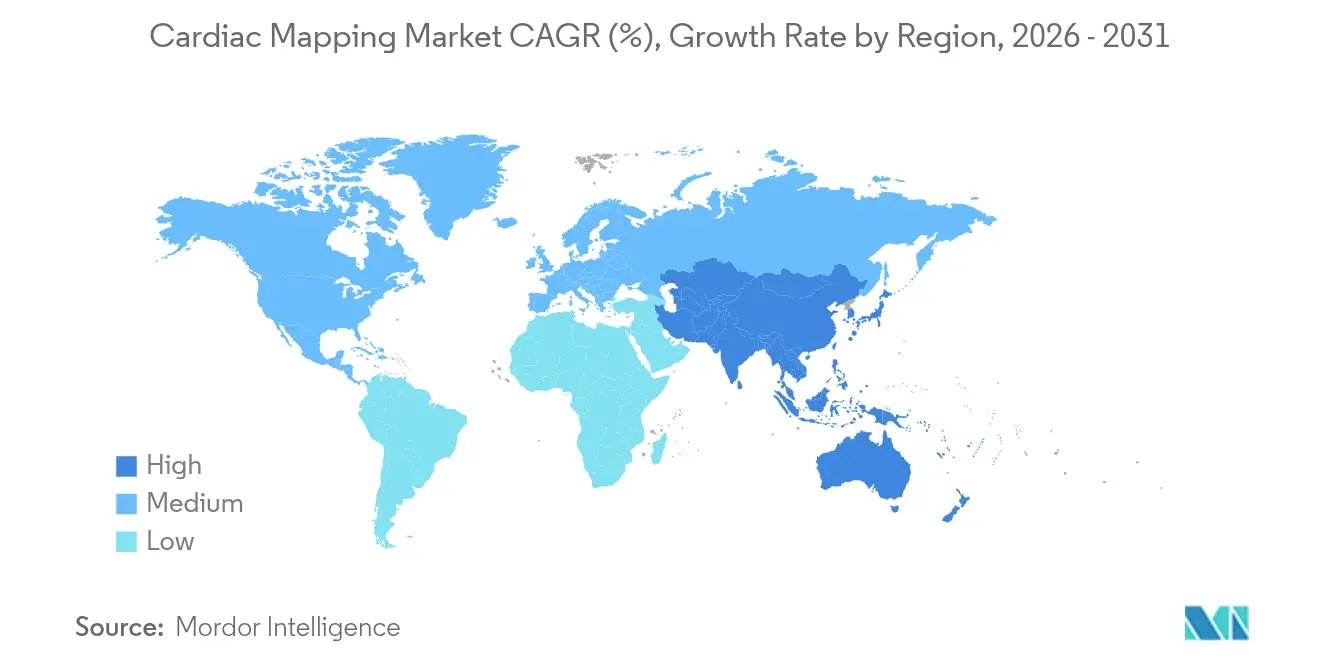
North America booked 42.55% revenue in 2025 thanks to mature reimbursement and early PFA clearances that encourage rapid technology refresh cycles. US centers participate in pivotal trials for dual-energy ablation and AI mapping, securing clinical leadership. Moderate growth through 2031 reflects saturation at top hospitals, though outpatient expansion offsets plateau effects.
APAC Cardiac Mapping Market
Asia-Pacific delivers the highest 9.21% CAGR because cardiovascular disease burdens rise in tandem with economic growth. Fortis Healthcare’s USD 156 million expansion that adds AI-equipped cath labs typifies regional investment. Chinese device firms target FDA and CE pathways, intensifying price competition while broadening product availability. Japan, South Korea, and Australia leverage aging demographics and sophisticated insurance systems to adopt new modalities quickly.
EMEA and South America Cardiac Mapping Market
Europe sustains incremental gains as payers scrutinize cost-utility yet reward proven innovations through harmonized regulatory channels. Germany, the United Kingdom, and France absorb most installations, while Italy and Spain emphasize regional equity in access. Brexit mildly disrupts supply chains but clinical collaboration endures. Middle East & Africa and South America form smaller bases yet offer long-run upside as public health budgets climb. Overall, diversified regional trajectories collectively reinforce global expansion of the cardiac mapping market.

Regulatory Landscape
In the United States, cardiac mapping platforms and associated diagnostic mapping components commonly follow the FDA Class II route, where the 510(k) pathway and predicate substantial equivalence shape product iteration cycles. A notable recent clearance was Imricor Medical Systems NorthStar Mapping System, cleared in January 2026 (traditional 510(k)), underscoring continued regulatory throughput for new mapping approaches alongside established electroanatomical systems.
In Europe, cardiac mapping systems are governed primarily by the EU Medical Device Regulation (EU) 2017/745, which requires conformity assessment with notified body involvement and increases emphasis on clinical evidence for higher-risk integrated workflows. MDR-related implementation updates, including Implementing Regulation (EU) 2026/977 on conformity assessment and notified bodies, add compliance pressure for manufacturers selling integrated mapping, imaging, and ablation ecosystems. Adjacent requirements such as MDCG 2024-1-1 vigilance guidance for cardiac ablation devices also affect post-market processes for mapping-enabled ablation workflows.
Value Chain Analysis
The cardiac mapping value chain starts with specialized inputs, including biocompatible metals (e.g., platinum-iridium, Nitinol, stainless steel), catheter polymers (e.g., PTFE, polyimide, silicone), and microelectronics such as flexible PCBs, high-density sensors, and connectors that support multi-electrode signal acquisition. These inputs flow into OEM R&D and systems engineering (hardware, software, and user-interface design), followed by precision manufacturing and validation, where high-density catheter assembly, signal integrity, and electromagnetic compatibility testing affect cycle time and cost.
Downstream, distribution is dominated by direct sales tied to electrophysiology lab workflow support, including installation, integration with existing recording and ablation systems, and ongoing clinical training to speed adoption and maintain utilization. Bottlenecks concentrate in complex catheter assembly and sourcing of high-density electronic components, which reinforces the role of qualified component suppliers and specialized manufacturing partners. Vendors also differentiate through software modules and interoperability layers that can be rolled out as upgrades across installed mapping consoles.
Competitive Landscape
Biosense Webster, Abbott, Boston Scientific, and Medtronic anchor a moderately consolidated field where platform breadth and R&D scale drive share. Since 2024, the race to commercialize PFA and AI navigation spawned approvals like Medtronic’s Affera and Boston Scientific’s FARAPULSE, resetting competitive benchmarks. Collaborations flourish: Abbott links with iCardio.ai, while Volta Medical teams with GE Healthcare to embed machine learning into familiar consoles.
Acquisitions underline strategic urgency; Boston Scientific’s Cortex buy strengthens computational mapping for PFA catheters. Niche competitors such as Stereotaxis promote robotically navigated magnetic catheters, aiming at radiation-free precision. Vektor Medical markets purely computational arrhythmia localization that overlays any mapping system, allowing capital-light upgrades.
Price pressure and cybersecurity mandates—FDA released updated guidance in June 2025—drive convergence around secure, upgradable architectures. Vendors that showcase authenticated encryption, cloud update pathways, and proven reductions in procedure time improve tender success. Consequently, product differentiation hinges on measurable efficiency, integrated safety features, and flexible business models rather than hardware alone, shaping sustainable leadership in the cardiac mapping market.
Cardiac Mapping Industry Leaders
Medtronic Plc
Boston Scientific Corporation
Acutus Medical
Johnson & Johnson
Abbott
- *Disclaimer: Major Players sorted in no particular order
Cardiac Mapping Market Companies Covered in this Report
- Biosense Webster (Johnson & Johnson)
- Abbott Laboratories
- Boston Scientific
- Medtronic
- Acutus Medical
- Koninklijke Philips
- MicroPort
- Lepu Medical
- AngioDynamics
- Kardium
- APN Health
- BioSig Technologies
- Vektor Medical
- HeartBeam Inc.
- AtriCure
- Volta Medical
- CathVision
- Imricor Medical
- OSYPKA
- BIOTRONIK

Market Opportunities and Future Outlook
Non-invasive and imageless mapping remains a focused opportunity, supported by recent regulatory progress and clinical workflow needs to reduce catheter manipulation and fluoroscopy exposure. In April 2026, Corify Care received FDA 510(k) clearance for ACORYS, positioned as a non-invasive, real-time 4D mapping approach that broadens the addressable workflow beyond traditional catheter-based anatomical reconstruction and can fit programs building capacity in ambulatory or throughput-focused settings.
A second opportunity centers on MRI-native and advanced imaging-integrated mapping, which reduces reliance on separate pre-procedural imaging and simplifies anatomy-to-electrogram alignment. In February 2026, Imricor received FDA 510(k) clearance for the NorthStar Mapping System described as MRI-native 3D mapping and guidance. Johnson & Johnson also presented the CARTOSOUND SONATA module at HRS 2026 to convert intracardiac echocardiography images into detailed maps using AI, reinforcing a shift toward mapping platforms as the operating layer that unifies imaging, mapping, and ablation workflows. Software-forward extensions further expand upgrade paths on installed capital equipment, as illustrated by Vektor Medicals December 2025 FDA 510(k) clearance for next-generation vMap features such as atrial flutter mapping and enhanced connectivity and integration capabilities.
Recent Industry Developments in Cardiac Mapping Market
- April 2026: Johnson & Johnson introduced the CARTOSOUND SONATA module for the CARTO mapping platform at HRS 2026, using AI to transform intracardiac echocardiography images into detailed cardiac maps. The release strengthens CARTO-centered workflows by bringing imaging-driven anatomy creation into the mapping console and tightening integration across mapping, navigation, and ablation steps.
- December 2025: Vektor Medical received FDA 510(k) clearance for the next-generation vMap, adding atrial flutter mapping plus enhanced connectivity and new integration capabilities. This supports software-led upgrades that can extend the usefulness of installed mapping ecosystems and improves compatibility with broader electrophysiology lab IT and device stacks.
- October 2024: Medtronic received FDA approval for the Affera Mapping and Ablation System with the Sphere-9 catheter, combining high-density mapping with both pulsed field and radiofrequency ablation capabilities. The approval raised the competitive bar for tightly integrated mapping-ablation platforms and accelerated procurement decisions toward systems that consolidate multiple procedural functions.


Cardiac Mapping Market Report Scope and Research Methodology
Market Definition and Coverage
The cardiac mapping market is defined as the revenue generated from systems used to map the heart's electrical activity to support electrophysiology diagnosis and ablation procedures across care settings.
Scope exclusions: We exclude general ECG, imaging-only tools, and ablation energy devices when they are sold without a cardiac mapping system component.
Segments Covered in This Report
- By Product Type
- Contact Mapping Systems
- Conventional RF Contact Catheters
- Contact-Force Sensing Catheters
- High-Density Grid Catheters
- Non-Contact Mapping Systems
- Basket & Multielectrode Arrays
- Ultrasound / Acoustical Mapping
- AI-Based Body-Surface Mapping
- Contact Mapping Systems
- By Indication
- Atrial Fibrillation
- Atrial Flutter
- Ventricular Tachycardia
- Supraventricular Tachycardia
- By End-User
- Tertiary Hospitals
- Electrophysiology & Cath Labs
- Ambulatory Surgical Centres
- Academic & Research Institutes
- Geography
- North America
- United States
- Canada
- Mexico
- Europe
- Germany
- United Kingdom
- France
- Italy
- Spain
- Rest of Europe
- Asia-Pacific
- China
- Japan
- India
- Australia
- South Korea
- Rest of Asia-Pacific
- Middle East & Africa
- GCC
- South Africa
- Rest of Middle East & Africa
- South America
- Brazil
- Argentina
- Rest of South America
- North America
Data Sources, Market Sizing, and Validation
Desk Research
Desk research starts by building the patient and procedure backdrop that drives demand for mapping systems, and then we connect that demand to device spending patterns. Public sources such as the US CDC, WHO, OECD health statistics, and national health ministries help us frame arrhythmia burden, hospital activity, and system capacity at a high level. We also review FDA and other regulator device databases, along with clinical literature and guideline updates (for example, publications from major cardiology societies) to understand adoption timing and typical use in atrial fibrillation and related indications.
On the supply side, we use company annual reports, investor presentations, and reputable press coverage to identify product launches, geographic reach, and any meaningful pricing or mix changes that can move market value. A paid subscription focused on company financials and another focused on patent databases are used selectively to cross-check product pipelines and validate revenue direction when public disclosure is limited. The desk sources listed here are illustrative only, and we also used other public documents to collect data, validate assumptions, and clarify open questions.
Primary Interviews and Surveys
Primary work is used to pressure-test how much cardiac mapping is actually performed, how budgets are approved, and what gets counted as a mapping system purchase versus an accessory or software upgrade. We speak with a mix of electrophysiologists, cath lab and EP lab managers, hospital procurement teams, and distributor or service-side experts across the Americas, EMEA, and APAC, so the model reflects differences in procedure mix, reimbursement, and installation pace. These conversations help fill gaps around typical upgrade cycles, price ranges by configuration, and the share of demand met through new installs versus replacements.
Distribution of primary research fieldwork respondents
| Company type | Respondent position | Region |
|---|---|---|
| Top tier: 38% | CXOs: 12% | APAC: 45% |
| Mid tier: 40% | Functional/Unit leaders: 39% | EMEA: 36% |
| Smaller Players: 22% | Managers: 49% | Americas: 19% |
Market-Sizing & Forecasting
Sizing is built using a top-down demand reconstruction that starts from electrophysiology procedure volumes and the share of cases where cardiac mapping is typically used, and then converts that into annual system value using average selling prices and replacement timing. To keep the totals grounded, we corroborate the output with selective bottom-up checks, such as supplier revenue signals, channel feedback on shipments, and sampled ASP-by-configuration estimates, and then adjust the model when inconsistencies show up.
A few inputs that matter most in this market are the atrial fibrillation and atrial flutter procedure mix, EP lab expansion plans, system replacement cycles, installed base utilization, and the split between contact and non-contact mapping adoption. Pricing assumptions are not left as a single flat number, because mapping platforms can differ by software modules, catheter compatibility, and service bundles, which changes realized ASPs. Where direct volume or pricing gaps exist for smaller countries, we use proxy metrics like hospital infrastructure, cardiology service intensity, and regional procedure benchmarks from interviews, and those proxies are then sanity-checked with local expert feedback.
For forecasting, we mainly apply scenario analysis, since procedure growth, staffing availability in EP labs, and reimbursement changes can each shift purchasing faster than a pure time-series trend. The final forecast is set after variables such as procedure growth expectations, upgrade cadence, and price progression are reviewed with primary respondents and aligned to observable signals from public healthcare data.
Data Validation & Update Cycle
Validation is handled through cross-checks across independent signals, not only through one calculation path. We compare the modeled market totals against indicators like EP procedure growth trends, reported device revenue direction in public filings, and the practical installation pace implied by lab capacity and staffing. When outliers appear, the assumptions are revisited, followed by analyst review steps that re-check formulas, unit conversions, and currency handling, before the numbers are signed off.
The report is refreshed annually, and interim updates are triggered when material events occur, such as meaningful regulatory actions, reimbursement shifts, or major platform launches that can change price or adoption. Before delivery, a final pass is completed to ensure recent news, macro changes, and any late-breaking data points are reflected in the latest view clients receive.
Mordor Intelligence's Cardiac Mapping Market Estimate Compared With Other Published Estimates
Published market sizes for cardiac mapping can look different because the underlying scope and counting rules are not always the same. The largest differences usually come from what gets included (systems only versus systems plus catheters or EP accessories), which year is treated as the base, and how pricing and replacement demand are handled.
Key gap drivers in this market tend to be whether mapping software upgrades are counted as full system revenue, how contact versus non-contact platform pricing is blended, and whether procedure growth is translated into device spend using realistic lab capacity and replacement cycles. Currency timing also matters, because some estimates use a single conversion point, even when pricing and purchasing happen across multiple geographies and quarters.
Benchmark comparison
| Source | Market Size | Gaps in Research Methodology |
|---|---|---|
| Mordor Intelligence | USD 2.36 B (2026) | |
| Global Consultancy A | USD 2.10 B (2026) | This figure appears to apply a narrower definition that counts only capital system sales and excludes software, service, and upgrade revenue that is often recognized around the installed base. |
| Industry Association B | USD 2.85 B (2026) | This estimate likely rolls cardiac mapping into a broader electrophysiology spending bucket, which can pull in adjacent diagnostic catheters and lab equipment that are not mapping system revenue. |
Procedure volume signals, installed base replacement checks, and pricing inputs validated in expert calls are the evidence that ties Mordor Intelligence to a defined mapping-system revenue pool rather than a broader EP device spend total. After aligning scope to what is actually purchased as a mapping system, the remaining spread across sources largely traces back to how upgrades, adjacent accessories, and blended ASP assumptions are treated. This keeps the final number easier to explain, and also easier for buyers to reproduce with clear variables and repeatable steps.


Key Questions Answered in the Report
How large will the cardiac mapping market be by 2031?
Forecasts place it at USD 3.62 billion, reflecting an 8.88% CAGR during 2026-2031.
Which region grows fastest for cardiac mapping technologies?
Asia-Pacific leads with a projected 9.21% CAGR through 2031 as hospitals expand electrophysiology capacity.
What segment currently dominates cardiac mapping systems?
Contact platforms held 63.45% share in 2025 due to clinician familiarity and broad reimbursement.
Which arrhythmia indication is expanding most rapidly?
Ventricular tachycardia procedures are set to rise at an 11.45% CAGR thanks to improved substrate mapping.
How does pulsed field ablation influence economics?
Analyses show EUR 850-1,301 savings per patient because of shorter procedure times and reduced complications.
Are outpatient settings gaining share in ablation volumes?
Yes, ambulatory surgical centers exhibit an 11.25% CAGR as same-day discharge protocols demonstrate clinical equivalence.
Page last updated on:


 Your data is secure and never sold or shared.


