Carbon Felt and Graphite Felt Market Size and Share
Market Overview
| Study Period | 2020 - 2031 |
|---|---|
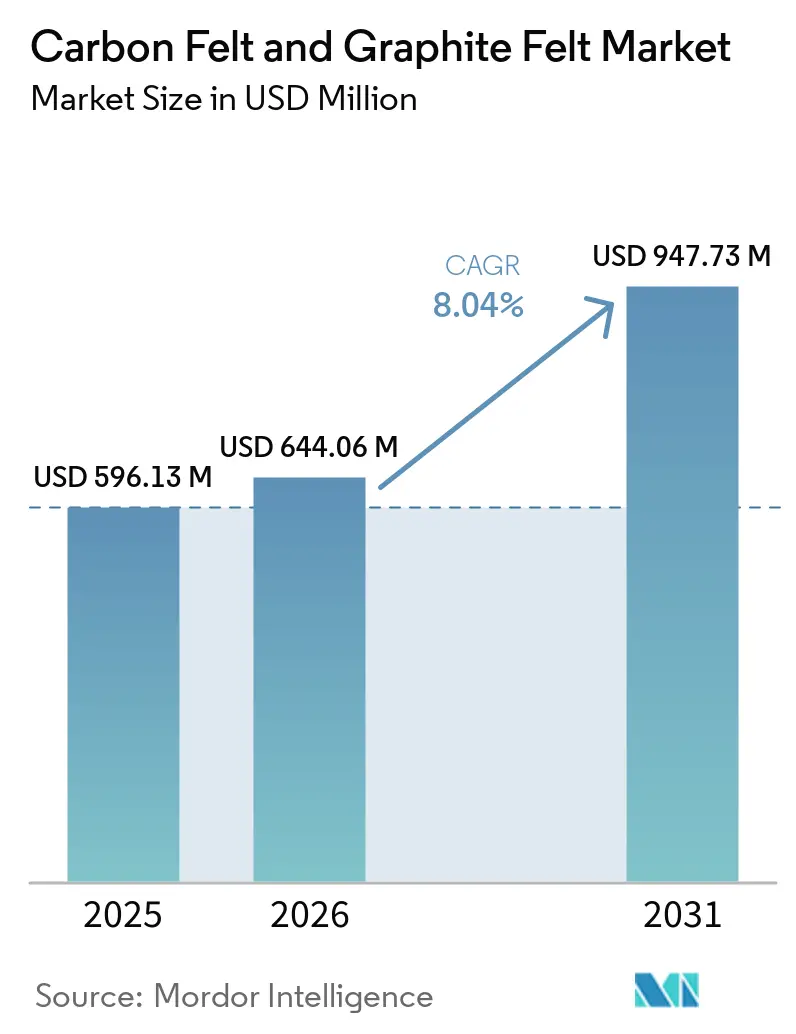
| Market Size (2026) | USD 644.06 Million |
| Market Size (2031) | USD 947.73 Million |
| Growth Rate (2026 - 2031) | 8.04% CAGR |
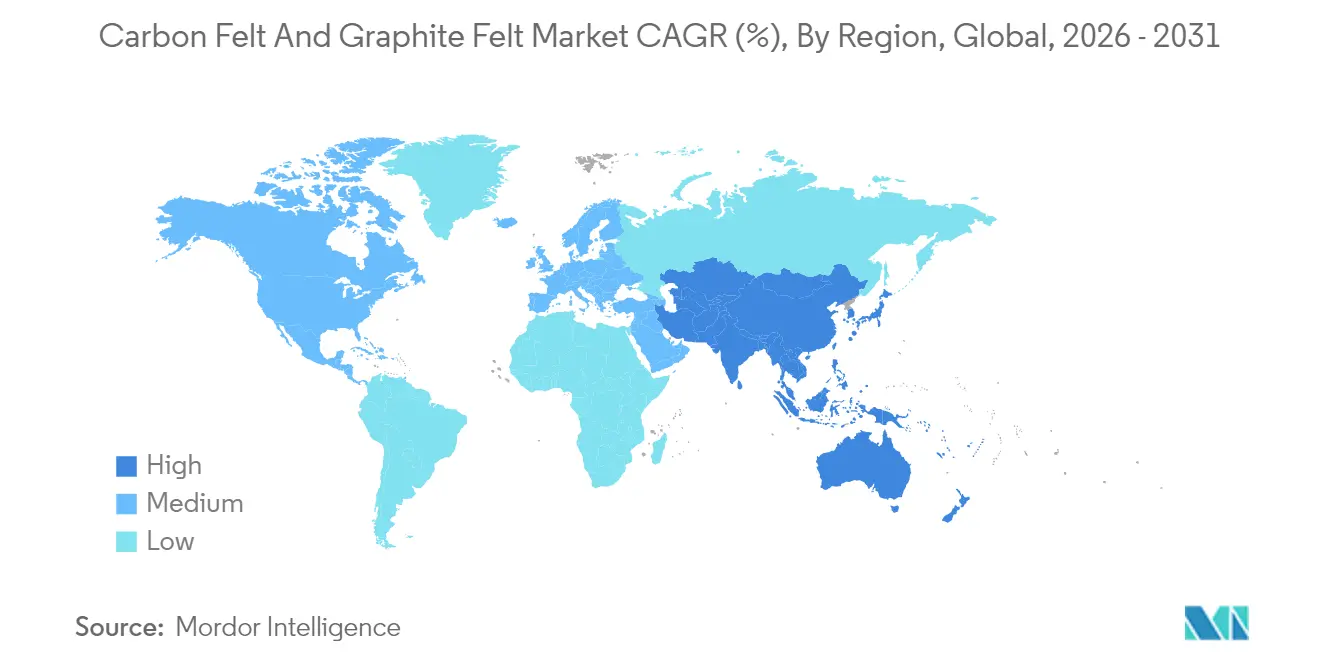
| Fastest Growing Market | Asia-Pacific |
| Largest Market | Asia-Pacific |
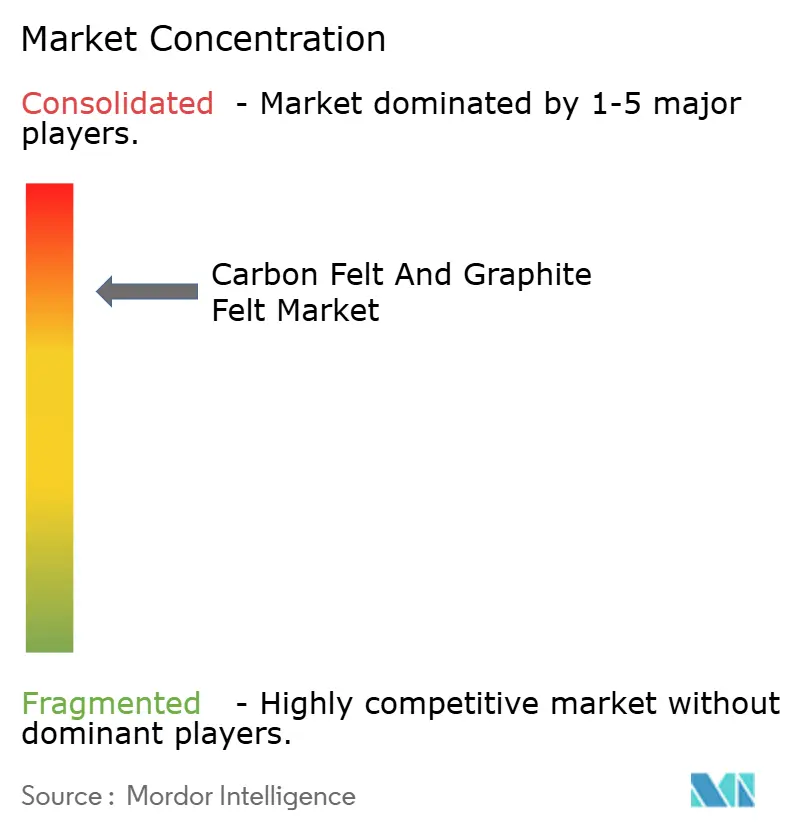
| Market Concentration | High |
Major Players *Disclaimer: Major Players sorted in no particular order Image © Mordor Intelligence. Reuse requires attribution under CC BY 4.0. | |
Carbon Felt and Graphite Felt Market Analysis by Mordor Intelligence
The carbon felt and graphite felt market size is expected to grow from USD 596.13 million in 2025 to USD 644.06 million in 2026 and is forecast to reach USD 947.73 million by 2031 at 8.04% CAGR over 2026-2031. Demand momentum stems from energy-storage expansion, notably lithium-ion and redox-flow batteries, high-temperature furnace upgrades, and semiconductor processing lines that now handle larger wafer formats. Integrated supply chains in Asia-Pacific compress production costs, whereas localization policies in North America and Europe introduce regional price premiums. Polyacrylonitrile-derived fibers, graphitised surface treatments, and continuous process innovations keep switching costs high and safeguard margins across the carbon felt and graphite felt market. Competitive intensity remains moderate because customized performance requirements inhibit commoditization and favor vertically integrated suppliers that control precursor chemistry, graphitisation know-how, and coating technologies.
Key Report Takeaways
- By raw material, PAN-based products led with 46.25% revenue share in 2025; PAN is also projected to grow at a 9.28% CAGR to 2031.
- By surface treatment, carbonised materials held 40.10% share in 2025, whereas graphitised grades record the fastest expansion at a 8.77% CAGR.
- By type, carbon felt captured 59.55% carbon felt and is advancing at a 9.38% CAGR through 2031.
- By application, batteries accounted for 46.40% share of the carbon felt and graphite felt market size in 2025 and are growing at 10.11% CAGR.
- By geography, Asia-Pacific commanded 45.20% carbon felt and graphite felt market size in 2025 and is set to expand at a 9.41% CAGR to 2031.
Note: Market size and forecast figures in this report are generated using Mordor Intelligence’s proprietary estimation framework, updated with the latest available data and insights as of 2026.
Global Carbon Felt and Graphite Felt Market Trends and Insights
Drivers Impact Analysis*
| Driver | (~) % Impact on CAGR Forecast | Geographic Relevance | Impact Timeline |
|---|---|---|---|
| Improved Performance of Carbon Felt at High Temperatures | +2.10% | Global with Asia-Pacific and Europe concentration | Medium term (2-4 years) |
| Soaring Demand from Li-Ion and Redox-Flow Battery Makers | +2.80% | Global, led by Asia-Pacific, extending to North America and Europe | Short term (≤ 2 years) |
| Government EV-Battery Graphite Localisation Mandates | +1.90% | North America and Europe, spillover to Asia-Pacific | Medium term (2-4 years) |
| Emerging Hydrogen Pyrolysis Reactors Using Graphite Felt | +1.20% | Europe and North America, early adoption in Asia-Pacific | Long term (≥ 4 years) |
| High-Temperature Carbon Capture Units Adopting Carbon Felt Sorbents | +0.80% | Global, early implementation in North America and Europe | Long term (≥ 4 years) |
| Source: Mordor Intelligence | |||
Improved Performance of Carbon Felt at High Temperatures
Carbon felt withstands inert-atmosphere temperatures above 2,000 °C while insulating furnaces 15-30% more efficiently than ceramics, reducing energy bills for steelmakers and semiconductor epitaxy lines. SiC vapor-deposited coatings further extend component life 40–60% without sacrificing thermal properties, translating to fewer maintenance shutdowns. Semiconductor toolmakers transitioning to 200 mm silicon-carbide wafers specify carbon felt strictly for its dimensional stability under thermal cycling. As downstream industries push decarbonization, this material advantage becomes a procurement standard rather than a niche option across the carbon felt and graphite felt market. Suppliers capable of pairing fiber architecture control with advanced coatings secure premium pricing and multiyear supply contracts.
Soaring Demand from Li-ion and Redox-Flow Battery Makers
North American lithium-ion cell factories have grown from three to ten since 2019, sharply raising regional electrode demand. Redox flow technology reinforces the pull; graphite felt electrodes achieve superior electrolyte penetration and drive voltage efficiency above 87% when modified with MOF-derived nanocomposites[1]Elisa Cagnin et al., “High-Performance Flow Battery Electrodes via MOF-Derived Modifications,” MDPI, mdpi.com . Grid-storage integrators value the felt’s electrochemical surface area and permeability balance, pushing continuous qualification programs for new grades. This momentum secures a central role for the carbon felt and graphite felt market in global energy-transition roadmaps, locking in multi-gigawatt-hour purchase commitments.
Government EV-Battery Graphite Localisation Mandates
The USD 754.8 million U.S. DOE grant to NOVONIX’s Tennessee synthetic graphite plant underlines Western urgency to reroute supply chains. IRA provisions disqualify Chinese graphite from EV tax credits, creating a 15–25% pricing premium for compliant material and incentivising allied-country production. Similar rules surface in Europe, spurring joint ventures that couple local purification with imported feedstock. Short-term supply constraints grant established diversified producers windfall margins across the carbon felt and graphite felt market until greenfield projects stabilise.
Emerging Hydrogen Pyrolysis Reactors Using Graphite Felt
Methane pyrolysis units employing graphite felt heaters record 94% conversion at 1,673 K and deliver turquoise hydrogen without CO₂ output[2]A. George et al., “Methane Pyrolysis in Joule-Heated Reactors,” Chemical Engineering Journal, sciencedirect.com . Joule-heated designs yield carbon coproducts exhibiting Raman ID/IG ratios of 0.1, opening specialty-grade revenue streams chemrxiv.org. The dual-product economics shorten payback periods, making felt selection pivotal for reactor builders scaling to commercial volumes. Forward-looking suppliers are already benchmarking fiber oxidation resistance under reactive atmospheres to capture this nascent yet lucrative node of the carbon felt and graphite felt market.
Restraints Impact Analysis*
| Restraint | (~) % Impact on CAGR Forecast | Geographic Relevance | Impact Timeline |
|---|---|---|---|
| High Production Cost and Energy Intensity of Graphitisation | -1.80% | Global, pronounced where electricity prices are high | Short term (≤ 2 years) |
| Volatile Chinese Export Controls on Synthetic Graphite | -1.40% | Global, acute in North America and Europe | Medium term (2-4 years) |
| Occupational Exposure Limits for Carbon Dust Emissions | -0.70% | Global, stricter in developed markets | Medium term (2-4 years) |
| Source: Mordor Intelligence | |||
High Production Cost & Energy Intensity of Graphitisation
Graphitising furnaces draw 15–20 MWh per ton, raising operational expense as electricity and carbon fees climb. Capital intensity—USD 50 million plus per line—deters greenfield entrants and slows capacity additions. Some plants reclaim 20–30% heat via recuperative designs, yet the payback still hinges on regional power tariffs. For the carbon felt and graphite felt market, these economics tighten supply during demand upswings, affording incumbents pricing power but tempering overall volume growth.
Occupational Exposure Limits for Carbon Dust Emissions
NIOSH now recommends 1 µg/m³ limits for elemental carbon, tightening workplace standards[3]National Institute for Occupational Safety and Health, “Elemental Carbon Exposure Limit Guidance,” cdc.gov . Plants invest in high-efficiency filtration, ambient monitoring, and medical surveillance, adding 5–10% to conversion cost. Compliance gaps trigger production shifts toward lower-regulation locales, yet top-tier suppliers leverage upgraded facilities as proof points for semiconductor and medical customers within the carbon felt and graphite felt market.
*Our forecasts treat driver/restraint impacts as directional, not additive. The impact forecasts reflect baseline growth, mix effects, and variable interactions.
Segment Analysis
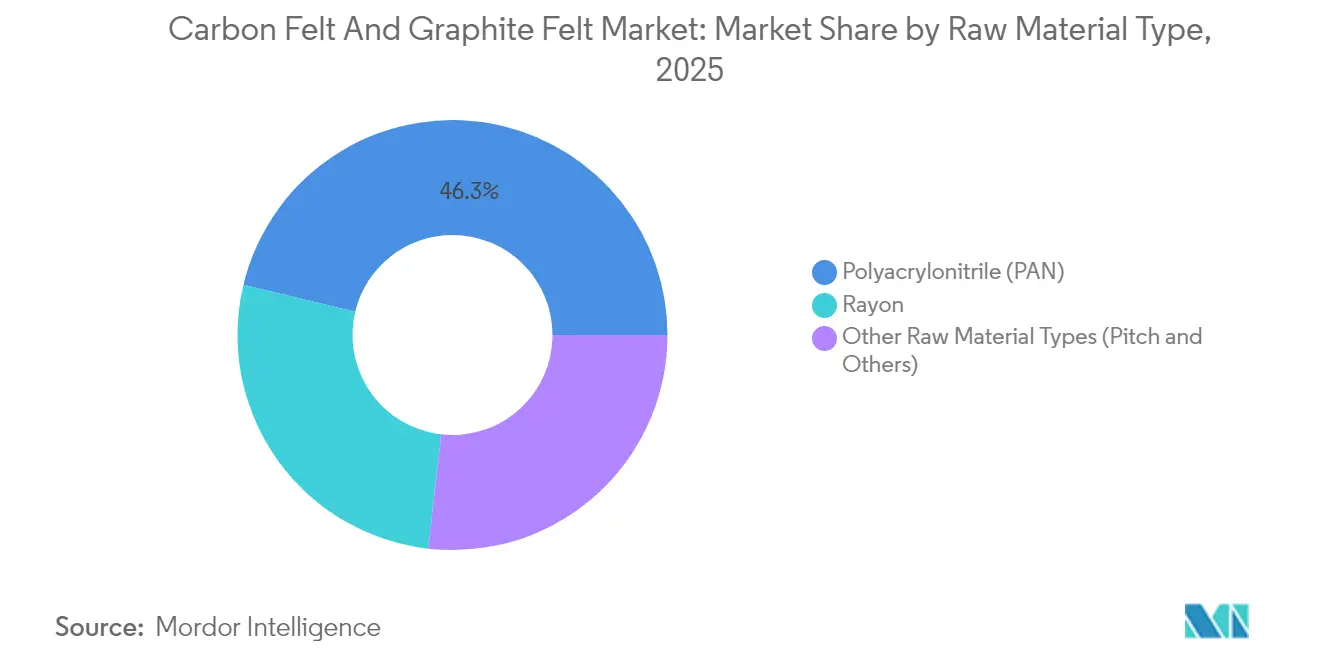
By Raw Material Type: PAN Dominance Across Applications
Polyacrylonitrile-based grades captured 46.25% of the carbon felt and graphite felt market share in 2025 and are forecast to grow at a 9.28% CAGR to 2031. PAN precursors enable controlled stabilization and carbonisation, yielding fibers with uniform diameter and low impurity content that battery and semiconductor clients demand. Rayon maintains a foothold in less strenuous insulation services, whereas pitch-based felts address selected high-thermal-conductivity duties but face environmental scrutiny.
Supply chain integration favors PAN leadership. Advances in precursor spinning trim scrap rates and shave 15–20% from unit cost, widening the gap versus rayon. Renewable acrylonitrile feedstock pilots also boost sustainability credentials, enhancing PAN’s appeal. As manufacturers lock multiyear electrode contracts, consistent PAN quality becomes non-negotiable, reinforcing its lead in the carbon felt and graphite felt market.


By Surface Treatment: Graphitised Materials Gain Momentum
Carbonised felts held 40.10% market share in 2025, valued for affordability and sufficient performance below 2,000 °C. Graphitised products, though dearer, post a 8.77% CAGR on the back of rising furnace temperatures in aerospace and semiconductor processes. Oxidised or functionalised variants gain traction in flow batteries, where surface chemistry fine-tunes catalytic behavior.
Process sophistication differentiates suppliers; SGL Carbon’s SiC-coated SIGRAFINE series extends lifespan by 40–60%, lowering total cost of ownership for fab operators. Customers increasingly request hybrid portfolios spanning carbonised insulation blocks to graphitised, coated felt for hot zones, locking in bundled contracts and boosting revenue diversity in the carbon felt and graphite felt market.
By Type: Carbon Felt Versatility Drives Leadership
Carbon felt commanded 59.55% of the carbon felt and graphite felt market size for process equipment in 2025, thanks to its balance of mechanical strength and insulation. A 9.38% CAGR to 2031 reflects widening use from battery electrodes to hydrogen reactors. Graphite felt retains niche adoption where maximum thermal conductivity is king, but its CAPEX-heavy graphitisation step curbs share gain.
Innovation continues to broaden carbon felt’s envelope. Toray’s porous carbon fiber with nano-scale continuous pores unlocks gas-separation applications, signaling horizontal expansion for the carbon felt and graphite felt market. Coupling such breakthroughs with scalable production cements the material’s dominance.
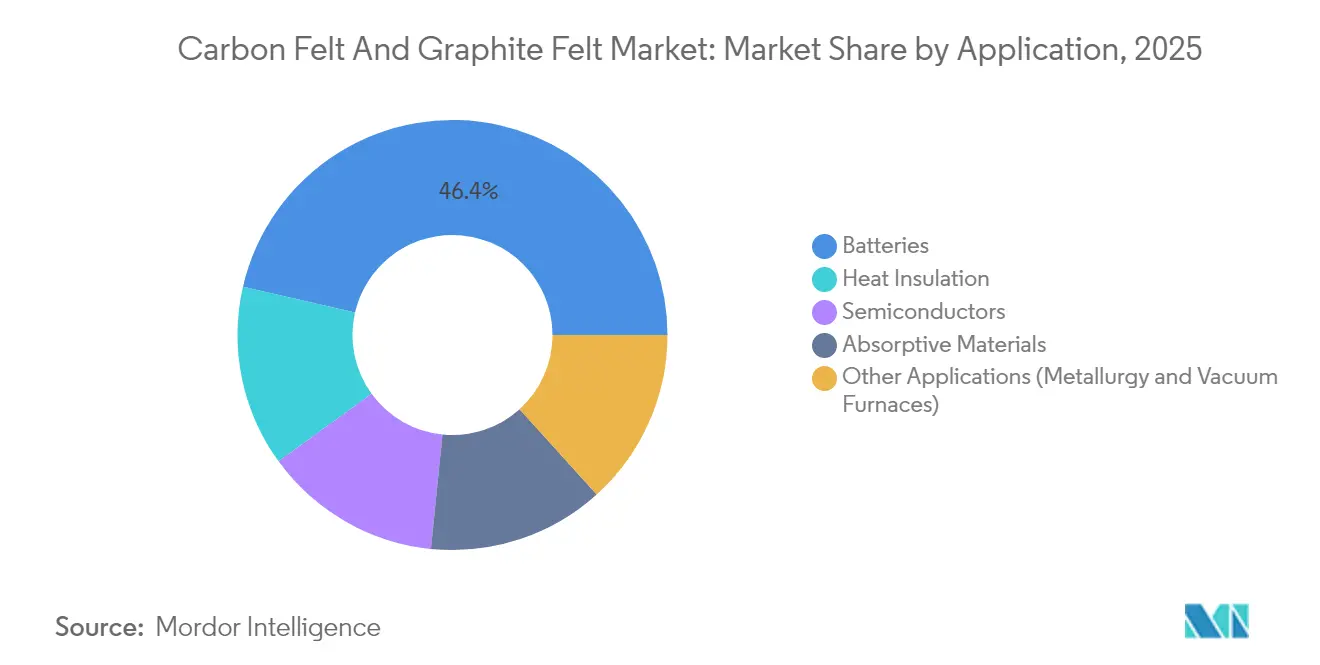
By Application: Battery Sector Transformation Accelerates
Battery electrodes controlled 46.40% of overall demand in 2025 and will grow at a 10.11% CAGR through 2031, reflecting the steep rise in EV and stationary storage installations. Heat-insulation roles in metallurgy and vacuum furnaces stay steady, while semiconductor adoption surges due to silicon-carbide device proliferation.
Performance metrics drive specification. Recent lab work showed vanadium flow batteries using modified graphite felt reached 84% energy efficiency over 250 cycles, far outstripping cloth electrodes. Such results solidify felt’s status as an enabling technology, underpinning future revenue across the carbon felt and graphite felt market.
Geography Analysis
Asia-Pacific wields a 45.20% share of the carbon felt and graphite felt market and is growing at 9.41% CAGR as China’s feedstock dominance meets Japan’s process precision and South Korea’s chip demand. Chinese suppliers benefit from local graphite commanding 77% of global output, ensuring low-cost input and supply security. Joint ventures with Japanese coating specialists elevate product quality, allowing regional firms to win global wafer-fab tenders. India’s Production-Linked Incentive schemes accelerate domestic cell plants, bolstering mid-term felt consumption.
North America’s expansion rides on federally backed localization. The NOVONIX Tennessee facility alone can support 325,000 EVs annually, anchoring a homegrown synthetic graphite chain. Battery OEM pre-purchase agreements absorb early output, guaranteeing baseline utilization for local felt suppliers. Policy incentives shorten decision cycles, making the region the fastest-emerging challenger in the carbon felt and graphite felt market outside Asia-Pacific.
Europe focuses on value-added applications and greener production. SGL Carbon’s Meitingen plant upgrade targets semiconductor and hydrogen projects with recycled electricity inputs to lower scope-2 emissions. Meanwhile, Brazil and Madagascar mine expansions provide both continents optionality as Chinese export controls tighten. Middle East & Africa and South America trail in volume but present long-range upside once industrial decarbonisation projects mature, positioning them as strategic frontier markets for the carbon felt and graphite felt market.

Competitive Landscape
The market remains consolidated concentrated; top players leverage proprietary fiber chemistry, high-temperature furnace assets, and surface-treatment IP to fend off commoditization. SGL Carbon integrates PAN precursor production to SiC coatings, enabling rapid ramp-ups when semiconductor tool orders spike. Morgan Advanced Materials allocated GBP 100 million to boost semiconductor-grade capacity, achieving 12.6% organic growth in 2024 and committing to high-margin niches. Toray capitalizes on its carbon fiber pedigree to launch porous felts that diversify revenue beyond insulation.
Strategic moves typically couple capex with offtake guarantees. SGL’s multiyear supply pact with a leading EV battery maker secures baseline furnace loading, while Morgan’s European facility expansion comes with pre-booked orders from chipmakers. IP-heavy surface treatments create high switching costs; end users rarely shift suppliers mid-program due to qualification hurdles, giving incumbents steady pricing power across the carbon felt and graphite felt market.
Emerging entrants pursue niche breakthroughs rather than direct volume competition. Start-ups offering plasma-functionalised felts for direct air capture partner with EPC firms to pilot units, hoping to scale once performance data is validated. However, large players’ global footprints and broader product catalogs remain formidable barriers, keeping rivalry measured rather than cut-throat.
Carbon Felt and Graphite Felt Industry Leaders
Morgan Advanced Materials plc
Nippon Carbon Co. Ltd.
SGL Carbon
Toray Industries Inc.
Kureha Corporation
- *Disclaimer: Major Players sorted in no particular order

Recent Industry Developments
- March 2025: SGL Carbon, in its 2024 annual report, highlighted the ongoing construction of a new plant in Meitingen, Germany, for producing carbonized and graphitized soft felt. This development, initiated in 2022, is expected to strengthen the carbon and graphite felt market by enhancing production capacity.
- October 2023: Toray Industries, Inc. plans to increase the production capacity of its French subsidiary, Toray Carbon Fibers Europe S.A., raising the Abidos plant's annual output from 5,000 to 6,000 metric tons by 2025. This initiative is expected to strengthen the studied market, as carbon felt is made from carbon fiber.


Research Methodology Framework and Report Scope
Market Definitions and Key Coverage
Our study defines the carbon felt and graphite felt market as all commercially traded felts manufactured from carbonized or graphitized PAN, rayon, or pitch fibers that are supplied in soft-roll or rigid board form for thermal insulation, electrochemical, and filtration duties above 200 °C. These products are modeled from their first sale by producers to end-use sectors such as high-temperature furnaces, redox-flow batteries, lithium-ion batteries, and semiconductor equipment.
Scope exclusion: recycled felts, carbon foam blocks, and hybrid composite panels that embed felt within other matrices are not counted.
Segmentation Overview
- By Raw Material Type
- Polyacrylonitrile (PAN)
- Rayon
- Other Raw Material Types (Pitch and Others)
- By Surface Treatment
- Carbonised
- Graphitised
- Oxidised / Functionalised
- By Type
- Carbon Felt
- Graphite Felt
- By Application
- Heat Insulation
- Batteries
- Semiconductors
- Absorptive Materials
- Other Applications (Metallurgy and Vacuum Furnaces)
- By Geography
- Asia-Pacific
- China
- Japan
- South Korea
- India
- Rest of Asia-Pacific
- North America
- United States
- Canada
- Mexico
- Europe
- Germany
- United Kingdom
- France
- Italy
- Rest of Europe
- South America
- Brazil
- Argentina
- Rest of South America
- Middle East and Africa
- Saudi Arabia
- South Africa
- Rest of Middle East and Africa
- Asia-Pacific
Detailed Research Methodology and Data Validation
Primary Research
Mordor analysts held structured interviews with furnace OEM engineers, battery material scientists, and procurement heads across Asia-Pacific, North America, and Europe. These conversations validated utilization rates, clarified average selling prices, and confirmed emerging demand pockets that were only partially visible in the literature.
Desk Research
We built the market framework after reviewing authoritative, non-paywalled datasets such as United States Geological Survey graphite mineral summaries, UN Comtrade HS-680610 shipment records, International Energy Agency battery storage additions, and trade association releases from the Industrial Heating Equipment Association. Company filings, investor decks, and specialized journals like Carbon and Graphite Advances helped us cross-check production capacities and application mixes. Access to D&B Hoovers and Dow Jones Factiva allowed our team to extract revenue splits and recent expansion announcements that feed baseline assumptions. This list is illustrative; many other sources were referenced to capture local pricing, capacity changes, and regulatory context.
Market-Sizing & Forecasting
A top-down reconstruction that starts with regional furnace shipments, battery electrode square-meter demand, and import-export balances generated the 2025 baseline, which is then corroborated through selective supplier roll-ups and sampled ASP × volume checks. Key variables include capacity additions in vacuum furnace fleets, vanadium redox-flow battery projects, crude steel output trends, average graphitization yield losses, and regional energy storage incentives. A multivariate regression links these drivers to felt demand and feeds an ARIMA overlay that projects primary series to 2030. Where supplier data were sparse, we adjusted bottom-up estimates using weighted price corridors derived from customs values.
Data Validation & Update Cycle
Model outputs pass a two-step anomaly review, followed by peer sign-off. We re-run checks when quarterly trade data or material policy shifts exceed predefined thresholds. Reports refresh each year, with interim updates if a material event changes demand or capacity outlooks.
Why Mordor's Carbon Felt And Graphite Felt Baseline Commands Trusted Reliance
Published numbers often diverge because firms adopt different product scopes, distinct battery adoption scenarios, or sporadic refresh routines. Our disciplined definition, annual refresh, and dual-path modeling provide users with a stable yardstick.
Key gap drivers include narrower raw-material taxonomy in some studies, omission of battery electrode retrofits by others, and currency conversions that freeze rates at report inception. We also note that a few publishers fold specialty foams or ultra-purity semiconductor felts into totals, which inflates their figures vis-à-vis ours.
Benchmark comparison
| Market Size | Anonymized source | Primary gap driver |
|---|---|---|
| USD 596.13 million (2025) | Mordor Intelligence | |
| USD 551 million (2024) | Global Consultancy A | Excludes aftermarket furnace relines and converts at fixed 2021 FX rates |
| USD 569.9 million (2025) | Industry Association B | Relies on voluntary producer surveys; limited battery electrode coverage |
| USD 629.9 million (2025) | Regional Consultancy C | Adds semiconductor ultra-pure felts outside our defined scope |
In sum, differences stem largely from scope breadth and data refresh cadence. By anchoring estimates to clearly stated boundaries and live industrial indicators, Mordor Intelligence delivers a balanced, transparent baseline that decision-makers can replicate and trust.


Key Questions Answered in the Report
What is the size of the carbon felt and graphite felt market and how fast is it growing?
The market stands at USD 644.06 million in 2026 and is projected to reach USD 947.73 million by 2031, reflecting an 8.04% CAGR.
Which application accounts for the largest share of demand?
Batteries dominate with 46.40% of market demand in 2025 and are expanding at a 10.11% CAGR through 2031.
Why do manufacturers favor PAN-based carbon felt?
Polyacrylonitrile precursors yield consistently uniform fibers, enabling reliable battery-grade and semiconductor components while supporting the highest segment growth at a 9.28% CAGR.
Which regions are set to see the fastest growth?
Asia-Pacific remains the largest and fastest-growing region at a 9.41% CAGR, while North America is rapidly scaling capacity through government-backed localization projects.
Page last updated on:


