Cancer Registry Software Market Size and Share
Market Overview
| Study Period | 2020 - 2031 |
|---|---|
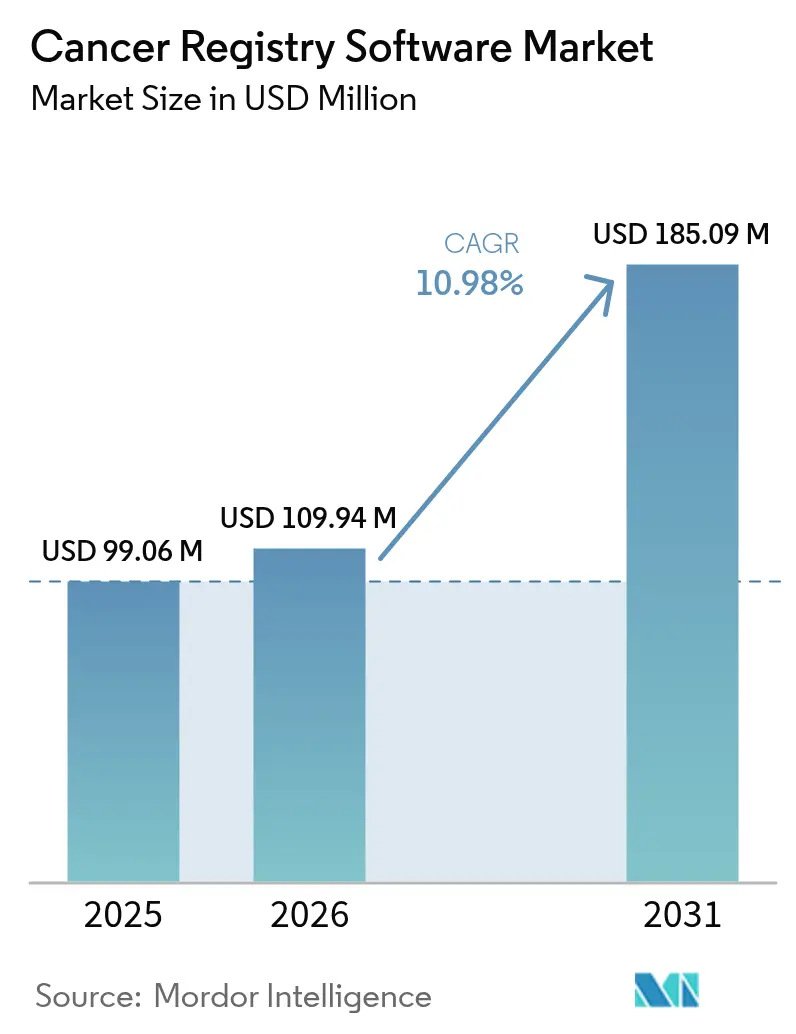
| Market Size (2026) | USD 109.94 Million |
| Market Size (2031) | USD 185.09 Million |
| Growth Rate (2026 - 2031) | 10.98% CAGR |
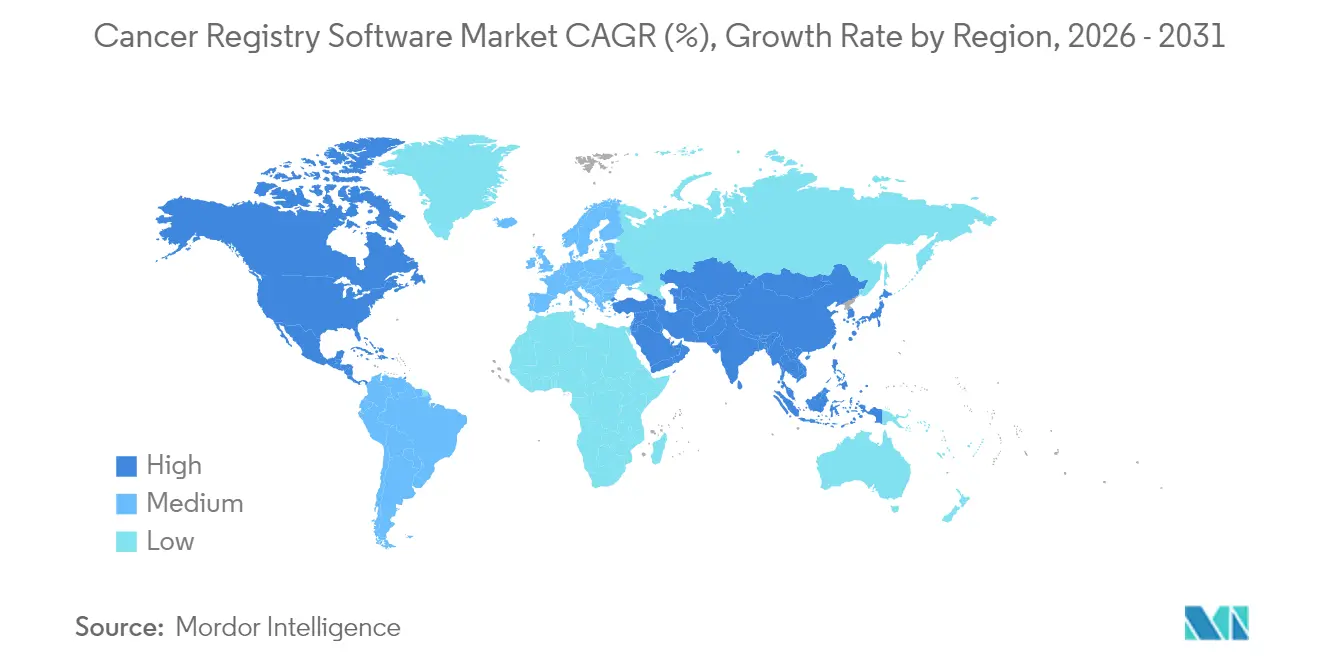
| Fastest Growing Market | Asia-Pacific |
| Largest Market | North America |
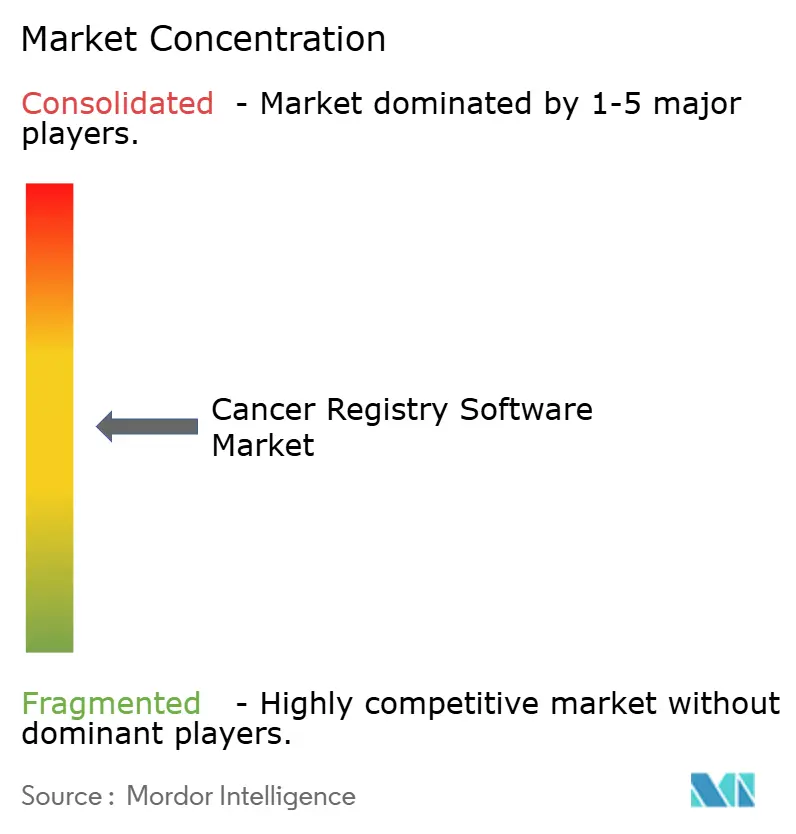
| Market Concentration | Medium |
Major Players *Disclaimer: Major Players sorted in no particular order Image © Mordor Intelligence. Reuse requires attribution under CC BY 4.0. | |
Cancer Registry Software Market Analysis by Mordor Intelligence
Cancer registry software market size in 2026 is estimated at USD 109.94 million, growing from 2025 value of USD 99.06 million with 2031 projections showing USD 185.09 million, growing at 10.98% CAGR over 2026-2031. The current expansion reflects rapid digitization of oncology records, stringent public-health reporting mandates, and healthcare providers’ preference for interoperable, cloud-native platforms. Government programs such as the CDC’s National Program of Cancer Registries require 95% data completeness, creating a steady pipeline of demand for advanced registry applications. Ongoing shortages of certified tumor registrars intensify interest in AI-driven auto-abstraction tools, while the growing use of wearable devices and genomic assays broadens data-collection requirements. Vendors are differentiating through natural-language processing, automated quality-assurance workflows, and HIPAA-compliant cloud architectures, positioning the Cancer registry software market for sustained double-digit growth.
Key Report Takeaways
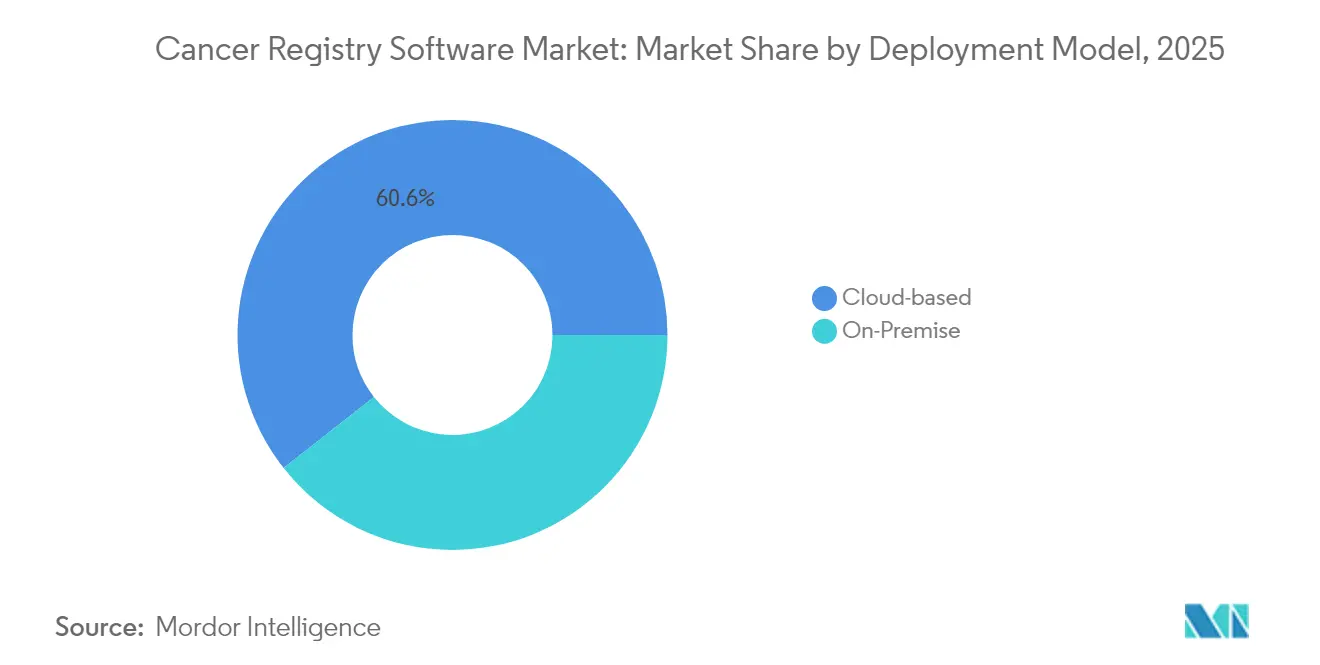
- By deployment model, cloud-based platforms led with 60.62% revenue share in 2025; on-premise lags while cloud expands at a 12.23% CAGR through 2031.
- By database type, commercial solutions held 53.02% of the Cancer registry software market share in 2025, whereas public databases record the fastest 11.67% CAGR to 2031.
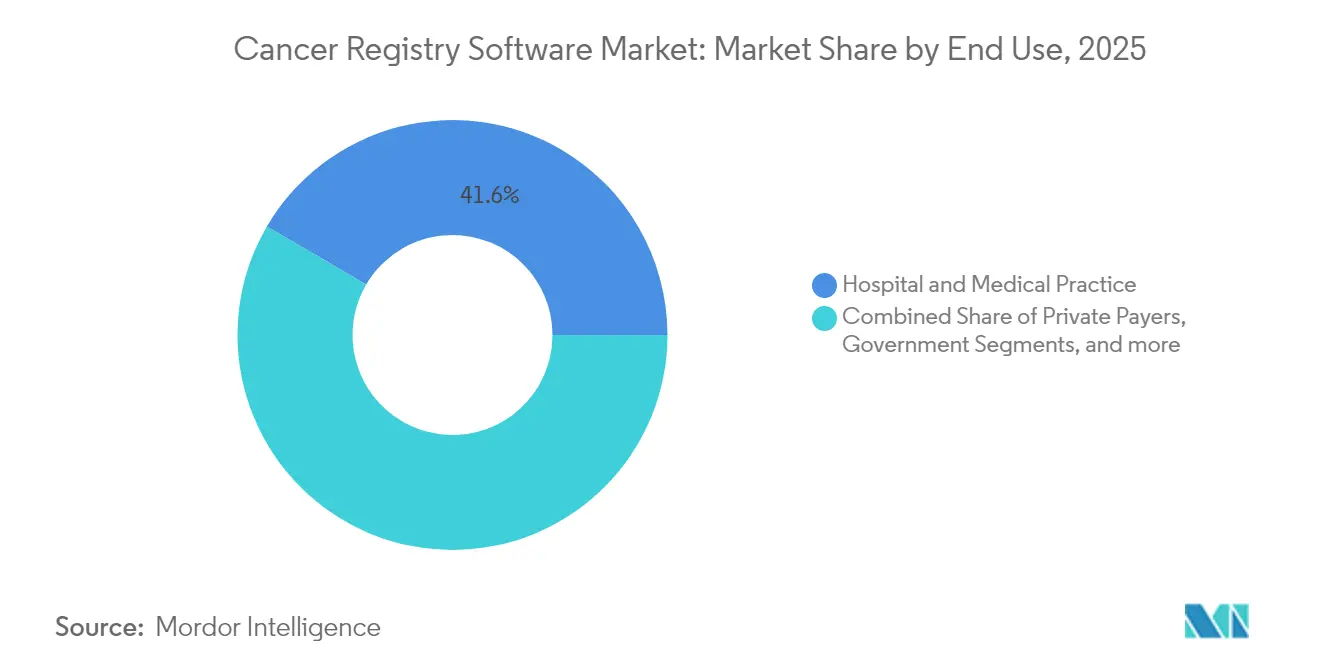
- By end use, hospitals and medical practices captured 41.58% of the Cancer registry software market size in 2025, yet government and third-party users grow most quickly at 11.64% CAGR.
- By geography, North America dominated with 44.20% revenue share in 2025, while Asia-Pacific posts the highest 11.74% CAGR to 2031.
Note: Market size and forecast figures in this report are generated using Mordor Intelligence’s proprietary estimation framework, updated with the latest available data and insights as of 2026.
Market Trends and Insights
Drivers Impact Analysis of Cancer Registry Software Market*
| Driver | % Impact on CAGR Forecast | Geographic Relevance | Impact Timeline |
|---|---|---|---|
| Increasing prevalence of cancer | +1.8% | Global, with highest impact in Asia-Pacific and aging populations | Long term (≥ 4 years) |
| Government mandates for cancer-data reporting | +2.1% | North America & EU primarily, expanding to APAC | Medium term (2-4 years) |
| Shift toward cloud deployment for cost & accessibility | +1.5% | Global, with early adoption in developed markets | Short term (≤ 2 years) |
| AI-driven auto-abstraction cuts registry backlog | +1.3% | North America & EU core, spill-over to APAC | Medium term (2-4 years) |
| Wearable-device data expands registry scope | +0.9% | Developed markets initially, gradual global expansion | Long term (≥ 4 years) |
| Blockchain-enabled cross-border data sharing | +0.7% | EU & North America, pilot programs in APAC | Long term (≥ 4 years) |
| Source: Mordor Intelligence | |||
Increasing Prevalence of Cancer
Global oncology incidence is climbing, with Western Pacific cases expected to move from 4.5 million in 2012 to 6.4 million by 2025, pressuring health systems to adopt scalable registry infrastructure. Aging populations drive particularly complex survivorship tracking needs, prompting vendors to embed longitudinal data models that accept genomics and biomarker inputs. Demand rises in low- and middle-income countries where population-based registries are newly funded, creating openings for cloud providers that deliver cost-effective modules. Advanced software increasingly supports personalized-medicine workflows, documenting targeted therapies and multi-modal regimens. Collectively, higher caseloads and intricate treatment protocols sustain long-run demand for the Cancer registry software market.
Government Mandates for Cancer-Data Reporting
The CDC mandates 95% case completeness with no more than 3% death-certificate-only cases, driving universal adoption of NAACCR-formatted electronic submissions in the United States. Several states, such as Washington, now require providers to transmit HL7-formatted records through Health Information Exchanges, accelerating real-time surveillance. Similar directives emerge across Europe, while Asia-Pacific governments launch pilot registries to align with international standards. Vendors integrate automated edit checks and ICD-O-3 coding tools to help customers comply without adding staff. As regulators emphasize same-year reporting, cloud-hosted analytics and interoperability functions become indispensable, underpinning steady gains in the Cancer registry software market.
Shift Toward Cloud Deployment for Cost & Accessibility
The CDC’s Data Modernization Initiative itself migrated registry infrastructure to a HIPAA-ready cloud, validating the model for community health systems. Subscription pricing lowers entry barriers for small providers, eliminating server purchases while enabling elastic storage for imaging and genomic files. Tumor registrars now log in from remote sites, maintaining productivity despite workforce shortages. Disaster-recovery and version-control functions are automated, satisfying stringent audit trails required by state cancer laws. Meanwhile, embedded AI and machine-learning APIs permit advanced case-finding and duplicate-detection without dedicated data-science teams.
AI-Driven Auto-Abstraction Cuts Registry Backlog
Oak Ridge National Laboratory prototypes multitasking AI engines that extract stage, histology, and treatment data from unstructured notes on supercomputers, slashing manual abstraction cycles. Commercial vendors such as Azra AI apply natural-language processing to pathology reports, exporting NAACCR-compliant abstracts in minutes. British Columbia’s registry reports meaningful reductions in coding times after adopting NLP pipelines. These advances offset the scarcity of certified tumor registrars, a workforce gap flagged by the National Cancer Registrars Association. Accelerated throughput enhances data timeliness, positioning AI as a central growth catalyst for the Cancer registry software market.
Restraints Impact Analysis of Cancer Registry Software Market*
| Restraint | % Impact on CAGR Forecast | Geographic Relevance | Impact Timeline |
|---|---|---|---|
| Privacy & security concerns over PHI | -1.2% | Global, with strictest impact in EU under GDPR | Short term (≤ 2 years) |
| High implementation cost for smaller providers | -0.9% | Developing markets and rural healthcare systems | Medium term (2-4 years) |
| Shortage of certified tumor registrars | -1.1% | North America & EU primarily, emerging in APAC | Long term (≥ 4 years) |
| Inconsistent international data standards | -0.8% | Global, with highest impact on multinational organizations | Long term (≥ 4 years) |
| Source: Mordor Intelligence | |||
Privacy & Security Concerns Over PHI
Healthcare breaches climbed past 40 million records in 2024, elevating scrutiny of oncology registries that hold highly sensitive genomic and treatment data. Registries must comply with HIPAA yet still expedite public-health reporting, forcing adoption of multifactor authentication, granular role-based access, and field-level encryption. Cloud vendors respond with dedicated healthcare instances that undergo SOC 2 and HITRUST audits, but implementation complexity raises costs and elongates deployment timelines. European installations face stringent GDPR transfer rules, complicating cross-border clinical-trial registries. These factors temper near-term uptake, narrowing budgets for prospective Cancer registry software market buyers.
High Implementation Cost for Smaller Providers
CDC studies show average registry costs vary widely, with low-volume programs spending up to USD 29.20 per case, outstripping financial capacity of rural hospitals. Licensing fees, training, and data-migration projects strain limited IT staffs. Cloud subscriptions reduce capital outlays yet introduce ongoing operational charges that can still exceed per-case reimbursement. The disparity is starker in developing regions, where competing health priorities limit registry allocations despite rising cancer incidence. Vendors respond by offering modular deployments and pay-as-you-go analytics, but affordability remains a barrier dampening the Cancer registry software market’s reach among small providers.
*Our forecasts treat driver/restraint impacts as directional, not additive. The impact forecasts reflect baseline growth, mix effects, and variable interactions.
Cancer Registry Software Market Segment Analysis
By Deployment Model:
Cloud Migration Accelerates Healthcare TransformationCloud platforms captured 60.62% of 2025 revenue, supported by providers’ preference for elastic storage and remote user access. This share translates into the single largest slice of the Cancer registry software market size, and the segment will sustain a 12.23% CAGR through 2031. Academic health centers still favor on-premise for data-sovereignty reasons, but even these institutions pilot hybrid architectures to leverage AI micro-services.
Continuous software updates, integrated NLP toolkits, and automated quality checks attract community hospitals that once lacked IT talent. Public-cloud security certifications now encompass HITRUST, ISO 27001, and FedRAMP levels, easing board-level concerns. Taken together, these advantages explain why cloud adoption is now the most visible hallmark of the Cancer registry software market.


By Database Type:
Public Databases Gain MomentumCommercial products retained 53.02% revenue in 2025, demonstrating deep functionality and customer support, yet public platforms funded by national cancer agencies grow at 11.67% CAGR. Programs like Registry Plus supply free abstracting tools, expanding access for under-resourced states and territories. The Cancer registry software market share held by commercial vendors therefore remains solid but not unassailable.
Governments allocate grants to modernize public registries, driving upgrades to HL7 FHIR interfaces, cloud storage, and real-time dashboards. Commercial suppliers counter with proprietary analytics, precision-oncology modules, and enhanced UX. Competition intensifies around AI-assisted abstraction, with both sectors integrating machine learning to maintain relevance amid shifting procurement priorities.
By End Use:
Government Investment Drives Public Health ExpansionHospitals and medical practices generated 41.58% of 2025 revenue, cementing their position as the core buyer group. Still, government and third-party entities—public-health agencies, payers, and academic consortia—grow fastest at 11.64% CAGR. In value terms, this cohort enlarges the Cancer registry software market size by channeling grants toward statewide data hubs and national screening initiatives.
Outcomes-based reimbursement models encourage private insurers to link claims with registry outcomes, while research institutes integrate trial-matching algorithms. Pharmaceutical sponsors use registries to monitor post-marketing safety, adding fresh demand streams. Together these dynamics broaden the user base, diversifying revenue beyond traditional hospital contracts.
Geography Analysis
North America Cancer Registry Software Market
North America led the Cancer registry software market with 44.20% revenue in 2025, reflecting mature IT infrastructure and mandatory reporting under state cancer laws. The CDC funds 46 jurisdictions to operate registries that cover 97% of the U.S. population, and Canada maintains provincial programs aligned through NAACCR standards. Continued cloud migration and electronic case-finding reinforce regional dominance.
Broader European Markets
Europe forms the second-largest cluster, characterized by harmonized EU data-sharing projects and robust funding for population-based registries. GDPR compliance adds complexity but also drives adoption of advanced encryption and consent-management modules, spurring steady albeit moderate growth across Germany, France, and the Nordics. Cross-border research collaborations foster demand for interoperable solutions capable of multi-language coding and pan-European analytics.
APAC Cancer Registry Software Market
Asia-Pacific posts the highest 11.74% CAGR through 2031. China, India, and Australia expand registry networks to counter rising incidence rates, guided by the Asia Cohort Consortium’s interoperability frameworks. Governments channel capital into cloud-hosted platforms because they sidestep constrained local IT resources. Vendors tailoring low-bandwidth modules and multilingual interfaces secure early contracts, positioning the region as the next frontier for the Cancer registry software market.

Competitive Landscape
Competition is moderately fragmented. Technology giants—IBM, Oracle Cerner, McKesson—use their broad EHR ecosystems to bundle registry modules, while niche specialists such as Elekta, NeuralFrame, and Azra AI focus on oncology-specific automation. AI capabilities, cloud readiness, and HL7 FHIR interoperability now define product roadmaps, raising the innovation bar.
Strategic acquisitions intensify consolidation. Health Catalyst purchased Carevive Systems and ARMUS in 2024, enhancing its oncology analytics[2]Health Catalyst, “Health Catalyst Acquires Carevive Systems,” healthcatalyst.com. Varian and Siemens Healthineers jointly promote ARIA CORE, uniting imaging and registry workflows to streamline end-to-end cancer care[3]Varian Medical Systems, “Varian Showcases ARIA CORE at ASTRO 2024,” varian.com. Such moves illustrate how vendors integrate upstream diagnostics with downstream outcomes tracking to cement customer lock-in.
White-space opportunities persist in underserved regions where registry penetration remains low and in emerging sub-segments such as pediatric oncology, rare diseases, and cross-border genomic data hubs. Vendors embracing blockchain frameworks for consent management and wearable-device ingestion aim to leapfrog incumbents on data-integrity and real-world-evidence services, broadening the addressable Cancer registry software market.
Cancer Registry Software Industry Leaders
C/NET Solutions
IBM Corporation
Siemens Healthineers
McKesson Corporation
Elekta
- *Disclaimer: Major Players sorted in no particular order
Cancer Registry Software Market Companies Covered in this Report
- C/NET Solutions
- Conduent Inc
- Electronic Registry Systems Inc.
- Elekta
- himagine Solutions
- IBM
- Mckesson
- NeuralFrame Inc
- Onco Inc
- Ordinal Data Inc
- Rocky Mountain Biologicals
- Siemens Healthineers
- Azra AI
- Oncora Medical
- Oracle
- Dacima Software
- IARC (CanReg5)
- ImageTrend Inc
- CDC – Registry Plus

Recent Industry Developments in Cancer Registry Software Market
- June 2025: Artera launched a real-world registry to monitor AI’s clinical impact in oncology – a milestone for evidence-based adoption of AI-enhanced registries.
- October 2024: GE HealthCare unveiled CareIntellect for Oncology, a cloud-first platform that aggregates multimodal data using generative AI, with 2025 rollout planned.
- September 2024: Varian and Siemens Healthineers demonstrated ARIA CORE at ASTRO 2024, showcasing integrated imaging and registry software.
- June 2024: Health Catalyst acquired Carevive Systems, boosting its treatment-planning and registry capabilities.


Cancer Registry Software Market Report Scope and Research Methodology
Market Definition and Coverage
Our study defines the cancer registry software market as purpose-built digital platforms that collect, store, manage, and export standardized data on patients diagnosed with malignant and in-situ tumors across population-based and hospital-based registries. According to Mordor Intelligence, only revenue from new license, subscription, and implementation services tied directly to registry applications is counted.
Scope exclusion: The analysis omits broader oncology information systems, generic electronic health record modules, and bespoke spreadsheets not sold commercially.
Segments Covered in This Report
- By Deployment Model
- On-Premise
- Cloud-based
- By Database Type
- Commercial Database
- Public Database
- By End Use
- Government & Third-Party
- Private Payers
- Hospital & Medical Practice
- Others
- By Geography
- North America
- United States
- Canada
- Mexico
- Europe
- Germany
- United Kingdom
- France
- Italy
- Spain
- Rest of Europe
- Asia-pacific
- China
- Japan
- India
- Australia
- South Korea
- Rest of Asia-pacific
- Rest of the World
- North America
Data Sources, Market Sizing, and Validation
Primary Research
Mordor analysts interviewed certified tumor registrars, hospital CIOs, oncology IT vendors, and state program managers across North America, Europe, and Asia Pacific. These discussions validated adoption triggers, average abstraction workloads, cloud migration hurdles, and real-world contract values that were missing from desk work before feeding assumptions back into the model.
Desk Research
We began by mapping the care pathway through public data sets such as CDC's National Program of Cancer Registries, the SEER database, WHO GLOBOCAN statistics, and European Network of Cancer Registries publications. Trade associations such as the North American Association of Central Cancer Registries and peer-reviewed journals like Journal of Registry Management supplied incidence, completeness, and cost-per-case benchmarks. Company filings, FDA software listings, and news feeds on Dow Jones Factiva and D&B Hoovers offered pricing clues and competitive moves. Many additional public and proprietary sources were also reviewed during evidence gathering.
Market-Sizing & Forecasting
A top-down incidence-to-demand model converts new cancer cases into software seats by applying registry coverage ratios, abstractor throughput, and average spend per workstation. Results are corroborated with selective bottom-up checks such as vendor revenue roll-ups and sampled license price times volume to fine-tune totals. Key variables tracked include annual diagnosed cases, EHR penetration, certified registrar headcount, state reporting mandates, and cloud share of deployments. Multivariate regression on these drivers, blended with scenario analysis around regulatory tightening, produces the 2025-2030 outlook. Gaps in bottom-up granularity are bridged using nearest-neighbor analogs and practitioner feedback.
Data Validation & Update Cycle
Outputs pass three layers of analyst review, variance checks against external series, and reconciliation calls with select respondents. Our models refresh each year, with interim tweaks when material policy or vendor events surface, and then a final sense check occurs before report release.
How Mordor Intelligence's Cancer Registry Software Market Size Compares to Other Published Estimates
Published figures often diverge because firms pick different functional scopes, pricing ladders, and update rhythms. We address these issues head-on by anchoring every step to transparent cancer incidence statistics and live contract data, which are then cross-walked through our top-down and bottom-up blend.
Key gap drivers include whether maintenance revenue is counted, how aggressively cloud discounts are assumed, and the cadence at which smaller geographies are refreshed. Mordor reports current-year values, whereas some publishers project mid-cycle figures or use static exchange rates, creating visible spreads.
Benchmark comparison
| Market Size | Anonymized source | Primary gap driver |
|---|---|---|
| USD 99.1 Mn (2025) | Mordor Intelligence | - |
| USD 84.1 Mn (2024) | Global Consultancy A | Excludes implementation fees; relies on 2022 incidence base |
| USD 78.6 Mn (2023) | Industry Journal B | Uses single ASP for all regions; no cloud versus on-premise split |
Taken together, the comparison shows that Mordor's disciplined scoping, fresher base year, and dual-path validation yield a balanced, decision-ready baseline that clients can trace back to clear variables and repeat the following year with confidence.


Key Questions Answered in the Report
What is the projected value of the Cancer registry software market by 2031?
The market is forecast to reach USD 185.09 million by 2031, growing at an 10.98% CAGR.
Which deployment model is expanding fastest?
Cloud-based solutions are advancing at a 12.23% CAGR, driven by lower upfront costs and remote accessibility.
Why is Asia-Pacific the fastest-growing region?
Rapid growth in cancer incidence, expanding healthcare infrastructure, and new government-funded registries propel the region’s 11.74% CAGR.
How are AI technologies affecting registry operations?
Natural-language processing and machine learning automate data abstraction, helping registries overcome tumor-registrar shortages and improve data timeliness.
What are the main barriers to adoption among small providers?
High implementation costs, limited IT staff, and stringent data-security requirements hinder uptake, especially in developing markets.
Which companies recently made strategic moves in this space?
Health Catalyst’s 2024 acquisition of Carevive Systems and Varian’s partnership with Siemens Healthineers illustrate ongoing consolidation and technology integration trends.
Page last updated on:


