Canada Data Center Water Consumption Market Size and Share
Market Overview
| Study Period | 2020 - 2031 |
|---|---|
| Forecast Data Period | 2026 - 2031 |
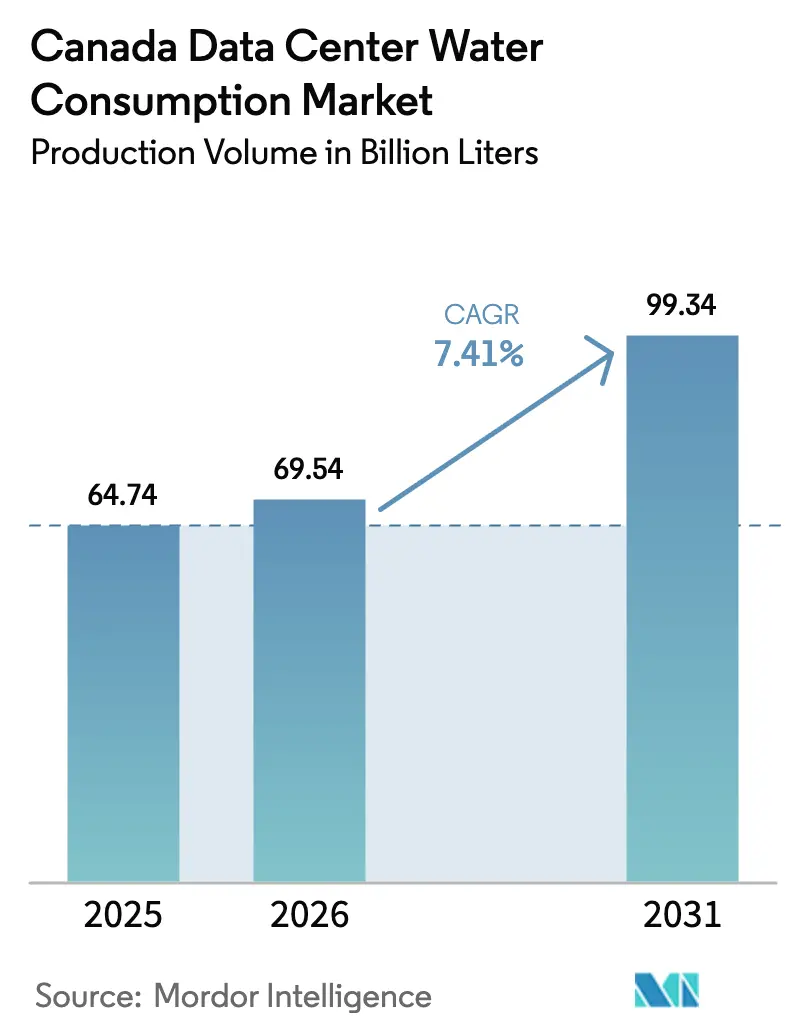
| Base Year Market Size (2025) | 64.74 Billion liters |
| Market Volume (2026) | 69.54 Billion liters |
| Market Volume (2031) | 99.34 Billion liters |
| Growth Rate (2026 - 2031) | 7.41% CAGR |
| Market Concentration | Medium |
Major Players *Disclaimer: Major Players sorted in no particular order Image © Mordor Intelligence. Reuse requires attribution under CC BY 4.0. | |
Canada Data Center Water Consumption Market Analysis by Mordor Intelligence
The Canada data center water consumption market size was valued at 64.74 billion liters in 2025 and estimated to grow from 69.54 billion liters in 2026 to reach 99.34 billion liters by 2031, at a CAGR of 7.41% during the forecast period (2026-2031). The intensification of investment by hyperscale and colocation operators, the migration toward liquid-cooled architectures for artificial-intelligence workloads, and provincial incentives that reward non-potable water sourcing are the primary demand catalysts. Treated effluent already supplies more than half of aggregate withdrawals, underscoring how operators are redesigning cooling loops to sidestep municipal caps and curb community resistance. Rapid tariff escalation by large utilities, coupled with district heating partnerships that monetize waste heat, is shaping procurement strategies and accelerating the shift to closed-loop designs. Competitive differentiation is now anchored in the ability to secure multi-year water withdrawal rights, integrate heat reuse networks, and disclose granular water intensity metrics that withstand ESG scrutiny.
Key Report Takeaways
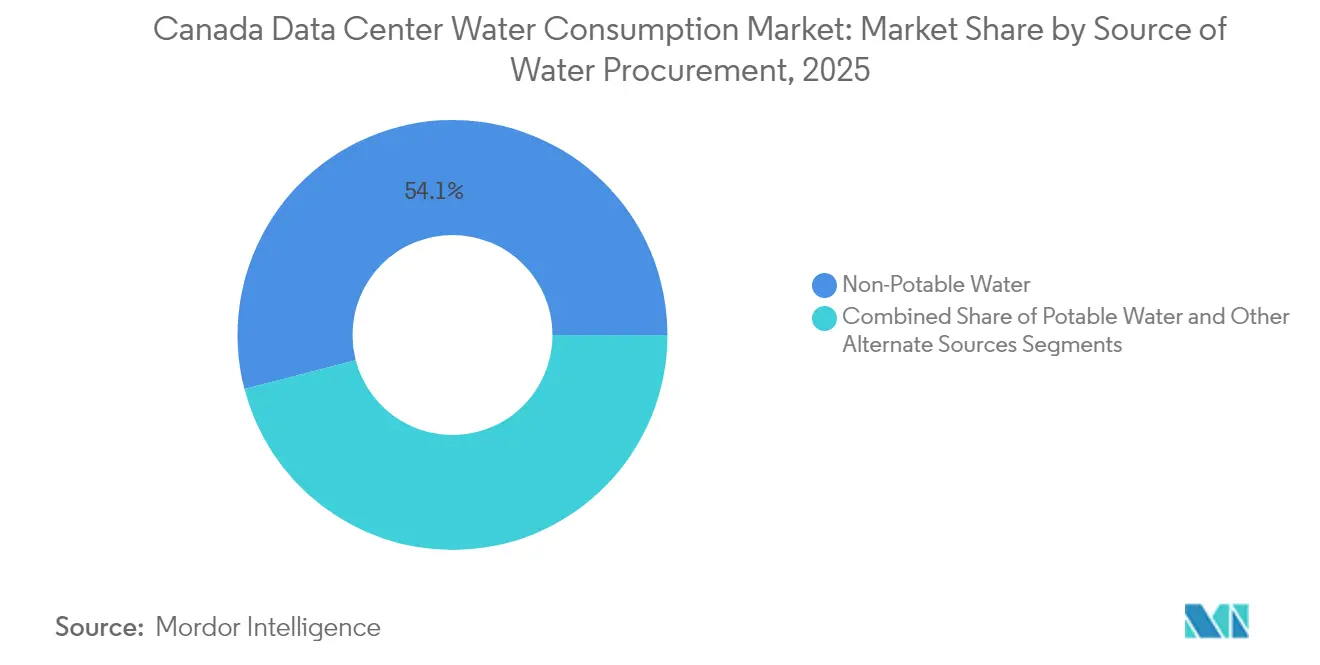
- By source of water procurement, non-potable water captured 54.05% of the Canada data center water consumption market share in 2025, while other alternate sources are projected to expand at a 8.78% CAGR through 2031.
- By data center type, cloud service providers accounted for 51.10% of the Canadian data center water consumption market size in 2025, and the colocation segment is projected to advance at an 8.62% CAGR through 2031.
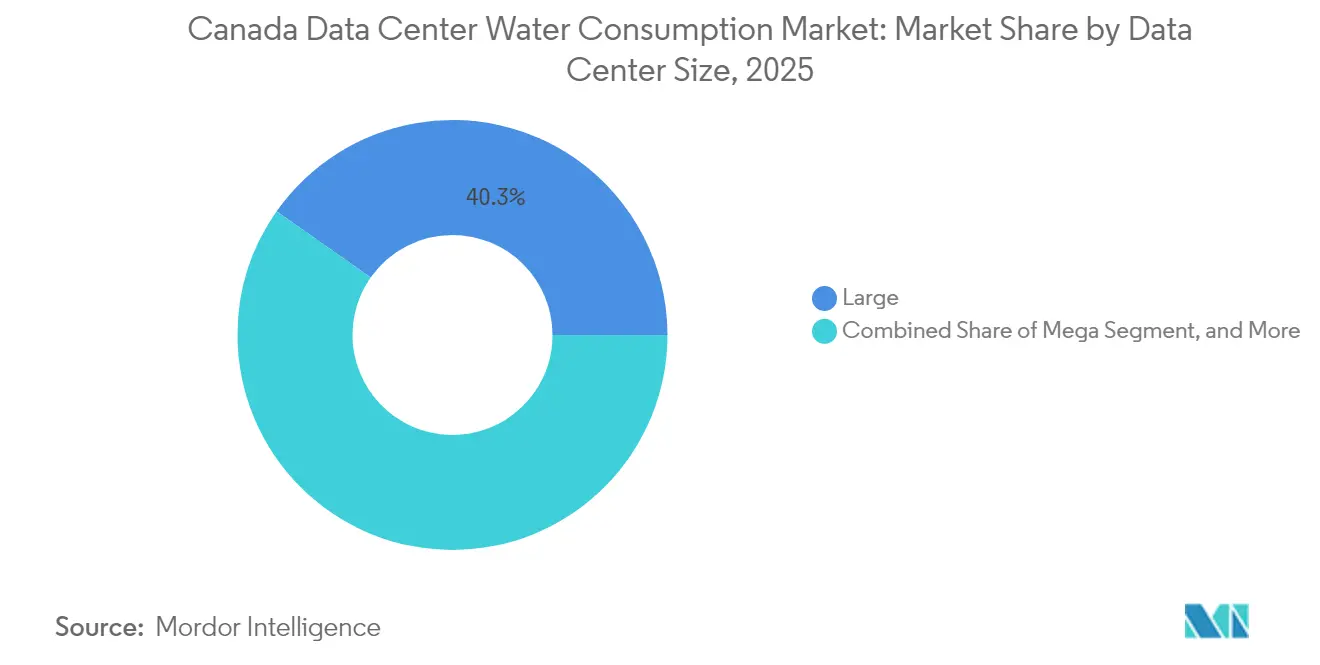
- By data center size, large data centers held a 40.25% share of the Canadian data center water consumption market size in 2025; yet, mega facilities are forecast to grow at a 9.17% CAGR between 2026 and 2031.
- By cooling technology, chilled water systems led with 43.35% of the Canadian data center water consumption market share in 2025, whereas liquid immersion cooling is projected to record the highest CAGR at 9.28% through 2031.
Note: Market size and forecast figures in this report are generated using Mordor Intelligence’s proprietary estimation framework, updated with the latest available data and insights as of 2026.
Worldwide, activity is shaped by contributions from multiple countries and regions, with Canada representing one among them. The global report on data center water consumption market by Mordor Intelligence reflects how these countries and regional layers combine into a single system.
Canada Data Center Water Consumption Market Trends and Insights
Drivers Impact Analysis*
| Driver | (~) % Impact on CAGR Forecast | Geographic Relevance | Impact Timeline |
|---|---|---|---|
| Surge in hyperscale and colocation investments | +1.8% | Ontario, Quebec, British Columbia, Alberta | Medium term (2-4 years) |
| Accelerated AI, 5G deployment elevating rack densities | +2.1% | Ontario, Quebec, with spillover to Alberta | Short term (≤ 2 years) |
| Shift toward liquid cooling higher water draw per kW | +1.5% | Quebec, Ontario, British Columbia | Medium term (2-4 years) |
| Federal and provincial incentives for sustainable DC design | +0.9% | National, with early gains in Quebec, British Columbia | Long term (≥ 4 years) |
| Heat-reuse agreements with district-energy networks | +0.7% | Ontario (Toronto), Quebec (Montreal), British Columbia (Vancouver) | Long term (≥ 4 years) |
| Growing use of treated effluent to lock-in future supply | +1.2% | Alberta, Ontario, Quebec | Medium term (2-4 years) |
| Source: Mordor Intelligence | |||
Surge in Hyperscale and Colocation Investments
Capital spending by hyperscale and multitenant operators topped CAD 2.5 billion in 2024, with eStruxture’s CAD 750 million Calgary campus and OVHcloud’s CAD 145 million Toronto expansion exemplifying the new-build wave. Most of these projects are concentrated in provinces that offer long-duration withdrawal permits and tax credits to subsidize closed-loop cooling hardware. Consolidation of enterprise workloads into shared facilities reduces the per-rack water intensity by up to 30%, yet the absolute draw increases because the aggregate IT load is expanding faster than the efficiency gains can be achieved. The federally funded Investing in Canada Infrastructure Program finances up to 40% of liquid-cooling upgrades, shortening payback periods and crowding legacy air-cooled halls out of the expansion pipeline.[1]Government of Canada, “Investing in Canada Infrastructure Program,” infrastructure.gc.ca As operators replace vintage evaporative towers with heat-reuse loops, the Canada data center water consumption market gains structural tailwinds.
Accelerated AI, 5G Deployment Elevating Rack Densities
Rack densities jumped from 8 kW in 2023 to peaks of 140 kW in 2024 as NVIDIA H100 and AMD MI300 accelerators became mainstream, rendering air systems inadequate for thermal control. Direct-to-chip plates and immersion tanks increase facility-level withdrawals by 40-60% yet reduce energy consumption by 25-35% through lower fan loads, creating a trade-off that favors water when provincial power is carbon-constrained. The CRTC’s CAD 8.9 billion 5G spectrum auction signals sustained edge build-outs, multiplying the number of suburban sites drawing on municipal supply. Consequently, the Canada data center water consumption market now tracks AI compute growth more closely than raw floor space expansion.
Shift Toward Liquid Cooling Higher Water Draw per kW
Immersion and direct-to-chip systems consumed 1.8-2.2 liters per kWh in 2024, versus 0.9-1.3 liters for chilled-water air handlers. However, operators tolerate the delta because 60-80% of the waste heat can be valorized through district heating networks. Microsoft’s Toronto campus diverts thermal output into Enwave Energy’s downtown pipe loop, generating CAD 600,000 in annual revenue and displacing natural-gas boilers.[2]Enwave Energy, “District Heating Partnership with Microsoft,” enwave.com Hydro-Quebec awards a 15% power discount to sites that export heat, adding a supplemental incentive layer. These economic trends are driving the Canadian data center water consumption market toward technologies that transform water from a cost center to a revenue-generating stream.
Federal and Provincial Incentives for Sustainable DC Design
The 2024 federal budget introduced a 30% refundable tax credit for facilities achieving Water Usage Effectiveness below 0.5 liters per kWh, while British Columbia’s CleanBC program reimburses half the capital cost of non-potable sourcing infrastructure. Quebec’s C-Vert tax credit raises the rebate to 40% when closed-loop systems eliminate evaporative loss. These policies compress the payback of advanced cooling retrofits from 7 years to 4 years, steering new capacity into provinces that align power-carbon intensity with progressive water policy. As a result, the regional share within the Canada data center water consumption market is tilting toward Quebec and British Columbia.
Restraints Impact Analysis*
| Restraint | (~) % Impact on CAGR Forecast | Geographic Relevance | Impact Timeline |
|---|---|---|---|
| Community scrutiny and withdrawal-permit caps | -1.3% | Ontario, Alberta, British Columbia | Short term (≤ 2 years) |
| Escalating water and wastewater tariffs by utilities | -0.9% | Ontario, Quebec | Medium term (2-4 years) |
| Intensifying competition for freshwater from other sectors | -0.7% | Alberta, Ontario | Long term (≥ 4 years) |
| Emerging ESG-driven liabilities on disclosed water footprint | -0.6% | National, with heightened scrutiny in Ontario, British Columbia | Medium term (2-4 years) |
| Source: Mordor Intelligence | |||
Community Scrutiny and Withdrawal-Permit Caps
Eight permit applications were delayed or denied in 2024 as municipalities weighed aquifer stress against economic benefits; Innisfil, Ontario, famously rejected a 50 MW proposal after residents raised concerns about well levels.[3]Town of Innisfil, “Data Center Water Withdrawal Permit Denial,” innisfil.ca Alberta’s Water Act now requires expensive hydrogeological studies that can add two years to the entitlement timeline. British Columbia’s precedence system relegates data centers to the lowest allocation tier, making curtailment likely during droughts. Operators therefore structure non-potable contracts early in the site selection process; however, only 12 municipal plants currently provide tertiary-treated effluent, which constrains growth nodes within the Canadian data center water consumption market.
Escalating Water and Wastewater Tariffs by Utilities
Ontario and Quebec utilities lifted combined water-sewer charges 8-12% in 2024 to finance CAD 30 billion in infrastructure renewal, adding CAD 270,000 in annual opex to a typical 10 MW facility in Toronto. Montreal’s tiered discharge fee now penalizes once-through designs at CAD 0.0038 per liter. Alberta regulators have proposed a premium rate for dischargers above 10,000 m³ per month. These surcharges erode colocation margins locked into multi-year customer contracts and raise the hurdle rate for all-new builds, thereby moderating the baseline growth of the Canada data center water consumption market.
*Our forecasts treat driver/restraint impacts as directional, not additive. The impact forecasts reflect baseline growth, mix effects, and variable interactions.
Segment Analysis
By Source of Water Procurement: Non-Potable Agreements Dominate
Non-potable arrangements captured 54.05% of the Canada data center water consumption market share in 2025, reflecting operators’ push to shield projects from municipal permit caps. Treated effluent, industrial gray water, and rain-harvested supply collectively rose at a 8.78% CAGR, buoyed by federal grants that reimburse up to 40% of fit-out costs. Google’s U.S. success with tertiary wastewater is influencing Canadian siting strategy, prompting Toronto and Montreal to fast-track capacity upgrades at their wastewater plants. Potable water still anchors small enterprise sites, yet rising tariffs are prompting even modest facilities to evaluate on-site recycling units. Consequently, provincial differences in sewer treatment sophistication now shape capital deployment patterns across the Canadian data center water consumption market.
Investment is clustering near municipal plants capable of tertiary treatment, creating a two-tier environment in which Toronto, Montreal, Calgary, and Vancouver enjoy lower effective water costs than secondary cities. Rain capture is emerging for edge modules in British Columbia and Alberta, where high precipitation increases roof-harvest yield. Quebec’s six-month fast-track for projects using 75% non-potable supply further accelerates adoption, and these policy rewards are expected to lift the non-potable slice of the Canada data center water consumption market size to above 60% by 2031.


By Data Center Type: Cloud Leads, Colocation Accelerates
Cloud providers absorbed 51.10% of demand in 2025 thanks to AI training clusters that can draw 2-3 times the cooling water of legacy enterprise halls. Colocation, however, is forecast to grow at an 8.62% CAGR to 2031 as enterprises abandon on-premises rooms and amortize liquid-cooling costs across multi-tenant footprints. Operators such as eStruxture and Vantage are tailoring new campuses for GPU-dense racks, leveraging treated-effluent contracts to keep tariffs predictable. Enterprise sites continue to rationalize, which liberates municipal supply for bigger players, reinforcing scale advantages within the Canada data center water consumption industry.
Competitive tension arises where hyperscalers negotiate direct effluent rights, sidestepping colo landlords and tightening water markets in urban cores. Colocation firms counter by bundling district-heating partnerships to monetize waste heat; however, fragmented tenant loads hinder aggregation. Edge providers carve out whitespace by offering water-efficient micro-modules for 5G and industrial IoT deployments, adding diversity to the Canada data center water consumption market.
By Data Center Size: Mega Facilities Accelerate
Mega campuses grew at a 9.17% CAGR, pulling the category toward a 2031 share that will eclipse 45% of total withdrawals. Quebec and Alberta attract these footprints due to discounted renewable power and multi-year withdrawal permits that smooth regulatory risk. Large facilities retained a 40.25% share in 2025, a legacy of earlier colocation builds, but their growth rate lags as capital shifts into hyperscale hubs. Medium and small sites consolidate, simplifying municipal oversight and compressing the geographic footprint of the Canada data center water consumption market size.
Ten-year permits in Quebec insulate mega-scale operators from tariff shocks, cementing cost advantages over smaller rivals who are forced into annual renewals. This structural gap accelerates M&A and underpins a long-run reshaping of the competitive map. Municipalities in Ontario and British Columbia are now actively courting mega investments by pairing renewable power blocks with effluent allocations, illustrating how water policy has become a front-line incentive in the Canadian data center water consumption market.
By Cooling Technology: Immersion Outpaces Legacy Chilled Water
Chilled-water plants still accounted for 43.35% of consumption in 2025, yet immersion and direct-to-chip solutions are growing at a 9.28% CAGR as operators pursue heat-recovery revenue. Immersion enables recovery of 70-80% of waste heat at viable district-heating temperatures, turning water draw into a profit center. Microsoft’s Toronto tie-in delivers 15 MW of thermal load to Enwave Energy, translating into CAD 600,000 in annual income. Direct-to-chip retrofits provide a gateway path for brownfield operators, particularly colocation landlords managing mixed-density racks.
Adiabatic and hybrid systems shrink as evaporative tower bans spread; regulators prefer closed-loop circuitry that curtails discharge volumes. Provincial subsidies cut retrofit payback to roughly four years, so adoption curves steepen. By 2031, liquid solutions are expected to account for more than 55% of the Canadian data center water consumption market.
Geography Analysis
Ontario remained the largest consumer in 2025, leveraging Toronto’s dense fiber infrastructure, proximity to U.S. exchanges, and established colocation ecosystem. Water-use surcharges of CAD 0.0045 per liter imposed in 2024 inflated opex by CAD 270,000 for a typical 10 MW hall, squeezing colocation margins. Stringent permit caps slowed expansions, forcing developers to scout areas such as Ottawa and Kitchener-Waterloo, where aquifer capacity is less constrained. Community backlash lengthened approval cycles to 18 months, raising carrying costs and tempering near-term growth of the Canada data center water consumption market in the province.
Quebec is the fastest-growing hub, due to power prices that are 40% below Ontario’s baseline and a regulatory environment that grants ten-year withdrawal permits for investments exceeding CAD 100 million. Vantage’s 36 MW campus extension and QScale’s heat-reuse blueprint highlight the province’s attraction for AI-training workloads. Hydro-Québec’s 15% electricity discount for sites exporting heat encourages operators to adopt immersion cooling, thereby reinforcing the province’s structural cost advantage in the Canadian data center water consumption market.
British Columbia and Alberta are emerging challengers. CleanBC grants reimburse half of the non-potable infrastructure spend while Calgary’s tertiary effluent-treated effluent capacity underpins eStruxture’s CAD 750 million campus. Alberta’s Water Act introduces longer approval windows, but the province’s low-cost power and treated effluent availability counterbalance the permitting drag. Remaining provinces capture niche activity in edge and disaster-recovery nodes due to sparse fiber and subdued enterprise demand, leaving the rest of Canada with a slice of the Canadian data center water consumption market that is less than 10%.
Mordor Intelligence provides coverage of the data center water consumption market across other key regional markets, including Europe, Asia, and North America, each with their regulatory frameworks and demand patterns. Detailed country-level analysis extends to Chile, Brazil, Germany, United Kingdom, France, and Netherlands incorporating local coverage and market participation, as required.
Competitive Landscape
The Canada data center water consumption market is moderately fragmented. Hyperscalers such as Microsoft and Google leverage proprietary immersion rigs and direct effluent rights to bypass intermediaries, thereby expanding their share and compressing the margins of third-party cooling contractors. Colocation incumbents retaliate with joint ventures that integrate district-heating interfaces, converting water liabilities into cash-flow-positive assets and securing faster permit approvals. White-space opportunities persist in edge computing, where 5G cores require water-efficient micro-sites dispersed across Tier 2 metros.
Technology selection drives rivalry. Operators racing toward immersion cooling elevate demand for dielectric-fluid vendors while sidelining tower integrators. eStruxture’s Calgary build recirculates 95% of water, setting a new efficiency benchmark that regulators are using as de facto permitting guidance. Regulatory mastery becomes a competitive moat; firms that negotiate multi-year withdrawal rights can insulate themselves from costs and expedite construction, while late adopters face tariff shocks and public hearing delays. Consolidation momentum favors capital-rich hyperscalers and seasoned colocation chains, foreshadowing higher concentration over the forecast horizon.
Canada Data Center Water Consumption Industry Leaders
Cologix Inc.
Equinix Inc.
Digital Realty Trust Inc.
Microsoft Corporation
Google LLC
- *Disclaimer: Major Players sorted in no particular order

Recent Industry Developments
- November 2024: eStruxture Data Centers committed CAD 750 million to a 36 MW Calgary campus that will source 80% of cooling water from tertiary-treated effluent.
- October 2024: Vantage Data Centers added 18 MW in Quebec, deploying immersion tanks that export heat to Montreal’s district-energy grid.
- September 2024: OVHcloud has allocated CAD 145 million to expand its Toronto hall, pairing adiabatic pre-cooling with a treated effluent agreement covering 60% of the draw.
- August 2024: Microsoft partnered with Enwave Energy to monetize 15 MW of waste heat from its Toronto facility.


Canada Data Center Water Consumption Market Report Scope
The Canada Data Center Water Consumption Market Report Segments the Market by Water Procurement Source (Potable, Non-Potable, and Other Alternatives), Data Center Type (Enterprise, Colocation, and Cloud Service Providers), Size (Mega, Massive, Large, Medium, and Small), and Cooling Technology (Liquid Immersion, Direct-to-Chip Liquid, Chilled Water Systems, Adiabatic, and Hybrid Cooling). Forecasts are Presented in Volume Terms (Billion Liters).
| Potable Water |
| Non-Potable Water |
| Other Alternate Sources |
| Enterprise |
| Colocation |
| Cloud Service Providers |
| Mega |
| Massive |
| Large |
| Medium |
| Small |
| Liquid Immersion Cooling |
| Direct-to-Chip Liquid Cooling |
| Chilled Water Systems |
| Adiabatic Cooling |
| Hybrid Cooling |
| By Source of Water Procurement | Potable Water |
| Non-Potable Water | |
| Other Alternate Sources | |
| By Data Center Type | Enterprise |
| Colocation | |
| Cloud Service Providers | |
| By Data Center Size | Mega |
| Massive | |
| Large | |
| Medium | |
| Small | |
| By Cooling Technology | Liquid Immersion Cooling |
| Direct-to-Chip Liquid Cooling | |
| Chilled Water Systems | |
| Adiabatic Cooling | |
| Hybrid Cooling |


Key Questions Answered in the Report
How large is Canada’s data center water demand in 2026?
The Canada data center water consumption market size measured 69.54 billion liters in 2026.
What is the expected growth rate through 2031?
Aggregate withdrawals are forecast to rise at a 7.41% CAGR (2026-2031), reaching 99.34 billion liters by 2031.
Which cooling method is expanding fastest?
Liquid immersion cooling is advancing at a 9.28% CAGR because it enables profitable heat reuse.
Why are non-potable sources gaining share?
Treated effluent shields projects from municipal caps and already supplies 54.05% of total withdrawals.
Which provinces offer the most favorable water policy?
Quebec and British Columbia combine low-cost renewable power, multi-year withdrawal permits, and tax credits that reward heat recovery.
What risks could slow future capacity additions?
Permit delays, rising water-sewer tariffs, and community opposition in drought-sensitive zones could dampen project pipelines.
Page last updated on:


