
Canada Construction Equipment Market Size and Share
Market Overview
| Study Period | 2020 - 2031 |
|---|---|
| Forecast Data Period | 2026 - 2031 |
| Base Year Market Size (2025) | USD 2.92 Billion |
| Market Size (2026) | USD 3.09 Billion |
| Market Size (2031) | USD 4.1 Billion |
| Growth Rate (2026 - 2031) | 5.83 % |
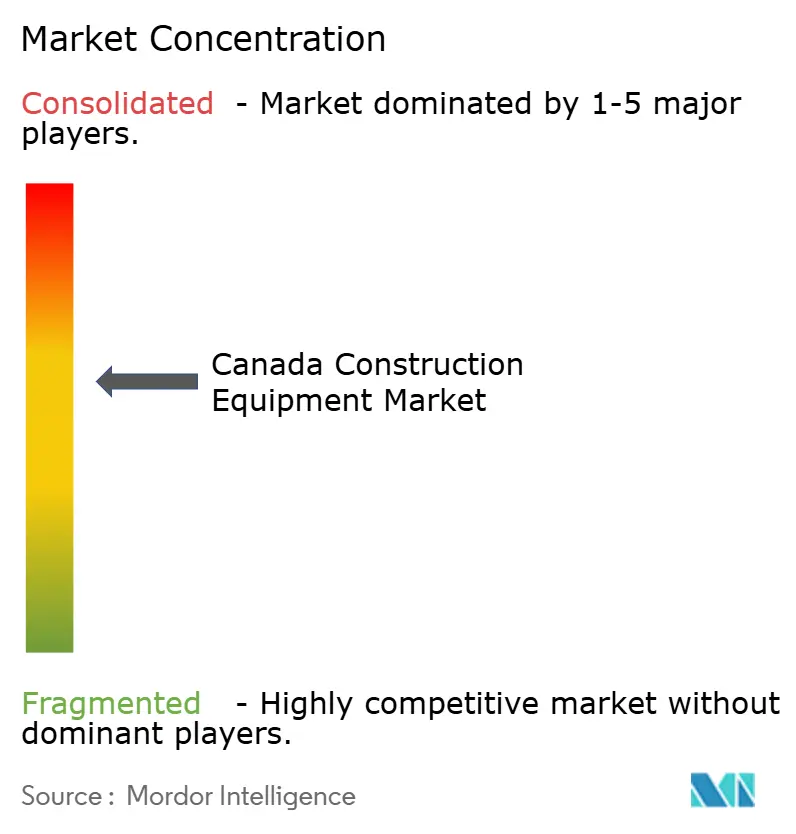
| Market Concentration | Medium |
Major Players *Disclaimer: Major Players sorted in no particular order Image © Mordor Intelligence. Reuse requires attribution under CC BY 4.0. | |
Canada Construction Equipment Market Analysis by Mordor Intelligence
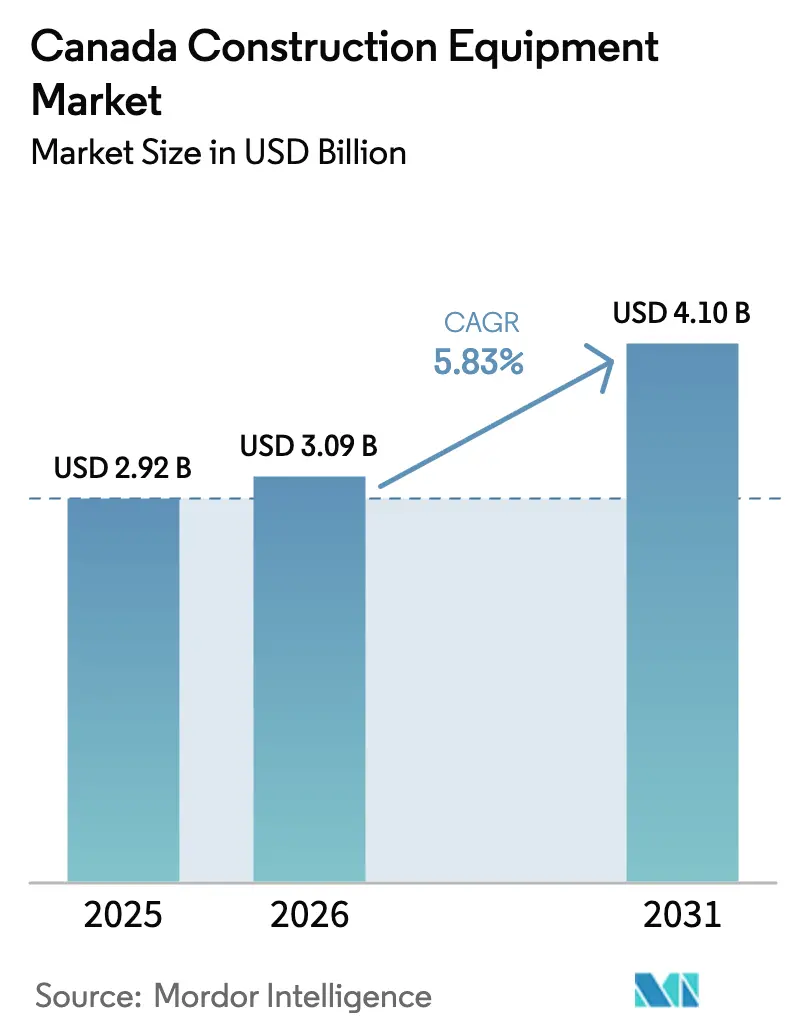
The Canadian construction equipment market size was valued at USD 2.92 billion in 2025 and estimated to grow from USD 3.09 billion in 2026 to reach USD 4.1 billion by 2031, at a CAGR of 5.83% during the forecast period (2026-2031). Robust federal infrastructure allocations, a rebound in housing starts, and critical minerals projects underpin near-term expansion, while electrification incentives add a longer-term growth layer for urban fleets[1]“Critical Minerals Strategy,”, Natural Resources Canada, Government of Canada, nrcan.gc.ca. Contractors in all provinces benefit from a synchronized pipeline of transportation corridors, defense bases, LNG facilities, and data-center buildouts that collectively lift equipment utilization. Dealer networks report rising quotations for compact excavators and electrically powered skid-steer loaders as urban densification policy tightens space and emission constraints. Simultaneously, rental penetration is at a record high, forcing OEMs to pair product launches with flexible finance schemes to safeguard share in the Canadian construction equipment market.
Key Report Takeaways
- By machinery type, crawler excavators led with 44.10% of the Canadian construction equipment market share in 2025, and mini/compact excavators are advancing at a 6.62% CAGR through 2031.
- By propulsion, internal-combustion units held 95.05% of the Canadian construction equipment market size in 2025, while electric and hybrid systems recorded the highest 12.85% CAGR to 2031.
- By end-user industry, construction and infrastructure captured 57.65% revenue share in 2025; utilities and energy are forecast to expand at a 6.55% CAGR through 2031.
- By application, excavation and earth-moving accounted for a 53.95% share of the Canadian construction equipment market size in 2025, and material handling is progressing at a 5.98% CAGR to 2031.
- By geography, Ontario retained 36.30% share in 2025, whereas British Columbia is projected to post the fastest 5.85% CAGR between 2026-2031.
Note: Market size and forecast figures in this report are generated using Mordor Intelligence’s proprietary estimation framework, updated with the latest available data and insights as of 2026.
Canada Construction Equipment Market Trends and Insights
Drivers Impact Analysis*
| Driver | (~) % Impact on CAGR Forecast | Geographic Relevance | Impact Timeline |
|---|---|---|---|
| Infrastructure Spending Surge | +1.8% | Ontario, Quebec, British Columbia | Long term (≥ 4 years) |
| Housing Starts Rebound | +1.2% | Toronto, Vancouver, Montreal | Medium term (2-4 years) |
| Critical-Minerals CAPEX | +0.9% | Northern Ontario, Quebec, British Columbia | Long term (≥ 4 years) |
| Zero-Emission Machinery Incentives | +0.7% | National, led by British Columbia, Quebec | Medium term (2-4 years) |
| Data-Center Earth-Moving Demand | +0.4% | Ontario, Quebec, Alberta | Short term (≤ 2 years) |
| 3D Concrete Printing Uptake | +0.2% | Remote northern regions | Long term (≥ 4 years) |
| Source: Mordor Intelligence | |||
Surge in Federal and Provincial Infrastructure Spending
Canada is making a long-term commitment to infrastructure development through coordinated federal and provincial effort, generating visible multi-year backlogs for road, bridge, and water projects [2]Infrastructure Canada, “Budget 2024 Highlights,” Government of Canada, canada.ca. Ontario's significant investments in transit and broadband fuel a robust demand for construction equipment. This surge is evident in the large-scale orders for machinery, including excavators, graders, and compactors. Additionally, upgrades in national defense, particularly at remote bases, necessitate heavy earth-moving fleets. As the emphasis on climate resilience grows, project scopes are broadening to encompass flood protection and permafrost stabilization, leading to a heightened demand for specialized attachments. Concurrently, enhanced rural connectivity paves the way for private sector construction, amplifying equipment turnover in Canada's construction machinery market.
Housing Starts Rebound and Urban Densification
In 2024, Canada saw a 2% increase in housing starts in urban centers with populations of 10,000 or more, recording 227,697 units, up from 223,513 in 2023[3]Canada Mortgage and Housing Corporation, “Starts & Completions Survey 2024,” CMHC, cmhc-schl.gc.ca. Toronto, Vancouver, and Montreal have rezoned single-family districts for higher-density builds, spurring demand for mini excavators and low-noise electric skid steers to maneuver tight downtown lots. A CAD 4 billion federal housing accelerator fund guarantees multi-year visibility, while modular construction’s rise shifts activity toward precision lifting and telehandler fleets. These dynamics sustain urban equipment utilization during winter months that usually see idle time, reinforcing sales pipelines in the Canadian construction equipment market.
Critical-Minerals Mining CAPEX
Canada's identification of essential minerals has paved the way for significant investments in exploration and processing, especially in resource-abundant areas like the Ring of Fire and Abitibi belts. These expansive projects necessitate durable construction equipment adept at functioning under harsh conditions. The demand for such equipment isn't limited to mining sites; it also spans essential infrastructure, including haul roads and transmission lines. To mitigate downtime in isolated regions, contractors gravitate towards high-capacity machines integrated with telematics. This trend underscores the sustained demand for premium equipment in Canada's construction landscape.
Uptake of 3D Concrete Printing in Remote Communities
Remote Canadian communities are increasingly embracing 3D concrete printing. Early pilot projects, including those for the Siksika Nation, showcase benefits like quicker construction times and less material waste. These advancements necessitate meticulous site preparation. As a result, upcoming projects in areas such as Yukon and Nunavut are turning to compact track loaders fitted with laser-guided blades. Furthermore, federal reconciliation efforts are backing these pilot projects, underscoring a rising demand for specialized construction equipment designed for automated building technologies.
Restraints Impact Analysis*
| Restraint | (~) % Impact on CAGR Forecast | Geographic Relevance | Impact Timeline |
|---|---|---|---|
| Expansion of Rental Businesses | -1.1% | Metropolitan centers | Short term (≤ 2 years) |
| Elevated Interest Rates | -0.8% | Nationwide SMEs | Medium term (2-4 years) |
| Limited Remote-Site Charging | -0.5% | Northern and rural sites | Medium term (2-4 years) |
| Shortage of EV-Ready Technicians | -0.3% | Outside major cities | Long term (≥ 4 years) |
| Source: Mordor Intelligence | |||
Rapid Expansion of Equipment Rental Businesses
In the wake of the pandemic, contractors are increasingly turning to rental equipment, seeking greater financial flexibility. In response, leading rental firms are pouring investments into fleet upgrades, allowing job-site managers to utilize cutting-edge machinery without the burdens of ownership. This evolving landscape is nudging manufacturers to recalibrate their sales tactics, with many introducing structured buy-back programs to sustain volume and navigate the shifting tides of Canada's construction equipment market.
Limited Charging Infrastructure on Remote Jobsites
Canada is striving to electrify its heavy machinery, but it's hitting roadblocks due to infrastructure challenges. Building a national charging capacity demands hefty investments. In the country's remote mining regions, the absence of high-voltage power access inflates costs for temporary energy solutions. This economic strain renders electric excavators and loaders less appealing. Consequently, despite a nationwide push towards electrification, diesel-powered equipment remains the prevalent choice in these remote areas.
*Our forecasts treat driver/restraint impacts as directional, not additive. The impact forecasts reflect baseline growth, mix effects, and variable interactions.
Segment Analysis
By Machinery Type: Excavators Anchor Infrastructure Momentum
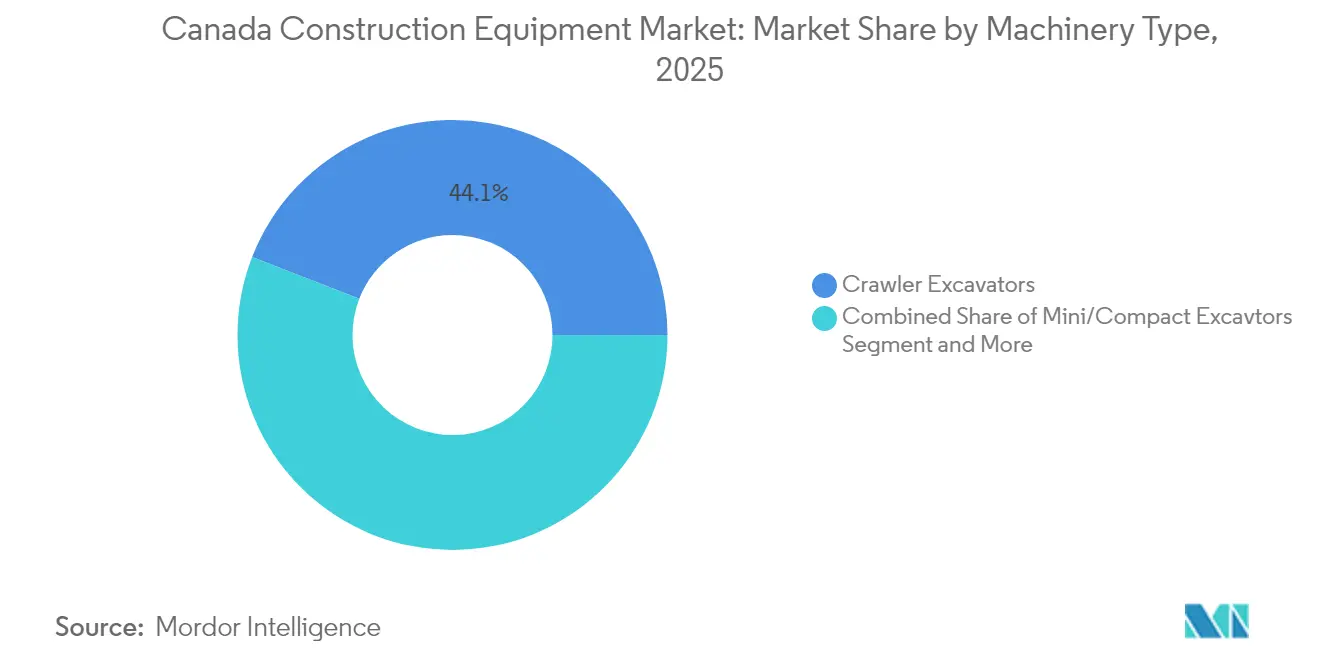
Crawler excavators generated 44.10% of 2025 revenue, solidifying their status as the workhorse category in the Canadian construction equipment market. Large crawler units populate critical minerals and LNG sites, whereas mini excavators flourish in inner-city densification works. AI-enabled prototypes under validation at the University of British Columbia promise cycle-time gains and predictive maintenance that may ease operator shortages. Attachments continue diversifying, letting contractors switch from trenching to grading within minutes and lift utilization rates year-round.
Mini/compact excavators post the strongest 6.62% CAGR as Toronto, Vancouver, and Montreal infill programs favor agile, low-noise units. Loaders and backhoes benefit from agriculture crossover in prairie provinces, while cranes retain relevance in high-rise condo booms. Motor graders see steady demand from provincial highway upgrades, and compaction equipment advances on new density-verification standards. The machinery mix, therefore, balances mass-earth fleets on megaprojects with compact fleets in urban cores, stabilizing shipments for the Canadian construction equipment market.



By Propulsion: Electric Gains Traction Amid Diesel Stronghold
Internal-combustion equipment still accounted for 95.05% of 2025 shipments in the Canadian construction equipment market. Diesel’s torque and fueling convenience remain essential for round-the-clock mine or roadwork. Yet, electric and hybrid units expand at a 12.85% CAGR, led by backhoes and skid-steer models eligible for stacked incentives. CASE’s 580EV backhoe proves a flagship, logging double-shift duty with 60% operating-cost savings in municipal trials.
Alternative fuels such as HVO and hydrogen are tested on northern sites where grid-tied charging is impractical. Environment and Climate Change Canada’s clean-fuel rule nudges fleets toward low-carbon substitutes, and OEMs develop combustion engines compatible with multiple biofuels. Charging-as-a-service contracts surface in Vancouver and Montreal, bundling portable chargers with equipment rental, an emerging service wrapper inside the Canadian construction equipment market.
By End-User Industry: Utilities Spur Clean-Energy Builds
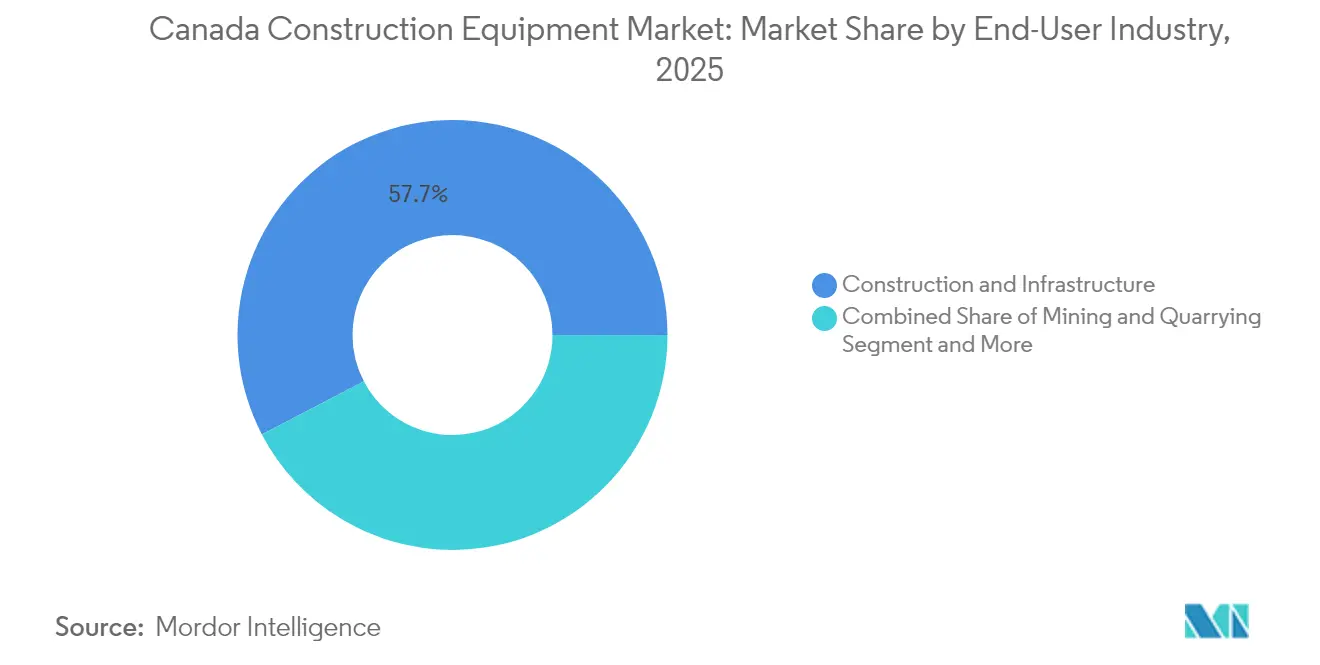
Construction and infrastructure retained 57.65% dominance in 2025, fueled by multi-provincial capital programs. Utilities and energy are the fastest risers at 6.55% CAGR, buoyed by grid-modernization grants and hyperscale data-center power feeds. Renewable installations, from wind repowering in Alberta to solar farms in Saskatchewan, require specialized lifting gear and trenchers. Mining secures consistent crawler excavator demand, while forestry and agriculture balance seasonality by leasing multi-purpose loaders, underpinning resilience in the Canadian construction equipment market.
Diversification across extraction, infrastructure, and tech sectors cushions revenue swings. Regulatory frameworks also differ: utilities must hit decarbonization targets, accelerating electric-equipment adoption, while mining prioritizes high-uptime diesel fleets until charging solutions mature. OEMs thus tailor product roadmaps to end-user energy profiles, keeping the Canadian construction equipment market agile.
By Application: Material Handling Rides Warehouse Automation
Excavation and earth-moving represented 53.95% of 2025 demand in the Canada construction equipment market size. Yet material handling logs a 5.98% CAGR as e-commerce pushes automated fulfillment centers requiring telehandlers and high-reach loaders. Data-center projects further lift demand for precision lifting of prefabricated wall and HVAC modules. Road building maintains share through provincial highway resurfacing, while demolition and recycling rises on urban renewal, feeding crushers and shears into fleet mixes.
Tunneling works for metro extensions in Toronto and Montreal utilize micro-tunnel borers and compact excavators outfitted with guidance systems. Snow removal and landscaping deliver off-season revenues, especially in northern latitudes where municipal budgets secure steady utility for loaders and graders. Applications therefore broaden equipment versatility, a trend OEMs leverage via quick-coupler ecosystems in the Canada construction equipment market.
Geography Analysis
Ontario held 36.30% of 2025 revenue based on the infrastructure agenda and a concentrated population base that sustains continuous housing and transit builds. The province also hosts hyperscale data-center clusters requiring months of mass excavation and megawatt-scale utility trenching. A dense dealer footprint, typified by Toromont Cat’s 710-technician network, minimizes downtime, giving Ontario fleets a service advantage in the Canadian construction equipment market.
British Columbia is forecast to expand at a 5.85% CAGR, propelled by LNG export facilities, critical minerals exploration, and an aggressive CleanBC policy suite that funds low-carbon machinery upgrades. Rugged topography and environmental compliance rules favor high-spec crawler excavators, amphibious carriers, and electric compact loaders for urban cores such as Vancouver. Quebec follows with large highway, hospital, and hydropower investments that diversify equipment orders and accelerate hybrid adoption via generous provincial rebates.
Prairie provinces Saskatchewan and Manitoba blend agricultural demand with potash mining and rural connectivity builds, giving dealers year-round touchpoints. Atlantic Canada’s smaller projects leverage shared rental pools to manage capex. Finally, northern territories create niche needs for Arctic-spec equipment with extended service intervals and heated cabs, cementing the Canadian construction equipment market’s regional complexity.
Regulatory Landscape
Canada construction equipment operating requirements are shaped by federal safety and emissions rules, along with province-specific highway and worksite provisions. Under the Canada Occupational Health and Safety Regulations (SOR/86-304), equipment used on federally regulated worksites is tied to recognized safety practices such as ROPS aligned with CSA Standard B352-M1980, alongside broader guarding and safe-operation expectations. For powertrains, Environment and Climate Change Canada administers off-road engine emissions requirements under CEPA-linked frameworks, including the Off-road Compression-Ignition (Mobile and Stationary) and Large Spark-Ignition Engine Emission Regulations (SOR/2020-258), reinforcing compliance needs for diesel fleets while shaping OEM roadmaps that include lower-emission alternatives.
Provincial frameworks add use-case specific compliance touchpoints that affect equipment specification, transport, and utilization. In Ontario, O. Reg. 398/16 under the Highway Traffic Act defines road-building machines (including graders, bulldozers, and excavators), which influences how contractors manage movement and roadwork deployment. Industry bodies including the Canadian Construction Association (CCA) and Canadian Rental Association (CRA), plus regional groups such as the Western Canada Roadbuilders and Heavy Construction Association and the Crane Rental Association of Ontario, support alignment on safety practices and operating norms that increasingly intersect with electrification, telematics, and jobsite productivity requirements.
Value Chain Analysis
The Canada construction equipment value chain runs from global OEM design and manufacturing through inbound components (engines, hydraulics, electronics, batteries) to Canadian-facing distribution via dealer and rental channels. OEMs and dealers depend on regional parts and logistics hubs to reduce downtime across a geographically large market. In western Canada, for example, Komatsu North America commissioning a full-service parts distribution center in Edmonton is aimed at improving fulfillment speed for dealers and end users. Downstream, dealers provide machine sales, financing, attachments, telematics onboarding, and field service, while parts availability and technician capacity become key differentiators for fleet uptime.
Rental firms are a major route-to-market for compact and mid-size machines in metropolitan centers, with the Canadian Rental Association (CRA) supporting member networks through industry programs that influence procurement and risk management practices. Contractor associations and roadbuilding groups, including the Western Canada Roadbuilders and Heavy Construction Association and the BC Road Builders and Heavy Construction Association, help standardize equipment-rate expectations and operating practices used across projects. This, in turn, affects fleet mix, replacement timing, and total-cost benchmarking. Demand from infrastructure, housing, utilities, and mining end users feeds back into the chain through specification requirements (safety, emissions, and productivity features) and service-level expectations, pushing OEMs and dealers toward faster parts delivery, telematics-enabled maintenance, and stronger field support coverage.
Competitive Landscape
Global heavyweights Caterpillar, Komatsu, Volvo CE, Deere, and CASE dominate through long-standing dealers, but mid-tier OEMs leverage electric and autonomous niches to gain footholds. Caterpillar maintains front-runner status via Toromont Cat’s coast-to-coast parts dispatch, while Komatsu announced direct-ship logistics to Canada to offset tariff headwinds. Volvo CE’s USD 261 million Shippensburg plant upgrade will shorten lead times on midsize crawlers for Canadian orders. Deere enhances competitive stickiness by embedding SmartDetect telematics that lower insurance premiums for fleet owners.
Rental majors such as United Rentals and Sunbelt amass bargaining power, purchasing fleets in bulk and championing total-cost metrics over sticker price, reshaping negotiations in the Canadian construction equipment market. Technology disrupters retrofit autonomy kits to legacy machines, allowing smaller contractors to pilot remote operations without buying new iron. OEMs counter by bundling software subscriptions and battery leasing, turning product sales into lifetime service annuities.
Workforce development emerges as a differentiator; manufacturers sponsor technician apprenticeships to develop EV drivetrain skills. Those able to guarantee fast field support capture share as machines grow more complex. Consequently, competition pivots from horsepower to uptime assurance in the Canadian construction equipment market.
Canada Construction Equipment Industry Leaders
Caterpillar Inc.
Deere & Company
Komatsu Ltd.
AB Volvo (Volvo CE)
Hitachi Construction Machinery
- *Disclaimer: Major Players sorted in no particular order

Market Opportunities and Future Outlook
A clear opportunity is improving Canada-based supply and support capacity for large earthmoving and mining fleets tied to critical minerals and oilsands-linked workloads, where uptime and parts availability directly influence contractor economics. Komatsu North America commissioning a 135,000 square foot full-service parts distribution center in Edmonton (November 2025) highlights how faster regional fulfillment and service logistics can be used to compete on lifecycle value in western Canada, not just purchase price. Similar opportunities also exist in bundled offerings that combine equipment, attachments, telematics, and service response commitments for contractors working across remote regions.
Electrification and low-carbon operation form a second opportunity centered on compact and municipal fleets, where charging logistics are comparatively simpler and incentives are actively pursued, while remote jobsites still face charging constraints. Market evidence of localized capacity expansion also supports a longer-term shift in Canada’s equipment support model. Hitachi Construction Truck Manufacturing in Guelph, Ontario moved toward full-scale production of ultra-large dump trucks for the Americas as of 2026, reinforcing Canada as a manufacturing and service anchor for heavy mining equipment. Across both themes, contractors and rental players increasingly prioritize turnkey availability, which elevates demand for dealer-led financing, battery and charger bundling in urban cores, and continued investment in parts and service networks to reduce downtime in harsh or distant operating environments.
Recent Industry Developments
- April 2026: Komatsu announced global availability of the PC9000-12 Hydraulic Mining Excavator, with first Canada proof delivery completed in May 2025. The expansion broadens Komatsu's footprint in high capital mining projects in Canada and supports demand for ultra-large mining machines in North American markets.
- March 2026: Komatsu invested in continued North American manufacturing and service investments, highlighted by expanding local capabilities. The move reduces lead times and improves service levels for Canadian customers and reinforces local capability to compete with OEMs in the heavy equipment space.
- March 2026: Komatsu opened/expanded a 135,000-square-foot full-service parts distribution center in Edmonton, Alberta. The expansion enhances parts availability and uptime for western Canada and supports rapid response to dealer networks and customers.


Research Methodology Framework and Report Scope
Market Definition and Coverage
For this study, the market covers the value of construction equipment sold and rented for use across Canadian construction activity. Demand is tied to contractor fleet replacement cycles and new project starts, and the results are sized in USD for consistency.
Scope exclusions: We exclude used equipment resale between end users and most non-construction off-highway uses (for example, dedicated agriculture or mining equipment), unless the equipment is purchased for construction work.
Segmentation Overview
- By Machinery Type
- Crawler Excavators
- Mini/Compact Excavators
- Loaders and Backhoes
- Cranes
- Telescopic Handlers
- Motor Graders
- Compaction Equipment
- Others
- By Propulsion
- Internal Combustion Engine (Diesel/Biodiesel)
- Electric and Hybrid
- Alternative Fuels (HVO, Hydrogen)
- By End-user Industry
- Construction and Infrastructure
- Mining and Quarrying
- Oil and Gas
- Forestry and Agriculture
- Utilities and Energy
- Others
- By Application
- Excavation and Earth-moving
- Lifting and Material Handling
- Road Building and Paving
- Demolition and Recycling
- Tunneling and Underground
- Landscaping and Snow Removal
- Excavation and Earth-moving
- By Province
- Ontario
- Quebec
- British Columbia
- Alberta
- Saskatchewan & Manitoba
- Atlantic Canada
- Northern Territories
Data Sources, Market Sizing, and Validation
Desk Research
Desk work was used to set hard anchors for the model before assumptions were added, because equipment demand tracks construction activity and fleet cycles closely. We relied on public series and official publications such as Statistics Canada tables on construction output and building permits, Canada Mortgage and Housing Corporation housing starts, and federal infrastructure plans and budget documents.
To keep the equipment boundary realistic, we also reviewed sources such as Association of Equipment Manufacturers releases, Innovation, Science and Economic Development Canada manufacturing statistics, and peer-reviewed or standards references on emissions and electrification where relevant. On top of this, we checked company filings, investor presentations, dealer communications, and reputable press for product mix shifts and pricing direction. A paid subscription database for company financials and intelligence, a patent database, and an import and export shipment level database were used selectively to cross-check revenue scale, technology direction, and trade intensity. These examples are not exhaustive, and many other sources were also referred to for data collection, validation, and research clarification.
Primary Interviews and Surveys
Primary work focused on mapping activity signals into equipment demand and price behavior, since public data rarely shows the split between new sales, rental placements, and replacement cycles. We spoke with a mix of OEM and distributor participants, rental operators, contractors, and service stakeholders across major provinces. We used these inputs to confirm utilization patterns, typical replacement timing, and how quotes are being indexed to component costs and financing conditions.
Distribution of primary research fieldwork respondents
| Company type | Respondent position |
|---|---|
| Top tier: 37% | CXOs: 12% |
| Mid tier: 45% | Functional/Unit leaders: 40% |
| Smaller Players: 18% | Managers: 48% |
Market-Sizing & Forecasting
Sizing started with a top-down build where national construction and infrastructure activity signals were converted into an equipment demand pool, then filtered by equipment intensity for key job types. In parallel, we corroborated totals with selective bottom-up checks such as sampled unit volumes by equipment class, dealer channel checks, and an average selling price (ASP) times volume sanity check, and then adjusted where the two views did not align.
Inputs that mattered most included housing starts and permitting momentum, civil infrastructure award pipelines, rental penetration and utilization trends, and fleet replacement timing shaped by emissions requirements and reliability expectations. Pricing was treated as a driver of value, since ASPs move with steel and other component costs, equipment availability, and financing rates, and these effects vary by equipment class. Where direct volume hints were limited, gaps were handled through proxy ratios (for example, typical equipment per project value by application) and then validated with interview feedback.
For forecasting, scenario analysis was used because project pipelines and financing conditions can shift quickly, and the interview set helped us weight base, softer, and stronger cases. The final forecast blended expected construction activity, replacement cycles, and realistic ASP progression so the result remains explainable and repeatable using standard data series.
Data Validation & Update Cycle
Outputs were checked against independent signals such as visible project backlogs, trade movements for major equipment categories, and the direction of rental fleet additions discussed in the market. When outliers appeared, the assumptions behind utilization, replacement, and ASP were reviewed, and then a second analyst pass was completed before sign-off.
Reports are refreshed annually, and interim updates are made when there are material events that can change demand or pricing, such as large federal funding releases, major rate changes, or supply disruptions. Before delivery, we do a final review pass and, if needed, re-contact sources to confirm that the latest market conditions are reflected.
Mordor Intelligence's Canada Construction Equipment Market Size Versus Other Published Estimates
It is normal to see different market values for construction equipment in Canada because groups set boundaries differently and they also pick different timing and pricing rules. Gaps usually come from whether rental is treated like a full market value add or only as equipment placements, and from how quickly pricing is assumed to rise in a high inflation period.
A refresh-led difference is also common, since currency conversion timing and quarterly price moves can shift the USD total even when unit demand is steady. By rechecking ASP steps using dealer quote direction and cross-validating unit and value outputs each update cycle, the resulting 2025 figure stays anchored to current pricing conditions, a modeling choice applied by Mordor Intelligence.
Benchmark comparison
| Source | Market Size | Gaps in Research Methodology |
|---|---|---|
| Mordor Intelligence | USD 2.92 B (2025) | |
| Industry Bulletin A | USD 3.20 B (2025) | This estimate appears to apply a faster price uplift across equipment classes and may count a broader rental revenue layer, which can inflate value even if unit demand is similar. |
| Trade Journal B | USD 2.60 B (2025) | This figure looks closer to a new equipment shipment value view, which can understate the market if rental fleet additions, attachments, and higher-spec models are not fully reflected in the ASP mix. |
The spread in the table largely comes down to timing and what gets counted as market value, rather than a disagreement that equipment demand exists. When the scope is kept to construction use and the pricing logic is refreshed using repeatable checks, the market total becomes easier to trace back to clear drivers and to update consistently as conditions change.


Key Questions Answered in the Report
How big is the Canada construction equipment market in 2026?
The market is valued at USD 3.09 billion in 2026 and is projected to grow to USD 4.1 billion by 2031.
What is driving demand for compact excavators in Canadian cities?
Urban densification policies in Toronto, Vancouver and Montreal create tight-site conditions that favor agile, low-emission compact excavators.
Which propulsion type is growing fastest in Canadian construction fleets?
Electric and hybrid equipment is expanding at a 12.85% CAGR due to federal and provincial purchase incentives.
Why are equipment rentals rising across Canada?
Contractors prefer rental to manage cash flow during high interest-rate periods and to access new technology without ownership risk.
What are key challenges to electrifying heavy equipment in Canada?
Limited remote-site charging infrastructure and a shortage of technicians trained on EV drivetrains slow widespread adoption.
Page last updated on:


 Your data is secure and never sold or shared.


