
Market Overview
| Study Period | 2020 - 2031 |
|---|---|
| Forecast Data Period | 2026 - 2031 |
| Base Year Market Size (2025) | USD 3.45 Billion |
| Market Size (2026) | USD 3.61 Billion |
| Market Size (2031) | USD 4.5 Billion |
| Growth Rate (2026 - 2031) | 4.52 % |
| Market Concentration | Medium |
Major Players *Disclaimer: Major Players sorted in no particular order Image © Mordor Intelligence. Reuse requires attribution under CC BY 4.0. | |
Australia Construction Machinery Market Analysis by Mordor Intelligence
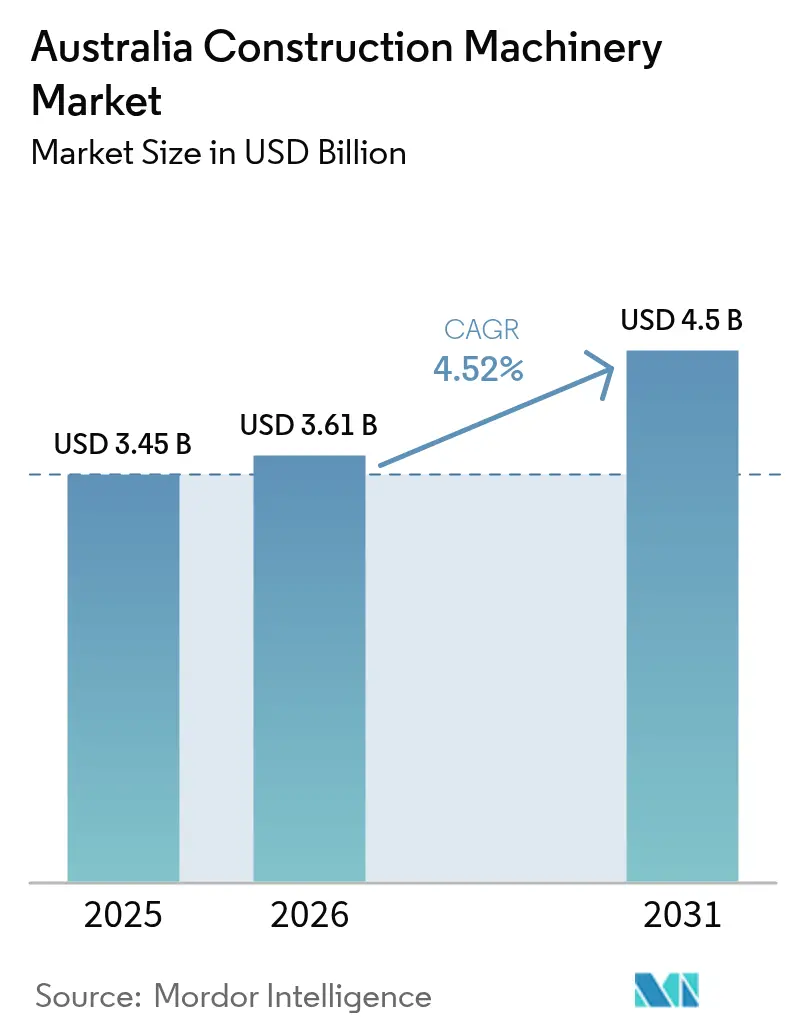
The Australian Construction Machinery Market size was valued at USD 3.45 billion in 2025 and estimated to grow from USD 3.61 billion in 2026 to reach USD 4.5 billion by 2031, at a CAGR of 4.52% during the forecast period (2026-2031). Vigorous mining activity and a multi-billion-dollar public infrastructure pipeline underpin the growth trajectory, while digitalization, autonomous technology, and low-emission equipment accelerate replacement demand. Persistent labor shortages heighten interest in automation and rental models, and a smoother supply of critical components stabilizes delivery schedules. Meanwhile, emissions compliance and evolving safety rules spur rapid upgrades, encouraging original equipment manufacturers (OEMs) to localize service and assembly. Competitive intensity remains moderate because global leaders differentiate through technology partnerships, telematics offerings, and robust parts support rather than aggressive price cuts.
Key Report Takeaways
- By application, Material Handling led with 47.20% of the Australian construction machinery market share in 2025, while Mining Support is forecast to post the fastest 4.62% CAGRduring the forecast period (2026-2031).
- By machinery type, Crawler Dozers held 42.30% share of the Australian construction machinery market size in 2025, and Hydraulic Excavators are expected to advance at a 4.66% CAGR during the forecast period (2026-2031).
- By propulsion, Diesel dominated with an 80.60% share in 2025, whereas Battery-Electric units are projected to expand at a 4.69% CAGR during the forecast period (2026-2031).
- By end-user industry, Construction and infrastructure accounted for 57.10% in 2025, yet Mining and quarrying exhibit the highest 4.72% CAGR forecast during the forecast period (2026-2031).
Note: Market size and forecast figures in this report are generated using Mordor Intelligence’s proprietary estimation framework, updated with the latest available data and insights as of 2026.
Australia Construction Machinery Market Trends and Insights
Drivers Impact Analysis*
| Driver | (~) % Impact on CAGR Forecast | Geographic Relevance | Impact Timeline |
|---|---|---|---|
| Government Infrastructure Pipeline | +1.2% | National, with concentration in NSW, Tasmania, WA | Long term (≥ 4 years) |
| Mining Super-Cycle Revival | +1.0% | Western Australia, Queensland, Northern Territory | Medium term (2-4 years) |
| Growth Of Rental And Leasing Platforms | +0.8% | National, urban centers leading adoption | Short term (≤ 2 years) |
| Push For Low-Emission Machinery | +0.6% | National, accelerated in major cities | Medium term (2-4 years) |
| Autonomous-Ready Equipment To Solve Labour Shortages | +0.5% | Remote regions, mining corridors | Long term (≥ 4 years) |
| Modular And Prefab Construction Lifting Needs | +0.4% | National, residential and commercial sectors | Medium term (2-4 years) |
| Source: Mordor Intelligence | |||


Government Infrastructure Pipeline 2025-2030
A planned Tasmania works program, Snowy 2.0 hydro expansion, and HMAS Stirling naval upgrade provide multi-year visibility for earthmoving, cranes, and material handling fleets. Tier-one contractors reserve equipment capacity well ahead of ground-breaking, smoothing quarterly order flow for OEMs. Project staging across states mitigates regional downturn risk and spreads parts demand, while public procurement clauses mandating lower emissions accelerate fleet renewal. Rental leaders ramp up inventory to capture short-term peaks, and telematics data from long-cycle projects improves predictive maintenance accuracy, reducing unscheduled stoppages on remote sites[1]“Infrastructure Investment Program,” Australian Government Department of Infrastructure, infrastructure.gov.au.
Mining Super-Cycle Revival (Iron-Ore, Lithium)
Western Australia is strengthening its position as a global mining hub by increasing iron ore production and expanding lithium operations to support the battery supply chain. Investments in advanced technologies, such as BHP’s Western Ridge project and Roy Hill’s haul truck automation, highlight the region’s focus on tech-driven mining. Despite anticipated declines in iron ore prices, operators are upgrading equipment to ensure safety and performance, reflecting confidence in the resource sector. Based on offtake agreements with battery makers, lithium greenfields adopt battery-electric excavators earlier to meet environmental, social, and governance goals. OEMs bundle autonomy software, tele-ops cabins, and lifecycle service contracts, lifting average selling prices[2]“Western Ridge Project Overview,” BHP, bhp.com.
Growth of Rental & Leasing Platforms
Smaller builders and subcontractors substitute capital purchases with pay-per-use rentals, raising fleet utilization for national lessors. Digital marketplaces with 4G-enabled asset tracking platforms match idle equipment to nearby projects within hours. Telematics penetration has surpassed two-fifth of domestic rental fleets, trimming unexpected downtime by one-fourth and lowering service response costs. OEMs expand certified used programs and back-to-back leasing to retain residual value and market share. Banks shift toward operating-lease structures, lowering upfront barriers for contractors pursuing new tenders[3]“Rental Market Insights 2025,” Coates, coates.com.au.
Push for Low-Emission / Electric Machinery
Euro VI Stage C rules, effective November 2024, incentivize battery-electric cranes, loaders, and mini-excavators on metropolitan jobsites. Cities restrict diesel idling near hospitals and schools, raising demand for zero-noise, zero-tailpipe options that shorten municipal approval cycles. Renewable energy now supplies more than two-thirds of power at several remote mines, enabling on-site charging. XCMG’s XLC220-E crawler crane entry and Fortescue’s target of 100% zero-emission haulage by 2030 showcase commercial readiness. Component suppliers localize battery assembly to meet shipping-hazard regulations, compressing lead times.
Restraints Impact Analysis*
| Restraint | (~) % Impact on CAGR Forecast | Geographic Relevance | Impact Timeline |
|---|---|---|---|
| Cyclical Commodity And Construction Spending Swings | -0.8% | National, mining regions most exposed | Short term (≤ 2 years) |
| Stringent Emission And Safety Compliance Costs | -0.6% | National, urban areas with stricter enforcement | Medium term (2-4 years) |
| Skilled-Operator Shortages | -0.5% | Remote mining and construction regions, Northern Australia | Long term (≥ 4 years) |
| Component Supply-Chain Bottlenecks | -0.4% | National, with higher impact on specialized equipment | Medium term (2-4 years) |
| Source: Mordor Intelligence | |||
Cyclical Commodity & Construction Spending Swings
Falling iron ore and coal prices tighten mining capital budgets and delay equipment expansion, especially among mid-tier operators. High interest rates restrain commercial real-estate launches, dampening crane and earthmoving orders in city cores. Pipeline certainty offsets headline volatility, yet procurement committees stagger deliveries to conserve cash flow. Rental utilization dips in line with housing approvals, prompting fleet redeployment across states. Nonetheless, mandatory maintenance and safety overhauls sustain a demand for parts at a base level.
Stringent Emission & Safety Compliance Costs
Euro VI exhaust after-treatment systems add up to one-fifth to new-machine purchase prices, while Australian Design Rule upgrades impose extensive certification. Smaller contractors delay purchases or opt for used Tier IV Interim imports, slowing headline unit growth. OEMs mitigate sticker shock via extended warranties and telematics-driven fuel burn guarantees that lower the total cost of ownership over time. Training and documentation overhead increase for dealers and deepen service revenue streams. Compliance complexity accelerates market consolidation because only well-capitalized distributors can stock diversified inventories.
*Our forecasts treat driver/restraint impacts as directional, not additive. The impact forecasts reflect baseline growth, mix effects, and variable interactions.
Segment Analysis
By Application: Material Handling Dominates Infrastructure Surge
Material Handling captured 47.20% of the Australian construction machinery market share in 2025, as mega-projects demand continuous bulk movement. Mining Support is projected to outpace all other applications at a 4.62% CAGR, reflecting autonomous haulage growth and lithium mine expansions. Earthmoving maintains relevance with steady orders for road base and tunnel spoil removal. Transportation / Haulage benefits from intermodal terminal construction, while Demolition & Recycling gains momentum through strict waste-reduction targets.
Material Handling’s prominence stems from port upgrades, logistics warehouses, and modular building yards that rely on cranes, forklifts, and conveyors. Australia's construction machinery market size for Mining Support is forecast to climb alongside BHP’s Western Ridge and Roy Hill’s ongoing fleet renewals. Digital twin models allow contractors to optimize cycle times, lowering fuel cost per ton moved. Rental houses expand high-capacity telehandler fleets to serve prefab builders. Meanwhile, real-time payload monitoring reduces overloading incidents, cutting maintenance costs and emissions.



By Machinery Type: Excavators Surge While Dozers Retain Scale
Crawler Dozers controlled 42.30% of Australia's construction machinery market size 2025, leveraged by bulk earthmoving on rail, road, and mine sites. Hydraulic Excavators are forecast to record a 4.66% CAGR through 2031, propelled by versatility and autonomous retrofit kits. Wheel Loaders and Articulated Dump Trucks fill load-and-haul gaps, whereas Tower and mobile Cranes remain indispensable for bridges and high-rise cores.
Australia's construction machinery market benefits as excavators integrate grade control and 3D machine guidance, cutting rework by half. Contractors favor 20-35 ton classes that can swap between buckets, hammers, and couplers in minutes. Dozers retain importance on remote mine haul roads where traction and blade capacity trump agility. Telematics software now pushes fuel burn and idle alerts to site supervisors, driving operational discipline. Despite automation advances, XCMG’s GR3505 grader launch underlines continuing demand for precision finishing.
By Propulsion Type: Electric Transition Accelerates
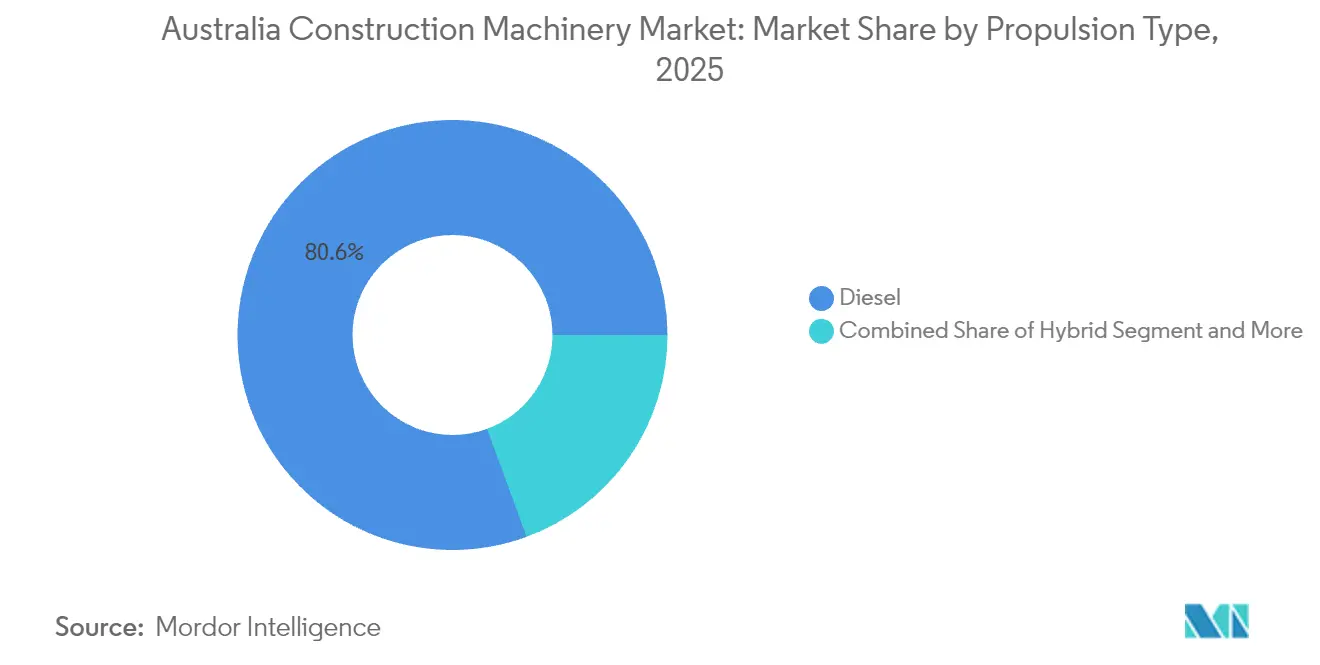
Diesel engines held an 80.60% share in 2025, yet Battery-Electric units are on track for a 4.69% CAGR to 2031. Hybrid models bridge range anxiety and emissions compliance, while fuel-cell pilots explore zero-emission haulage in underground mines. Rapid charger installations at contractor yards shorten turnaround to under 90 minutes for sub-20-ton machines.
Australia's construction machinery market experiences early adoption where strict noise ordinances apply, particularly in Melbourne’s hospital precincts. Lower maintenance—fewer filters, fluids, and moving parts—offsets higher capital cost within four years of duty cycle. Utilities replace diesel-hydrant excavators to avoid fuel contamination on potable-water jobs. Government green-procurement criteria weigh total life-cycle carbon, giving electric bids scoring premiums in tender evaluations.
By End-User Industry: Mining Growth Outpaces Construction
Construction & Infrastructure remained dominant at 57.10% in 2025, shaped by state transport upgrades and renewable energy corridors. Mining & Quarrying is forecast for a 4.72% CAGR, the fastest among end-users, as iron-ore producers overhaul fleets and lithium projects break ground. Utilities & Oil & Gas sustain moderate growth through pipeline and substation works, whereas Agriculture & Forestry gradually mechanizes to offset rural labor scarcity.
The Australian construction machinery industry also sees service dealers expanding remote diagnostics for mine clients, achieving first-time-fix rates above four-fifths. Modular bridges cut onsite labor by two-fifths in civil works but demand heavier lifting gear. Renewable-energy developers deploy all-terrain cranes for wind-tower segments, expanding seasonal demand in coastal regions. Agricultural contractors invest in compact loaders with forestry-spec guarding to meet fire-break mandates.
Geography Analysis
Western Australia, with its vast iron ore and lithium operations, leads the nation in mining equipment demand, deploying hundreds of autonomous trucks across its expansive fleets. Following closely is Queensland, bolstered by active copper developments and significant road infrastructure upgrades, especially along the Bruce Highway. Meanwhile, New South Wales and Victoria are channeling efforts into substantial infrastructure investments, encompassing major rail tunnel projects and expansions of healthcare facilities. Despite its smaller population, Tasmania is witnessing a surge in growth, driven by a strong project pipeline, resulting in heightened demand for specialized machinery such as barge-mounted cranes and short-haul dumpers.
Northern Territory defense works and gas processing plants elevate demand for high-mobility dozers and blast-resistant loaders. South Australia benefits from renewable-energy grid connections requiring specialized cable-laying excavators. The Australian Capital Territory maintains stable government facilities upgrades, ensuring a baseline of compact machinery orders. Remote operations rely on satellite-linked telematics to diagnose faults, shortening technician dispatch times despite vast distances.
Across regions, labor scarcity intensifies reliance on semi-autonomous solutions. OEMs collaborate with tertiary institutes in Perth and Brisbane to train operators on simulation rigs, narrowing skills gaps. State incentives, such as Western Australia’s zero-emission equipment rebate, accelerate electric adoption in urban refurbishment projects. Regional freight costs remain the primary barrier to rapid fleet turnover, though localized parts hubs alleviate downtime risk.
Regulatory Landscape
Australia regulates construction machinery primarily through state and territory Work Health and Safety (WHS) Acts and Regulations, supported by Safe Work Australia model WHS regulations and state codes of practice covering mobile plant and plant risk management (for example, plant-focused guidance used by SafeWork NSW and WorkSafe Queensland). Contractors working on federally funded projects can also be influenced by the Building and Construction Work Health and Safety Accreditation Scheme, which requires systems-based controls for high-risk activities and mobile plant.
On technical compliance, Standards Australia committee ME-063 is aligning domestic earthmoving requirements more closely with ISO standards, and AS 20474.1:2025 sets current safety requirements for earth-moving machinery (adopting and modifying ISO 20474-1:2017). For cross-border equipment supply, imported machinery is administered under the Customs Tariff Act 1995 framework, where a typical 5% duty applies to many machinery lines. Tariff Concession Orders can provide relief when no Australian-made equivalent exists, shaping landed-cost decisions for OEMs, dealers, and large fleet buyers.
Value Chain Analysis
Australia's construction machinery value chain is heavily import-led, with global OEM manufacturing feeding into Australian dealer networks and independent distributors that provide sales, parts, and field service coverage across major cities and remote mining corridors. Major OEMs such as Caterpillar, Komatsu, Hitachi, Volvo, and Kobelco operate through established dealer ecosystems, while specialists and independents (for example, CJD Equipment and Brisvegas Machinery) support narrower product niches and regional fleets. Industry bodies such as the Construction & Mining Equipment Industry Group (CMEIG) and the Crane Industry Council of Australia (CICA) influence standards interpretation, safety practice adoption, and operator competency expectations across the chain.
Downstream value creation is increasingly concentrated in lifecycle services, including finance and operating-lease structures, rental fleet management, telematics, planned maintenance, and component rebuild or remanufacture. Recent supply-chain friction, particularly for specialized components, has been managed through higher local inventory buffers, diversified sourcing, and tighter dealer-to-site digital workflows that speed diagnostics and parts ordering, which is especially important for uptime-sensitive mining and major infrastructure projects spread across long distances.
Competitive Landscape
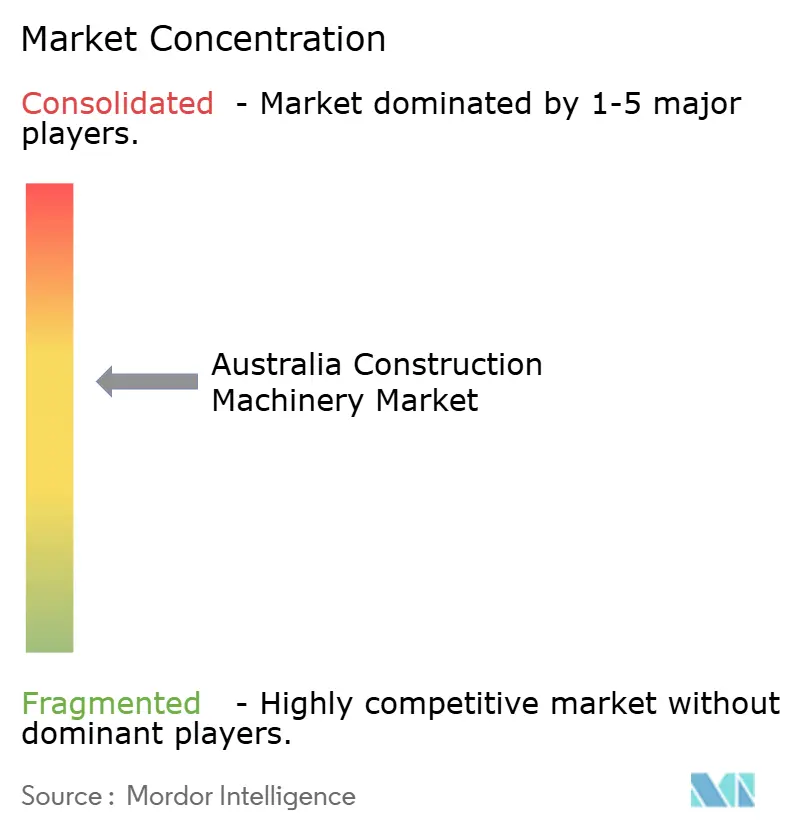
Global OEMs Caterpillar, Komatsu, and JCB maintain brand advantage through nationwide dealer networks and integrated parts portals. The top five players with Hitachi and Volvo CE command around three-fifth of the unit sales value, indicating moderate concentration. Localized assembly by XCMG and Zoomlion, inaugurated in Melbourne during 2024, injects cost-competitive models, intensifying price scrutiny on mid-range classes.
Technology partnerships shape competitive differentiation. Epiroc collaborates with Fortescue on autonomous drilling, while WesTrac’s VisionLink service integrates mixed-fleet data onto a unified dashboard. OEMs bundle finance, telemetry, and extended service plans that guarantee uptime percentages, appealing to risk-averse contractors. Rental majors leverage bulk purchasing to secure factory priority and pass some discounts through short-term hire rates, pressuring smaller distributors.
Regulatory stress tests on emissions and safety favor early adopters with compliant line-ups. Chinese entrants fast-track Euro VI certifications, while Japanese OEMs promote hydrogen-ready prototypes. Dealer consolidation continues, exemplified by the 2025 merger of two regional Komatsu branches into a single superstore to optimize workshop capacity. Digital customer portals now allow online quote generation and parts ordering outside office hours, capturing a new generation of procurement managers[4]“Annual Report 2024,” Caterpillar, caterpillar.com .
Australia Construction Machinery Industry Leaders
Hitachi Construction Machinery Co Ltd
XCMG Group
Komatsu Ltd
Caterpillar Inc.
John Deere & Co.
- *Disclaimer: Major Players sorted in no particular order

Market Opportunities and Future Outlook
The public infrastructure pipeline and formal priority lists create identifiable demand clusters across transport, utilities, and enabling works. Infrastructure Australia's Major Public Infrastructure Pipeline for 2024-25 to 2028-29 is valued at AUD 242 billion, with transport comprising AUD 129 billion. The 2026-27 Federal Budget includes AUD 13.5 billion for state infrastructure projects plus a new AUD 2 billion Local Infrastructure Fund for housing-enabling works (roads, water, power connections). This mix supports whitespace for high-utilization rental fleets (earthmoving, telehandlers, compact machinery) and for dealers building rapid-turn parts logistics and field-service coverage around multi-site programs.
Mining decarbonization and automation programs are translating into procurement and retrofit activity, creating opportunity for autonomy kits, energy infrastructure at sites, and OEM-led service contracts. In Western Australia, BHP and Rio Tinto launched a June 2026 trial of two battery-electric haul trucks at the Jimblebar iron ore mine, and EACON Mining Technology reported July 2026 day-shift autonomous operations using six retrofitted Komatsu HD1500 trucks at a Western Australian gold mine. These programs tend to favor suppliers that can integrate safety-compliant automation workflows, telematics, and maintenance planning across mixed fleets, alongside electrification-adjacent offerings such as charging readiness assessments and power-management integration for contractor yards and remote operations.
Recent Industry Developments
- July 2026: EACON Mining Technology commenced day-shift autonomous operations using six retrofitted Komatsu HD1500 trucks at a Western Australian gold mine. The move highlights demand for retrofit autonomy pathways that extend the productive life of in-service haul fleets while reducing operator constraints on remote sites.
- April 2026: Komatsu Australia commissioned its 1,000th autonomous ultra-class haul truck worldwide equipped with the FrontRunner Autonomous Haulage System. The milestone reinforces the installed base of autonomous haulage capability in Australia-linked deployments, supporting ongoing requirements for software, support services, and site integration.
- October 2024: Zoomlion debuted in the Australian earthmoving equipment market and inaugurated its headquarters in Melbourne. Establishing an on-the-ground base improves sales and aftersales responsiveness for fleet buyers and increases competitive pressure in mid-range equipment categories where service coverage and parts availability drive purchasing decisions.


Research Methodology Framework and Report Scope
Market Definition and Coverage
This market covers the demand and supply of construction machinery in Australia, measured in revenue terms for equipment used across earthmoving, material handling, and jobsite transportation activities.
Scope exclusions: We exclude hand tools and general construction materials, and we also exclude pure rental service revenue that is not tied to machinery sales values.
Segmentation Overview
- By Application
- Material Handling
- Earthmoving
- Transportation / Haulage
- Mining Support
- Demolition & Recycling
- By Machinery Type
- Hydraulic Excavators
- Wheel Loaders
- Crawler Dozers
- Articulated Dump Trucks
- Motor Graders
- Skid-steer & Compact Track Loaders
- Tower & Mobile Cranes
- By Propulsion Type
- Diesel
- Hybrid
- Fully Electric
- Hydrogen Fuel-cell (pilot)
- By End-User Industry
- Construction & Infrastructure
- Mining & Quarrying
- Agriculture & Forestry
- Utilities & Oil-&-Gas
Data Sources, Market Sizing, and Validation
Desk Research
Desk work starts with building a clean fact base on Australia construction activity and machinery demand signals. We rely on public sources such as the Australian Bureau of Statistics for construction output and investment, Infrastructure Australia pipeline publications for project activity, and Austrade style trade releases for direction on capital goods flows. Import and export direction is further checked using official customs and tariff statistics, which helps us understand inbound machine mixes and pricing pressure.
To keep the model grounded, we also review company annual reports, investor presentations, and credible press coverage on fleet replacement cycles, dealer networks, and lead times. Patent databases are used in a limited way to track where electrification and automation claims are rising (which helps with technology adoption assumptions). In addition, a paid subscription for shipment-level import and export records is used selectively to validate category movement by machine type. These are representative sources only, and the list is not exhaustive since many other public datasets and documents were also referred to for data collection, validation, and research clarification.
Primary Interviews and Surveys
Primary work is used to sanity check the desk indicators and convert them into workable market inputs. We speak with OEM and dealer-side teams, rental and fleet operators, and large contractors to confirm typical order sizes, price movement, and how demand differs by project type across Australia.
The discussions also help us test assumptions on replacement timing, attachment pull-through, and the direction of new propulsion types, and then we re-check any big variances with follow-up calls.
Distribution of primary research fieldwork respondents
| Company type | Respondent position |
|---|---|
| Top tier: 25% | CXOs: 18% |
| Mid tier: 55% | Functional/Unit leaders: 25% |
| Smaller Players: 20% | Managers: 57% |
Market-Sizing & Forecasting
The core build uses a top-down and bottom-up structure where national construction and mining equipment demand pools are reconstructed from machinery penetration rates, replacement cycles, and average selling price direction for major equipment classes, and then the totals are split into the covered machinery groupings. Once that view is ready, it is corroborated with selective bottom-up checks like sampled dealer sell-through, import category direction, and a simple ASP times volume logic for a few high-weight machines, and the totals are adjusted if the gap stays material.
Inputs that matter in Australia include civil and infrastructure project starts, mining capex and sustaining spend, equipment utilization and fleet age signals, import mix shifts by machine type, and emissions or electrification adoption timing where it is visible in procurement. Forecasts are built using scenario analysis anchored to construction pipeline timing and macro indicators, and then tuned using primary feedback on lead times, discounting, and tender sentiment. Where bottom-up pieces are missing for smaller categories, we apply ratio-based splits tied to the closest observable machine class and validate the split shares through interviews.
Data Validation & Update Cycle
Validation is done in layers so the totals do not rely on one dataset. Analysts compare the modeled market output against independent signals such as construction output trends, import direction for heavy equipment categories, and reported commentary on dealer backlogs, and then any large swings are reviewed line by line.
If a variance cannot be explained by a known trigger like policy changes, major project reprioritization, or supply constraints, we revisit assumptions and re-contact sources to confirm what changed. Each report is refreshed on an annual cycle, and interim updates are done when a material event shifts demand, pricing, or availability. Before delivery, a final analyst pass is completed so clients receive the latest updated view.
Mordor Intelligence's Australia Construction Machinery Market Size Measured Against Other Published Estimates
Different publishers often show different market values for this market because they do not always count the same equipment set, and they may also anchor their pricing and timing assumptions to different years. Currency conversion timing, the treatment of rental activity, and how imports are mapped into equipment classes can all move the final number.
Some published figures appear to combine adjacent heavy equipment uses and broader industrial machinery, which pushes the total upward, and they may also apply a uniform growth rate without re-checking utilization and replacement behavior. For Mordor Intelligence, the total is built from defined construction machine classes tied back to Australia construction and mining demand indicators, and broad industrial equipment categories and non-equipment service-only revenue are excluded.
Benchmark comparison
| Source | Market Size | Gaps in Research Methodology |
|---|---|---|
| Mordor Intelligence | USD 3.45 B (2025) | |
| Global Consultancy A | USD 8.20 B (2024) | Uses a broader construction machinery definition that can pull in adjacent heavy equipment categories, and it is anchored to a different base year with limited visibility on how rental and service elements are treated in the published summary. |
| Industry Publisher B | USD 2.79 B (2023) | Anchored to an earlier base year and a narrower demand view that can undercount price progression and equipment mix change, and the public summary provides fewer checks on import mix and replacement-cycle assumptions. |
The spread across figures mainly comes from scope width and the base-year choice, followed by how pricing and replacement cycles are updated. Our steps keep each input traceable to observable construction and mining signals, which makes the final number easier to re-check as conditions change.


Key Questions Answered in the Report
What is the current value of the Australian construction machinery market?
It stands at USD 3.61 billion in 2026 and is projected to reach USD 4.5 billion by 2031.
Which machinery type is growing fastest in Australia?
Hydraulic Excavators are forecast to post a 4.66% CAGR during the forecast period (2026-2031) due to versatility and autonomy upgrades.
How big is the opportunity for battery-electric construction equipment in Australia?
Battery-electric machines are expected to grow at a 4.69% CAGR during the forecast period (2026-2031), as Euro VI standards take effect.
Which end-user sector will drive future equipment demand?
Mining & Quarrying shows the highest growth, at a 4.72% CAGR during the forecast period (2026-2031), fueled by lithium and iron ore projects.
Why are rental and leasing models expanding?
Contractors seek capital flexibility and leverage telematics-enabled platforms that raise fleet utilization and cut downtime.
Page last updated on:




