Bulletproof Vest Market Size and Share
Market Overview
| Study Period | 2020 - 2031 |
|---|---|
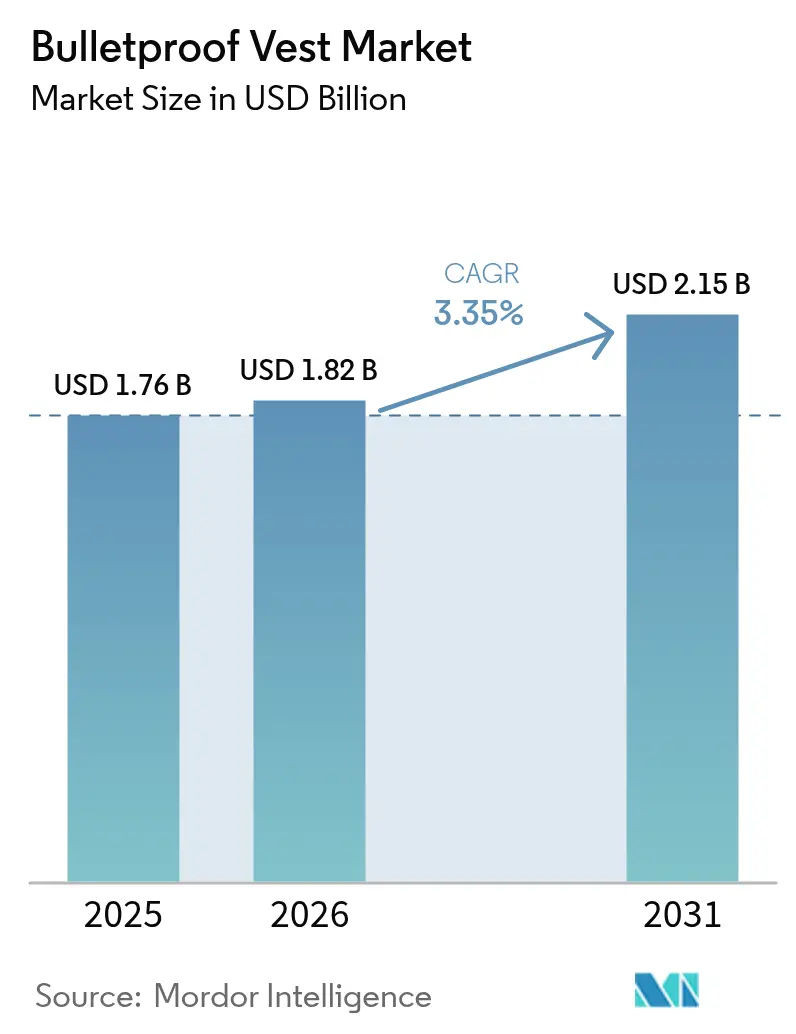
| Market Size (2026) | USD 1.82 Billion |
| Market Size (2031) | USD 2.15 Billion |
| Growth Rate (2026 - 2031) | 3.35% CAGR |
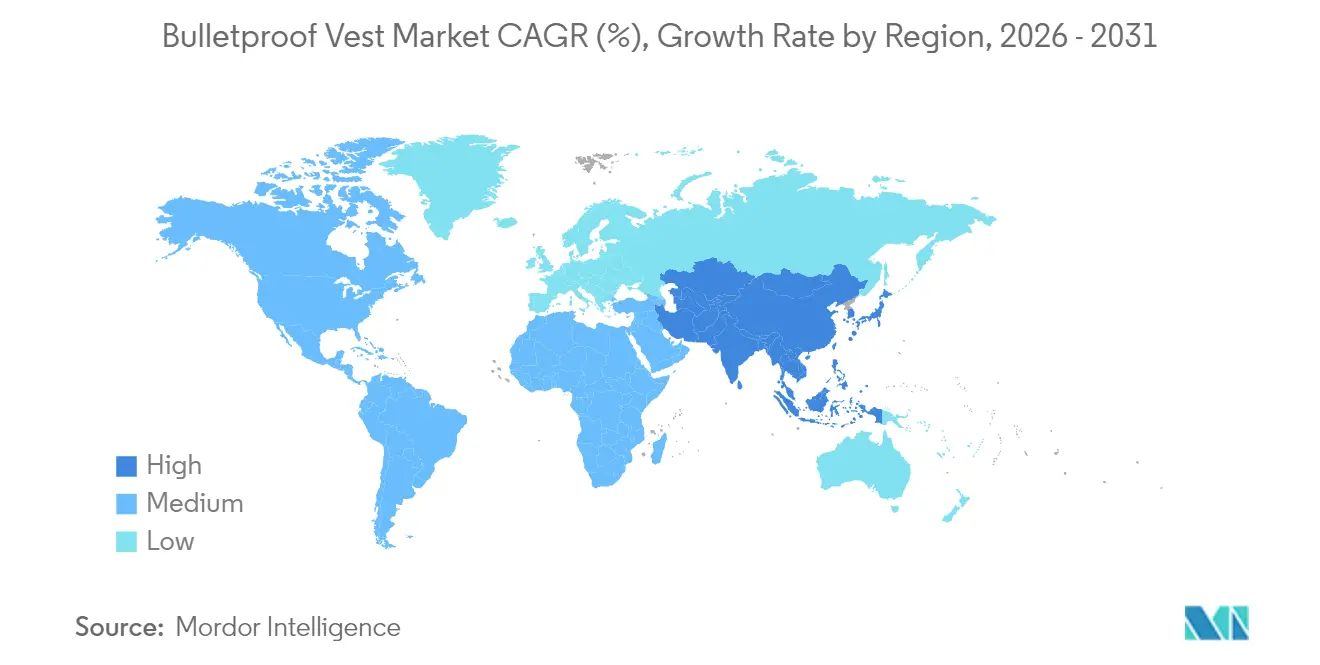
| Fastest Growing Market | Asia-Pacific |
| Largest Market | North America |
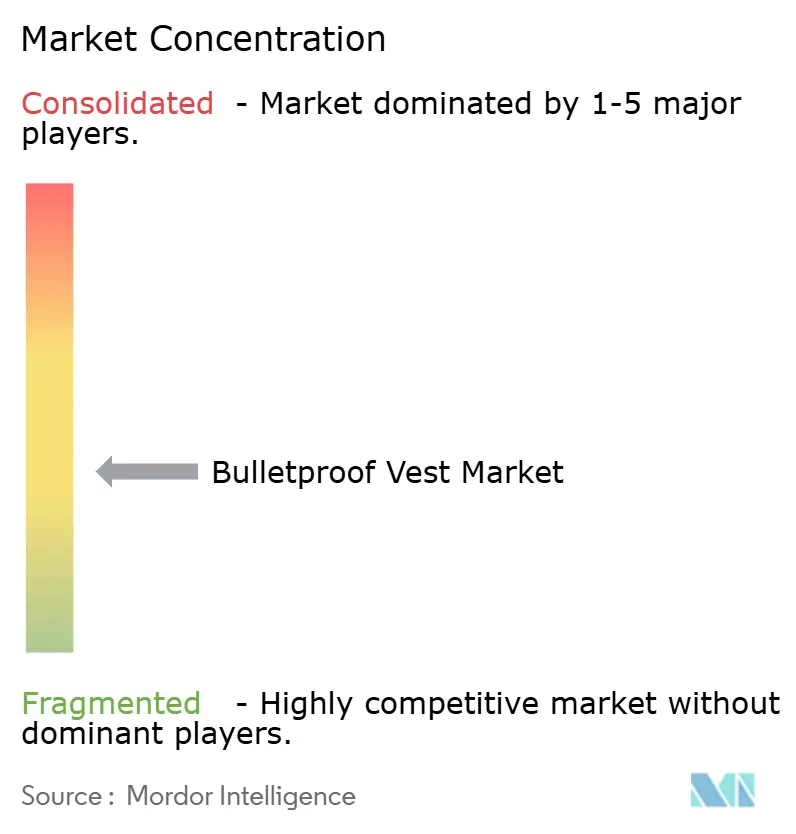
| Market Concentration | Medium |
Major Players *Disclaimer: Major Players sorted in no particular order Image © Mordor Intelligence. Reuse requires attribution under CC BY 4.0. | |
Bulletproof Vest Market Analysis by Mordor Intelligence
The bulletproof vest market size was valued at USD 1.76 billion in 2025 and estimated to grow from USD 1.82 billion in 2026 to reach USD 2.15 billion by 2031, at a CAGR of 3.35% during the forecast period (2026-2031).[1]Source: Henriette Riegels, “Transformation in European Defence Supply Chains as Ukraine Conflict Fuels Demand,” Scandinavian Journal of Military Studies, sjms.nu Growth hinged on defense modernization in Europe and Asia-Pacific, rapid adoption of lightweight soft armor by law enforcement agencies, material innovations that balanced protection with mobility, and tighter certification standards that raised replacement demand. Rising executive protection spending, particularly in North America and Western Europe, broadened the customer base beyond traditional military buyers. Meanwhile, the Ukraine conflict reshaped European procurement priorities, prompting local manufacturers to scale capacity and accelerating the adoption of Level IV plates for multi-hit scenarios. Ongoing raw-material price swings and counterfeit equipment scandals tempered near-term growth yet spurred demand for authenticated, NIJ-certified gear.
Key Report Takeaways
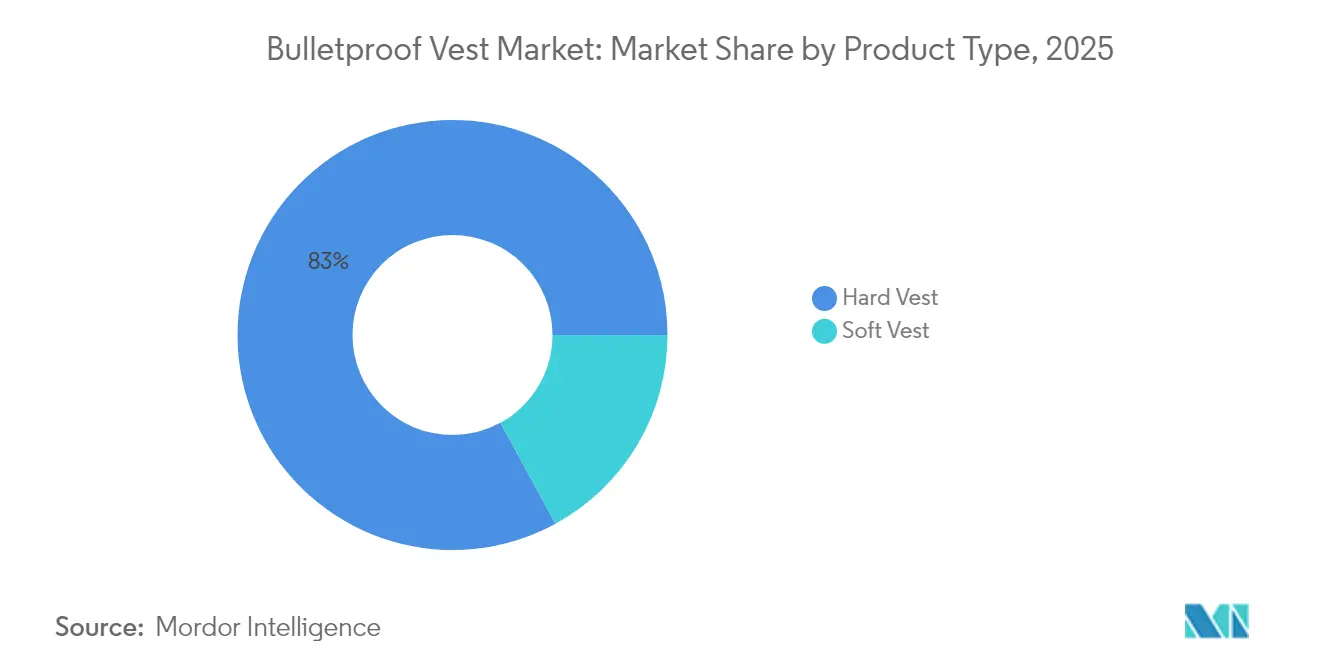
- By product type, hard vests led with 82.95% revenue share in 2025; soft armor is projected to expand at a 3.72% CAGR to 2031.
- By material, aramid retained 53.10% of the bulletproof vest market share in 2025, while UHMWPE is forecast to grow fastest at 3.95% CAGR through 2031.
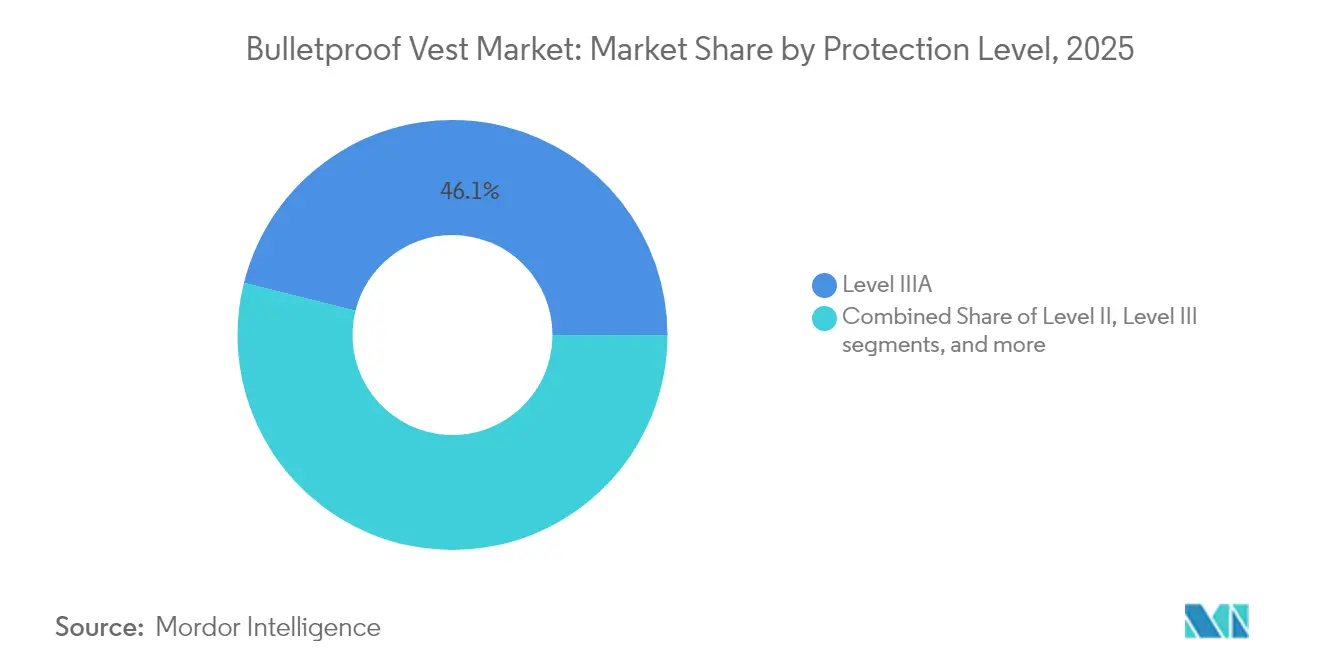
- By protection level, Level IIIA held 46.10% of the bulletproof vest market in 2025, whereas Level IV is expected to advance at a 3.86% CAGR until 2031.
- By end user, the military segment accounted for 72.10% share of the bulletproof vest market in 2025; private security exhibits the highest projected CAGR at 3.75% through 2031.
- By geography, North America dominated with a 42.00% share in 2025, while Asia-Pacific is set to record the strongest 3.76% CAGR to 2031.
Note: Market size and forecast figures in this report are generated using Mordor Intelligence’s proprietary estimation framework, updated with the latest available data and insights as of 2026.
Global Bulletproof Vest Market Trends and Insights
Drivers Impact Analysis*
| Driver | (~)% Impact on CAGR Forecast | Geographic Relevance | Impact Timeline |
|---|---|---|---|
| Escalating defense modernization programs | +0.8% | Global, with concentration in Europe, Asia-Pacific | Medium term (2-4 years) |
| Rising procurement of lightweight soft armor by law enforcement | +0.6% | North America and EU, expanding to Asia-Pacific | Short term (≤ 2 years) |
| Growing demand for female-fit ballistic vests | +0.4% | Global, led by North America and Europe | Medium term (2-4 years) |
| Adoption of multi-hit ceramic-UHMWPE hybrid plates | +0.5% | Global, military-focused markets | Long term (≥ 4 years) |
| Intensifying geopolitical conflicts and territorial disputes | +0.7% | Europe, Asia-Pacific, Middle East | Short term (≤ 2 years) |
| Expansion of private security and VIP protection industry | +0.3% | North America, Europe, emerging markets | Medium term (2-4 years) |
| Source: Mordor Intelligence | |||


Escalating Defense Modernization Programs
European, Asian, and North American armies pursued large-scale re-capitalization programs prioritizing survivability, driving orders for next-generation plates and carriers.[2]Source: Army Recognition staff, “French Special Forces to Be Equipped with Modular G3P Body Armor,” Army Recognition, armyrecognition.com France adopted the modular G3P system with boron-carbide inserts and real-time damage sensors, while Germany delivered 100,000 MOBAST vests to its troops, underscoring demand for scalable, technology-enabled solutions. Canada’s USD 19.7 million contract for 3,000 advanced sets further exemplified the modernization wave. These programs emphasized modularity, integration with soldier-worn sensors, and ergonomic adjustments for diverse body types, including female personnel, indicating a systemic shift toward user-centric armor design. Long-run funding commitments sheltered suppliers from short-term budget volatility.
Rising Procurement of Lightweight Soft Armor by Law Enforcement
Police departments in the United States and Europe increased orders for soft vests that cut officer fatigue without sacrificing NIJ compliance. DuPont’s Kevlar EXO and Dyneema’s SB301 reduced weight by up to 30% compared with prior fabrics, widening daily-wear adoption. Updated NIJ Standard 0101.07 introduced gender-specific fit testing that aligned procurement specifications with a more diverse workforce. Department of Justice field trials found negligible core-temperature increases among 504 officers wearing modern armor, dispelling heat-stress concerns and strengthening compliance rates. These factors collectively lifted replacement cycles and spurred backlog orders across municipal agencies.
Growing Demand for Female-Fit Ballistic Vests
Women constituted roughly 15% of the law-enforcement workforce in 2025, prompting dedicated vest designs with contoured panels, variable cup sizes, and moisture-wicking liners that trimmed bulk and improved ballistic coverage. MKU’s COV-F-IA covert model showcased anti-fungal fabrics and SK1 protection within a form-fitted profile, highlighting rising technical sophistication in this niche. Point Blank’s Python II Female vest added electroshock shielding, illustrating a single garment's ballistic and less-lethal protection convergence. Research into 3D warp-interlock fabrics provided repeatable dome-forming methods that maintained ballistic integrity while achieving female-specific ergonomics. NIJ certification frameworks mirrored these advances, mandating separate testing protocols that reinforced product differentiation.
Adoption of Multi-Hit Ceramic-UHMWPE Hybrid Plates
Armies that faced armor-piercing rounds in Ukraine and other conflicts turned to ceramic-UHMWPE hybrids for improved multi-hit endurance at lower mass than legacy steel designs. SiC/Ti6Al4V/UHMWPE trilayers resisted 12.7 mm threats while shaving 35% off weight, enhancing soldier mobility. Atmospheric-plasma surface treatment tightened bonding at the ceramic-polymer interface, yielding statistically significant upticks in V50 values without adding material. Russia’s boron-carbide iterations delivered BR-5 protection in plates weighing just 2,400 g, underscoring the performance headroom opened by local material science programs. These breakthroughs pushed competitors to accelerate hybrid-plate roadmaps and secure long-term fiber supply contracts.
Restraints Impact Analysis*
| Restraint | (~)% Impact on CAGR Forecast | Geographic Relevance | Impact Timeline |
|---|---|---|---|
| Volatile aramid and UHMWPE raw material prices | -0.5% | Global, manufacturing-concentrated regions | Short term (≤ 2 years) |
| Stringent export licensing for ballistic products | -0.3% | Global, US-EU export corridors | Medium term (2-4 years) |
| Heat-stress and back-face deformation concerns in tropical climates | -0.2% | Tropical regions, military deployments | Long term (≥ 4 years) |
| Proliferation of counterfeit/uncertified body-armor products | -0.4% | Global, emerging market focus | Medium term (2-4 years) |
| Source: Mordor Intelligence | |||
Volatile Aramid and UHMWPE Raw Material Prices
Aramid and UHMWPE costs swung sharply with petrochemical inputs and capacity additions, compressing margins for armor assemblers that lacked long-term supply pacts. DuPont’s USD 768 million goodwill impairment in Q1 2025 highlighted profitability headwinds inside legacy aramid lines.[3]Source: DuPont Investor Relations, “DuPont Reports First Quarter 2025 Results,” DuPont, investors.dupont.com Chinese UHMWPE makers undercut Western rivals on price, forcing brand-name suppliers to justify premiums through tighter quality control and PFAS-free chemistries. Research confirmed that resin-parameter variance directly affected fiber modulus, elevating scrap risk and raising processing costs during quality re-work. The resulting cost pass-through squeezed procurement budgets and elongated purchasing cycles
Proliferation of Counterfeit/Uncertified Body-Armor Products
Federal investigations revealed criminal networks that re-labeled low-grade plates from China as NIJ-certified US products, eroding buyer trust and triggering costly recalls. One Washington-state operator shipped more than USD 1 million of substandard gear to military and police clients before sentencing in March 2024. The confusion between “certified” and “compliant” labels amplified procurement risk for smaller agencies that lacked dedicated testing budgets. High-profile investigations into mislabeled imports pressured distributors to adopt blockchain-based provenance tools and sharpen vetting of upstream suppliers. The reputational fallout persuaded end users to favor established brands with transparent quality-assurance records.
*Our forecasts treat driver/restraint impacts as directional, not additive. The impact forecasts reflect baseline growth, mix effects, and variable interactions.
Segment Analysis
By Product Type: Hard Vest Dominance Reflects Threat Evolution
Hard configurations captured 82.95% of 2025 sales, confirming operational priorities that favored armored plate carriers able to withstand rifle fire. The bulletproof vest market size for hard vests was expected to increase by 3.28% CAGR to 2031, fueled by battlefield reports emphasizing multi-hit survivability against armor-piercing rounds. Military buyers demanded modular carriers that integrated communications routing, trauma packs, and identification panels, compressing legacy soft-armor share.
Material advances trimmed weight penalties, allowing infantry to add side plates or deltoid protection without breaching load thresholds. Soft vests remained essential for undercover police and VIP details that required concealment, yet their unit share contracted as weight savings in hard plates narrowed the mobility gap. 3D-knit fabrics and spacer meshes improved thermal regulation inside soft carriers, hinting at future crossover products that merge plate pockets with concealable textiles.


By Material: UHMWPE Gains Ground Against Aramid Legacy
Aramid preserved 53.10% of 2025 revenues, but UHMWPE climbed fastest at a 3.95% CAGR on the strength of higher specific energy absorption and buoyancy for maritime missions. PPTA/UHMWPE laminates outperformed single-fiber layups, demonstrating that hybrid stacks supplied optimal back-face deformation control during NIJ RF1 trials. Dyneema’s PFAS-free grades attracted buyers in Europe, where chemical-safety rules tightened.
Price volatility remained a drag on UHMWPE adoption because refinery outages and freight instability jolted feedstock costs. Still, suppliers secured long-term offtake agreements with plate assemblers, locking in volume discounts and shielding programs from spot-market spikes. Research into chainmail-like 2D polymers signaled the next leap, promising 47-fold stiffness gains and weights below contemporary UHMWPE sheets.
By Protection Level: Level IV Acceleration Reflects Threat Escalation
Level IIIA kept a 46.10% sales share in 2025 as the baseline for police patrols. Level IV plates were positioned to expand 3.86% annually as conflict zones normalized the presence of armor-piercing ammunition. NIJ Standard 0123.00 introduced refined rifle-threat definitions that guided agency upgrades from Level III to RF2, nudging demand toward ceramic-composite inserts.
Hybrid silicone-ceramic plates increased V50 thresholds while maintaining shoulder mobility, appealing to special-forces units that required agility in urban terrain. Hardcore Defense validated plate survivability with 30-round endurance tests per threat caliber, exceeding NIJ minimums and inflating customer expectations for empirical data. This proof-based purchasing environment enabled vendors to publish multi-hit curves rather than single-shot pass/fail certificates.
By End User: Military Dominance Amid Private Security Growth
Military procurement represented 72.10% of 2025 demand and was projected to grow 2.95% annually as governments replenished war-stock inventories and fielded updated soldier-system ensembles. The bulletproof vest market share held by armed forces mirrored elevated budgets in East Asia, where total outlays reached USD 411 billion in 2024. Law-enforcement consumption climbed steadily, buoyed by the US Bulletproof Vest Partnership that financed 1.4 million vests since 1999.
Private security emerged as the quickest-growing niche after high-profile CEO targeting spurred corporate spending on bodyguards, lifting allied-universal deployments past 17,000 specialists. Luxury brands and critical infrastructure operators adopted covert plate carriers to mitigate terrorism and civil unrest threats. Military recalls of non-conforming armor in the UK underscored the need for traceability, prompting agencies to negotiate performance-bond clauses that penalized suppliers for latent defects.
Geography Analysis
North America retained 42.00% of global sales in 2025 as sustained federal grants and proximity to major prime contractors anchored purchase volumes. Point Blank and Safariland exploited vertical integration to compress lead times. At the same time, US reshoring initiatives heightened site-security spending across new defense-industrial facilities, and some faced 75-point differences in security risk scores within a single metro area. Canada’s 2025 contract award confirmed a regional pipeline of modular plate carriers with delivery slated for 2026.
Asia-Pacific charted a 3.76% CAGR to 2031, propelled by 6.2% year-on-year growth in East-Asian defense budgets and indigenous production scale-ups in India, China, and South Korea. MKU’s Kavro Doma 360 helmet order illustrated the region’s preference for localized supply chains that met fast-track delivery targets for frontline units. Chinese UHMWPE exporters drove price competition, enhancing affordability for emerging Southeast-Asian buyers who balanced capability with budget caps.
Europe underwent structural realignment after the Ukraine war sparked ammunition and armor shortages, prompting EU funding worth EUR 500 million to boost defense manufacturing, including body armor fabrication lines. Germany’s 100,000-unit MOBAST delivery and France’s roll-out of the G3P vest indicated continental commitment to home-grown solutions that met NATO STANAG specifications. Bulgaria’s new 150,000 m² plant broadened European supplier diversity and signaled investor confidence in long-run volume. Ongoing recalls in the United Kingdom highlighted compliance gaps that encouraged agencies to centralize testing at NATO-accredited labs.

Competitive Landscape
The bulletproof vest market featured moderate fragmentation in 2025: the top players are leaving space for regional specialists and material-science newcomers. Point Blank, Safariland, and Honeywell International capitalized on integrated supply chains spanning fibers, plates, and finished carriers, reducing cycle times and offering tailored kitting options for agency tenders. Cadre Holdings, parent to Safariland, posted record USD 568 million 2024 sales and guided USD 572-601 million for 2025, underscoring sustained demand across duty-gear categories.
Material vendors influenced price and technology pathways; DuPont’s strategic review of Kevlar and Nomex brought speculation about vertical integration by downstream armor manufacturers seeking supply security. Dyneema’s PFAS-free launches are differentiated in sustainability, positioning the brand for European contracts subject to REACH regulations. Start-ups explored mechanically-interlocked 2D polymers with chainmail-like properties that promised step-change performance, attracting venture capital keen on dual-use applications in aerospace and sports.
Quality-assurance scandals reshaped competitive perceptions; firms implicated in counterfeit investigations lost procurement eligibility, transferring orders to compliant rivals. Vendors responded by embedding NFC tags and QR-coded tamper seals that enabled field verification using mobile apps, enhancing traceability in defense logistics pipelines. The resulting digital audit trails emerged as differentiators during multi-year framework tenders.
Bulletproof Vest Industry Leaders
Point Blank Enterprises, Inc.
Safariland, LLC
Central Lake Armor Express, Inc.
DuPont de Nemours, Inc.
Honeywell International Inc.
- *Disclaimer: Major Players sorted in no particular order

Recent Industry Developments
- May 2025: Canada awarded Logistik Unicorp a USD 19.7 million contract for 3,000 protective systems under its Dismounted Infantry Capability Enhancement program.
- September 2024: Avient Corporation, a leader in specialty and sustainable material solutions, unveiled Dyneema, which is dubbed the world's strongest fiber. Dyneema offers ultra-high-molecular-weight polyethylene (UHMWPE) fiber, unidirectional (UD) composite fabric, and film materials. These products, designed for hard and soft ballistic armor, helmets, and vehicle armor, are manufactured without the intentional addition of per- and poly-fluoroalkyl substances (PFAS).
- April 2024: DRDO's Defence Materials and Stores Research and Development Establishment (DMSRDE) in Kanpur developed India's lightest bulletproof jacket, offering protection against the highest threat level 6. This cutting-edge jacket, crafted using novel design approaches and materials, has successfully undergone testing against the 7.62 x 54 R API ammunition.


Research Methodology Framework and Report Scope
Market Definitions and Key Coverage
Mordor Intelligence defines the bulletproof vest market as new soft or hard torso-wearable ballistic garments rated at NIJ Levels II-IV that are procured by defense, law enforcement, and authorized civilian users worldwide. Vests integrated into full body armor suits or vehicle kits are outside this scope.
Scope exclusion: Helmets, shields, ceramic stand-alone plates, and aftermarket carrier upgrades are excluded.
Segmentation Overview
- By Product Type
- Soft Vest
- Hard Vest
- By Material
- Aramid Fibers
- UHMWPE Fibers
- Ceramic and Composite Inserts
- Steel and Other Materials
- By Protection Level
- Level II
- Level IIIA
- Level III
- Level IV
- By End User
- Military
- Civilian and Law Enforcement
- By Geography
- North America
- United States
- Canada
- Mexico
- Europe
- United Kingdom
- Germany
- France
- Italy
- Spain
- Russia
- Rest of Europe
- Asia-Pacific
- China
- India
- Japan
- South Korea
- Australia
- Rest of Asia-Pacific
- South America
- Brazil
- Argentina
- Rest of South America
- Middle East and Africa
- Middle East
- Saudi Arabia
- United Arab Emirates
- Turkey
- Rest of Middle East
- Africa
- South Africa
- Rest of Africa
- Middle East
- North America
Detailed Research Methodology and Data Validation
Primary Research
Structured interviews with procurement officers, materials scientists, and regional distributors across North America, Europe, and Asia-Pacific validate wear-rate assumptions, replacement cycles, and premium penetration. Short surveys of patrol officers clarify end-user preferences and budget timing.
Desk Research
Our analysts begin with open sources such as SIPRI military-expenditure tables, UN Comtrade shipment codes 621133/621139, NIJ certification bulletins, Interpol police workforce statistics, and white papers from associations like the International Body Armor Standards forum. Company 10-Ks, defense procurement notices, and respected press help map recent contract volumes and average selling prices (ASP). Subscription inputs from D&B Hoovers and Dow Jones Factiva enrich vendor financials and news trails. This list is illustrative; many further public and paid references inform the dataset.
Market-Sizing & Forecasting
A top-down rebuild starts with active-duty and sworn-officer populations, adjusts for vest fit-out ratios and mandated refresh intervals, and then multiplies by region-specific ASPs. Selective bottom-up supplier roll-ups test these totals. Key variables include defense budget outlays, NIJ certificate issuances, aramid-fiber price trends, import duties on UHMWPE, and recorded vest recalls, which together explain observed volume and price swings. Multivariate regression, supplemented by scenario analysis for conflict escalation, drives the 2025-2030 forecast. Data gaps in smaller economies are bridged using weighted interpolation from comparable forces.
Data Validation & Update Cycle
Outputs face four-layer variance checks, peer review, and senior sign-off. We refresh each dataset annually, triggering interim updates when sizable contracts, regulation shifts, or material cost shocks emerge. A final pre-publication sweep ensures clients receive the latest view.
Why Mordor's Bulletproof Vest Baseline Commands Reliability
Published estimates often diverge because firms weigh end-user groups differently and apply varied ASP inflation paths.
Key gap drivers include competitors bundling helmets or accessories, assuming universal five-year vest replacement (our model uses region-specific 5-7-year ranges), and fixing ASP escalation at uniform mid-single digits instead of linking it to aramid and UHMWPE price indices.
Benchmark comparison
| Market Size | Anonymized source | Primary gap driver |
|---|---|---|
| USD 1.76 B (2025) | Mordor Intelligence | - |
| USD 1.90 B (2025) | Global Consultancy A | Includes ballistic plates and carrier kits, aggressive eight-year CAGR tied to troop expansions |
| USD 2.30 B (2024) | Trade Journal B | Uses manufacturer shipment value, not end-user spend, and converts currencies at fixed 2022 rates |
| USD 1.57 B (2024) | Regional Consultancy C | Omits civilian security segment and relies on limited Latin American data |
In sum, Mordor Intelligence grounds every figure in verifiable demand pools, reconciled ASPs, and a clear refresh cadence. This offers decision-makers a balanced, transparent baseline they can trace back to tangible variables and repeatable steps.


Key Questions Answered in the Report
What is the current value of the bulletproof vest market?
It stood at USD 1.82 billion in 2026 and is projected to reach USD 2.15 billion by 2031, witnessing a 3.35% CAGR.
Which segment dominates the bulletproof vest market?
Hard vests dominated with 82.95% revenue share in 2025 due to military preference for multi-hit rifle protection.
Who are the key players in Bulletproof Vest Market?
Central Lake Armor Express, Inc., Safariland, LLC, Honeywell International Inc., Dupont De Nemours Inc. and Point Blank Enterprises, Inc. are the major companies operating in the bulletproof vest market.
Why is UHMWPE gaining popularity over aramid?
UHMWPE offers higher energy absorption at lower weight and is expanding at a 3.95% CAGR through 2031.
Which region is growing the fastest?
Asia-Pacific is forecast to grow at 3.76% CAGR as defense modernization accelerates across East Asia and South Asia.
How are counterfeit vests affecting the market?
Fraudulent products have triggered recalls, legal actions and stricter authentication requirements, slightly dampening CAGR growth by an estimated 0.4%.
What impact will new NIJ standards have on procurement?
Updated NIJ 0101.07 and NIJ 0123.00 add gender-specific fit and refined rifle-threat levels, leading agencies to upgrade inventories sooner than planned to remain compliant.
Page last updated on:


