Market Overview
| Study Period | 2020 - 2031 |
|---|---|
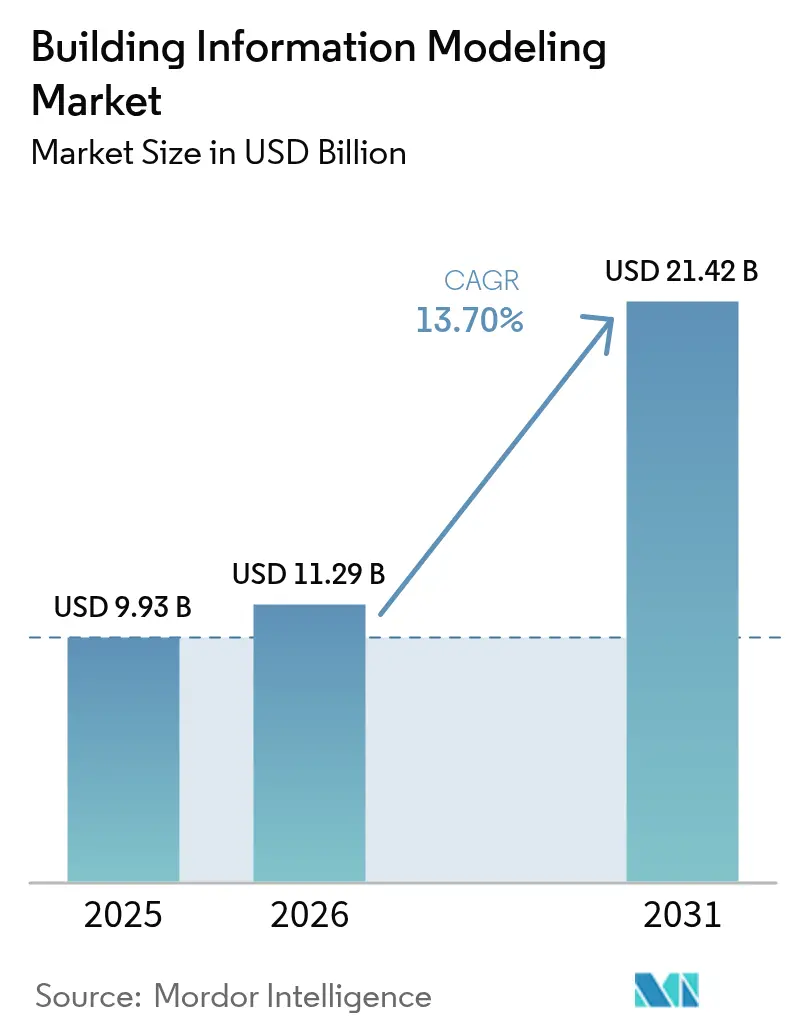
| Market Size (2026) | USD 11.29 Billion |
| Market Size (2031) | USD 21.42 Billion |
| Growth Rate (2026 - 2031) | 13.70% CAGR |
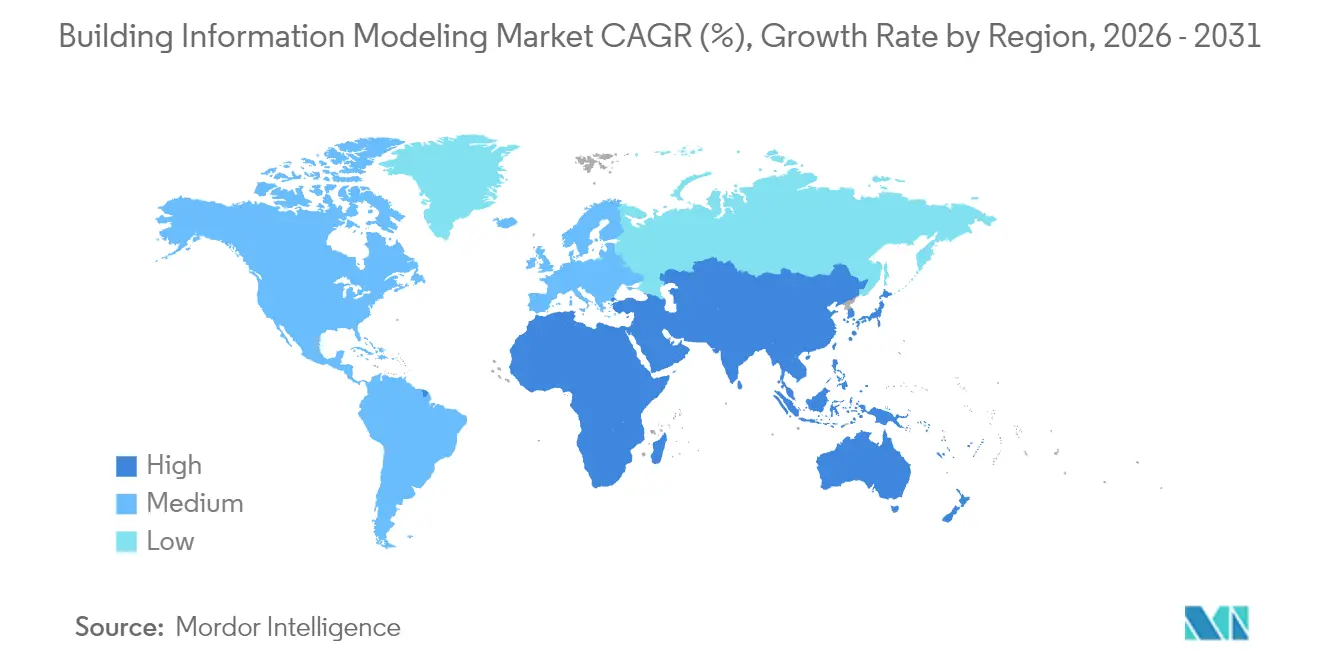
| Fastest Growing Market | Asia Pacific |
| Largest Market | North America |
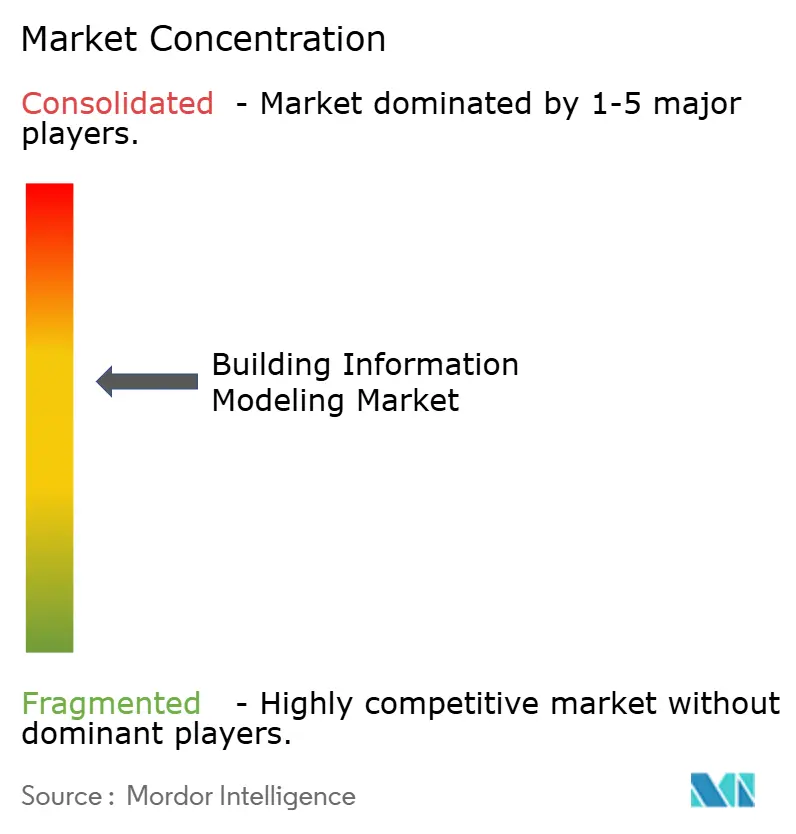
| Market Concentration | Medium |
Major Players *Disclaimer: Major Players sorted in no particular order Image © Mordor Intelligence. Reuse requires attribution under CC BY 4.0. | |
Building Information Modeling Market Analysis by Mordor Intelligence
The building information modeling market size is expected to grow from USD 9.93 billion in 2025 to USD 11.29 billion in 2026 and is forecast to reach USD 21.42 billion by 2031 at 13.7% CAGR over 2026-2031. Rapid digital transformation across architecture, engineering, construction and operations is expanding BIM from a visualization tool into a cloud-enabled collaboration platform. Growth is reinforced by tighter government mandates, integration with artificial intelligence and digital twins, and wider SaaS availability that lowers up-front costs for smaller firms. Vendors are also embedding 4D scheduling, 5D cost estimation and sustainability analytics as default capabilities, which keeps switching barriers high. Intense competition is prompting continuous upgrades that improve interoperability and workflow automation, deepening user reliance on subscription ecosystems throughout the project lifecycle.
Key Report Takeaways
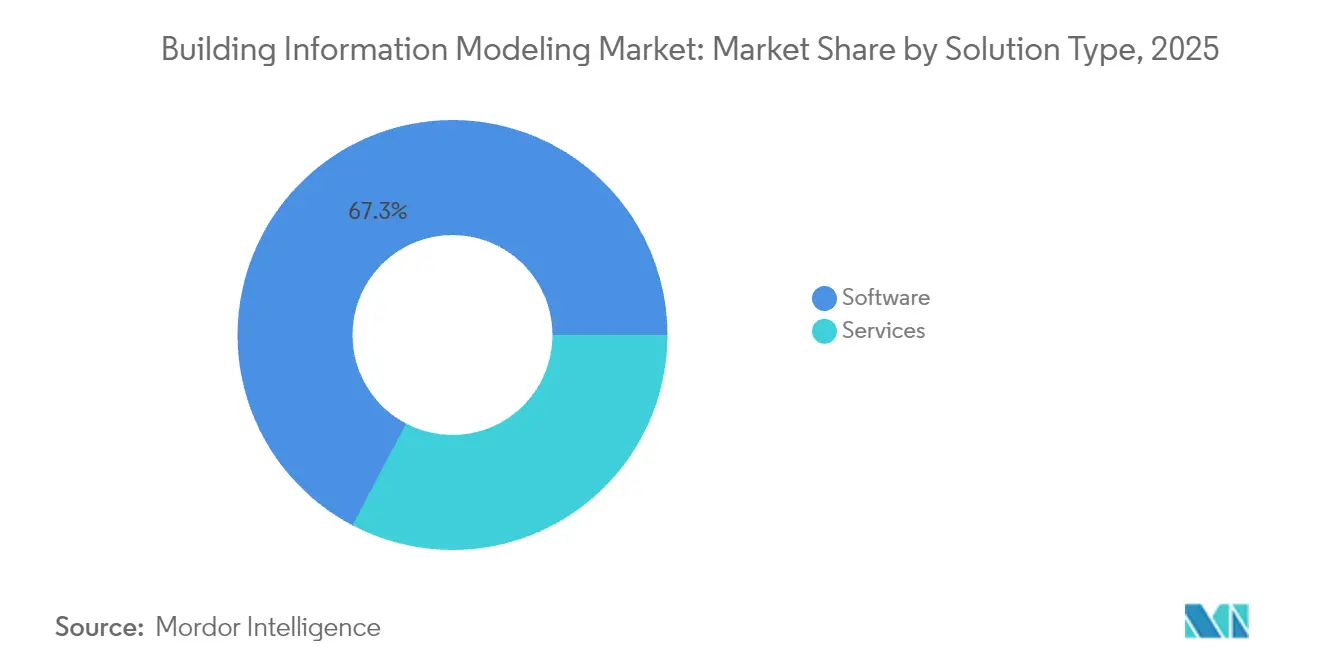
- By solution, software led with 67.30% revenue share in 2025 while the services segment is on track for a 15.6% CAGR to 2031.
- By deployment mode, on-premises held 71.10% of the building information modeling market share in 2025; cloud deployments show the fastest projected CAGR at 18.1% through 2031.
- By lifecycle stage, the pre-construction segment accounted for a 45.40% share of the building information modeling market size in 2025 and post-construction is increasing at a 16.7% CAGR.
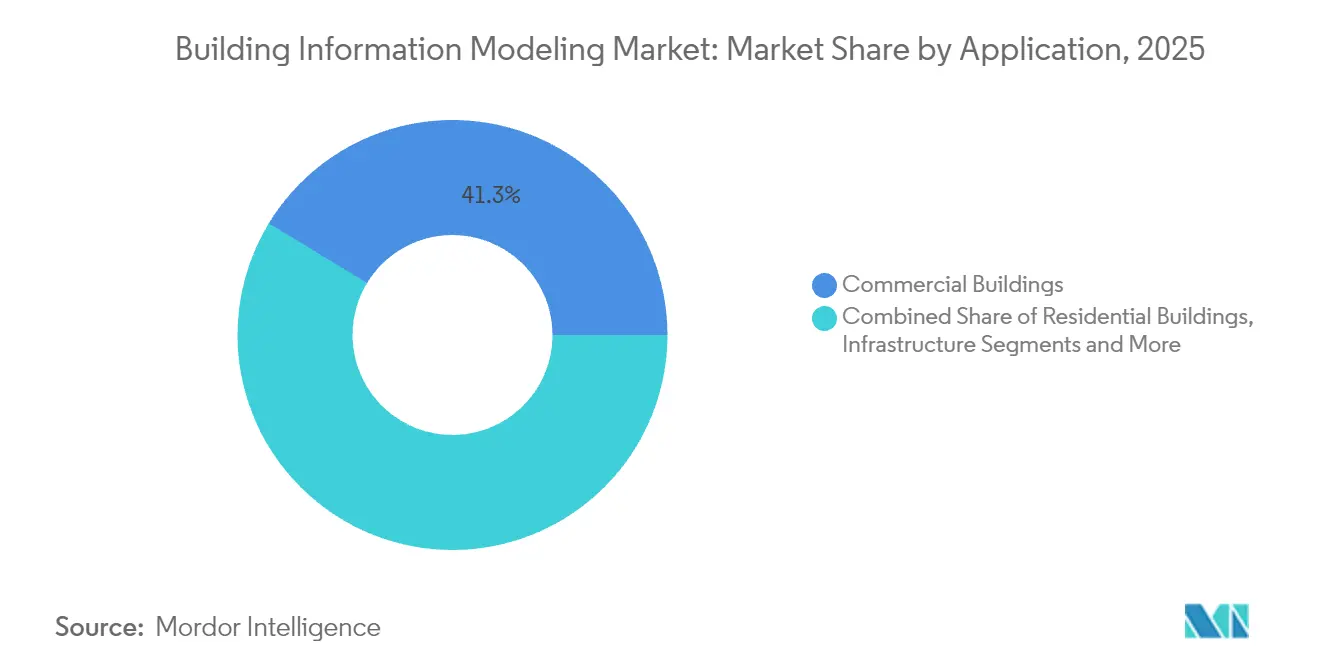
- By application, commercial buildings captured 41.30% revenue share in 2025 whereas infrastructure is forecast to expand at 16.6% CAGR to 2031.
- By end user, architects held 29.60% share in 2025 and contractors are set to grow at a 15.7% CAGR over the same period.
- Regionally, North America led with 37.40% of global revenue in 2025 while Asia-Pacific is advancing at a 14.6% CAGR to 2031.
Note: Market size and forecast figures in this report are generated using Mordor Intelligence’s proprietary estimation framework, updated with the latest available data and insights as of 2026.
Global Building Information Modeling Market Trends and Insights
Drivers Impact Analysis*
| DRIVER | (~) % IMPACT ON CAGR FORECAST | GEOGRAPHIC RELEVANCE | IMPACT TIMELINE |
|---|---|---|---|
| E-mandates & ISO 19650 alignment accelerating global BIM uptake | +2.0% | Europe, North America, developed Asia-Pacific | Medium term (2-4 years) |
| Rise of digital-twin-enabled asset lifecycle management | +1.5% | North America, Western Europe, Singapore, Japan, South Korea | Medium term (2-4 years) |
| Green-building & net-zero compliance pressures | +1.2% | Europe, North America, Australia, Japan; growing in China, India | Long term (≥ 4 years) |
| Modular/off-site construction demanding seamless prefab coordination | +1.0% | Scandinavia, UK, Singapore, Japan, urban North America | Medium term (2-4 years) |
| Cloud adoption and SaaS pricing lowering entry barriers | +0.9% | Global, most pronounced in North America and Asia-Pacific | Short term (≤ 2 years) |
| AI-driven generative design and predictive analytics boosting productivity | +0.8% | Global technology-ready markets; strongest in US, Germany, Japan | Medium term (2-4 years) |
| Source: Mordor Intelligence | |||
E-mandates and ISO 19650 alignment accelerating global BIM uptake
Mandated BIM use on public projects is normalizing digital delivery workflows across mature construction economies. The United Kingdom’s requirement for Level 3 BIM on public projects above GBP 5 million by 2025 encourages structured data exchanges that lower procurement risk.[1]EU BIM Task Group, “EUBTG BIM Survey Report 2024,” eubim.eu More than 60% of European public agencies now publish formal BIM strategies, which pushes private developers to follow the same standards. Comparable policies in several US states and provinces in Canada have the same cascading effect. Standardization around ISO 19650 simplifies cross-border collaboration, reduces contractual ambiguity and shortens onboarding time for new stakeholders, directly lifting adoption rates for the building information modeling market.
Rise of digital-twin-enabled asset lifecycle management
Owners increasingly connect BIM models with IoT sensors to generate live digital twins that optimize maintenance and reduce downtime. Buildings equipped with sensor-linked twins have reported 5% annual operating cost cuts and 35% faster maintenance response times.[2]Autodesk, “BIM Benefits | Why Use BIM?,” autodesk.com The promise of quantified savings during the 80% cost-of-ownership phase is compelling facility operators to upgrade legacy models into data-rich twins, which lifts software and service revenues throughout the operational stage of building information modeling market adoption.
Green-building and net-zero compliance pressures
Tighter embodied-carbon regulations in the European Union and several US cities force project teams to model energy and material performance from early concept. BIM platforms with embedded 6D sustainability modules allow instant simulation of energy intensity and carbon output, helping projects meet LEED, BREEAM or national net-zero targets. Autodesk’s 2025 survey found that 66% of executives plan to boost spending on digital tools that support sustainability. This regulatory and reputational pressure reinforces long-term demand across every region of the building information modeling market.
Modular or off-site construction demanding seamless prefab coordination
Factories manufacturing volumetric modules need millimeter-accurate digital definitions. BIM-driven clash detection and fabrication sequencing mitigate rework and enable just-in-time delivery. A highway megaproject in China saved USD 57.68 million and trimmed three months from its schedule after integrating BIM with a modular approach.[3]Dong Zhou et al., “Innovative BIM Technology Application in Highway Construction Management,” nature.com As skilled-labor shortages and schedule compression intensify, prefab contractors rely on interoperable models, opening new revenue lanes for cloud-centric platforms within the building information modeling market.
Restraints Impact Analysis*
| RESTRAINTS | (~) % IMPACT ON CAGR FORECAST | GEOGRAPHIC RELEVANCE | IMPACT TIMELINE |
|---|---|---|---|
| High Licensing and Training Costs for SME Contractor | -1.5% | Global, with severe impact in developing economies and among smaller firms | Short term (≤ 2 years) |
| Interoperability and Open-Standards Gaps Across Authoring Tools | -1.0% | Global, with particular challenges in multi-vendor environments | Medium term (2-4 years) |
| Cyber-security and IP Protection Concerns in Cloud Workflows | -0.8% | Global, with heightened concerns in regions with strict data sovereignty requirements | Short term (≤ 2 years) |
| Cultural Resistance to Process Re-engineering in Legacy Firms | -0.6% | Global, with stronger impact in traditional construction markets and family-owned firms | Long term (≥ 4 years) |
| Source: Mordor Intelligence | |||
High Licensing & Training Costs for SME Contractors
Initial seat licenses can exceed USD 10,000 while annual renewals and hardware upgrades increase total cost of ownership, causing many small firms to defer adoption. Funding programs such as Singapore’s Productivity Solutions Grant that reimburses up to 50% of software expenses partially mitigate the burden, yet cost sensitivity remains a near-term drag on the building information modeling market.
Interoperability & open-standards gaps across authoring tools
Data silos persist because proprietary extensions of IFC files create hand-off friction between design and operations. The recent Autodesk and Nemetschek partnership to enhance cross-platform workflows is an encouraging step, but inconsistent implementation still elevates coordination overhead, particularly on complex transportation projects with multiple specialties.
*Our forecasts treat driver/restraint impacts as directional, not additive. The impact forecasts reflect baseline growth, mix effects, and variable interactions.
Segment Analysis
By Solution: Software dominates while services accelerate
Software holds a 67.30% revenue share worth USD 6.68 billion. Authoring suites such as Revit and Archicad remain the entry point for model creation, with integrated 4D and 5D functions now interpreted as table stakes rather than premium add-ons. Continuous updates that incorporate AI-driven clash detection keep customer churn low, anchoring the building information modeling market.
Service revenue is rising at a 15.6% CAGR as owners and contractors outsource model development, coordination and analytics. Outsourcing gives firms access to scarce talent without fixed payroll commitments. Complex public-transportation schemes in Europe and Asia commonly appoint specialist BIM consultancies, expanding the addressable building information modeling market size for services.


By Deployment Mode: Cloud solutions gaining ground
On-premises installations represent USD 7.06 billion and 71.10% of 2025 revenue. Large design houses favor local servers that align with strict data-sovereignty rules. Security certifications such as FedRAMP and ISO 27001 are gradually easing those concerns, yet entrenched workflows slow migration.
Cloud deployments are growing at 18.1% CAGR. Subscription licensing lowers capital expenditure and delivers instant scalability, letting dispersed project teams co-author models in real time. After pandemic-driven remote work proved viable, many firms adopted SaaS to future-proof operations, steadily shifting the center of gravity of the building information modeling market toward hosted solutions.
By Project Lifecycle Stage: Post-construction applications surge
Pre-construction still captures 45.40% revenue. Clash detection during design and accurate quantity take-offs deliver immediate cost avoidance that justifies initial investment. Advanced visualization also helps secure stakeholder approvals earlier, trimming change orders once construction begins.
Post-construction use cases exhibit the fastest 16.7% CAGR. Facility managers link as-built models with Computerized Maintenance Management Systems, allowing predictive scheduling that saves 5% in yearly operating expense. The emphasis on lifecycle value propels deeper penetration of BIM into day-to-day operations, enriching recurring revenue across the building information modeling market.
By Application: Infrastructure projects accelerate adoption
Commercial buildings dominated 41.30% of 2025 revenue, driven by office, retail and mixed-use complexes that demand detailed visualization to attract tenants. Owners leverage BIM walkthroughs in leasing campaigns, embedding it in both design and marketing workflows.
Infrastructure is advancing at 16.6% CAGR as highways, bridges and airports incorporate civil-centric extensions of BIM. The US Federal Highway Administration now curates a national library of parametric bridge objects to standardize submissions. Government capital-works pipelines in Asia-Pacific further enlarge the building information modeling market for linear infrastructure.
By End User: Contractors embrace digital transformation
Architects account for 29.60% of current spending, reflecting their role as primary content creators and early advocates. Generative design combined with rule-based code checking accelerates concept iterations, reinforcing continued leadership in software uptake.
Contractors register a 15.7% CAGR as field-ready mobile apps display federated models on tablets, linking progress photos and RFIs to location-aware model elements. Competitive bid processes increasingly weight digital-delivery capability, so builders invest in internal BIM units, widening participation in the building information modeling industry.
Geography Analysis
North America generated USD 3.71 billion and 37.40% of global revenue in 2025. Federal infrastructure spending tied to digital-delivery requirements fuels broad adoption across transportation and utilities. The building information modeling market size in the United States benefits from standardized object libraries that simplify procurement and lifecycle management.
Europe ranks second, anchored by mandates in the United Kingdom and Germany. The continent’s 2025 revenue reached USD 3.12 billion and is on course to double by 2033. Regional software champions such as Nemetschek leverage close ties to academic research, which sustains a robust skills pipeline and keeps the building information modeling market competitive.
Asia-Pacific is the fastest-growing region at 14.6% CAGR. China’s smart-city initiatives, Japan’s automation push to counter labor shortages, and India’s expanding transport corridors create substantial volume. Government incentives in Singapore that cover a portion of software expenditure make it the region’s benchmark for policy-led progress, further enlarging the building information modeling market.
The Middle East and Africa remain smaller but exhibit strong momentum in Gulf states. Mega-projects like NEOM in Saudi Arabia adopt full digital-twin strategies, setting new regional standards. Capacity-building programs are underway to upskill local talent, gradually reducing reliance on imported expertise.

Regulatory Landscape
Government procurement and safety regimes are tightening BIM requirements and pushing the market toward standardized information management. In Spain, the Ministry of Transport and Sustainable Mobility applied updated public-procurement thresholds for mandatory BIM from January 1, 2026, reinforcing staged adoption tied to contract values. In Hong Kong, the Development Bureau (DEVB) Technical Circular No. 1/2025 requires BIM for capital works projects above HKD 30 million and makes design BIM models contractually binding for tenders invited on or after April 1, 2025.
Regulation is also moving beyond design deliverables into lifecycle data governance aligned with ISO 19650. The UK Building Safety Act framework, supported by the Higher-Risk Buildings (Keeping and Provision of Information etc.) (England) Regulations 2024, formalizes the need for a digital "golden thread" for higher-risk buildings (at least 18 meters or 7 storeys), elevating operational information continuity as a compliance requirement. Portugal further anchored national direction in May 2026 when the Council of Ministers approved Resolution 89/2026 establishing the PortugalBIM national strategy, signaling a multi-year pathway for harmonized BIM adoption across the asset lifecycle.
Value Chain Analysis
The BIM value chain spans (i) standards and information requirements, (ii) authoring and coordination tools, (iii) common data environments and cloud infrastructure, (iv) integration and implementation services, and (v) downstream construction execution and asset operations use cases. Upstream standard-setting bodies and open specifications increasingly shape interoperability and procurement acceptance, with ISO 16739-1:2024 (Industry Foundation Classes, IFC) expanding the standardized schema to cover infrastructure assets such as bridges, roads, railways, waterways, and port facilities. Industry bodies such as buildingSMART reinforce openBIM practices used by regulators and owners to reduce lock-in and preserve long-term data usability.
Midstream, software vendors and cloud platforms package authoring, coordination, 4D/5D, and analytics, while specialist service firms deliver implementation, model management, and training that convert tools into repeatable project workflows. Downstream adoption is influenced by public-client playbooks and project controls that connect BIM data to procurement, fabrication, and logistics, especially in modular and off-site construction where BIM-to-manufacturing bills of materials and RFID-linked tracking are used to reduce site rework and inventory mismatches. As agencies formalize BIM thresholds in procurement, demand concentrates around ecosystems that can reliably exchange IFC-based data across design, build, and operate stakeholders.
Competitive Landscape
Market leadership is moderately concentrated. Autodesk, Nemetschek, Bentley Systems, Trimble and Hexagon collectively hold about 60% of revenue, giving them scale to invest in cloud platforms and AI. Autodesk deepened its ecosystem by acquiring Payapps, expanding from design collaboration into payment workflows. Nemetschek surpassed EUR 1 billion revenue in 2025 on the strength of its multi-brand strategy.
Bentley focuses on civil infrastructure with OpenRoads and asset-performance twins, capturing projects aligned to national transport upgrades. Trimble leverages its field hardware and Tekla structures to bridge the gap between office and site, which resonates with steel fabricators and contractors. Strategic partnerships such as the Autodesk-Nemetschek interoperability initiative help blunt customer frustration with data silos, enhancing market stickiness.
Emerging challengers deliver browser-native modeling and AI-assisted code compliance checks that promise faster onboarding for small firms. Venture funding is flowing toward niche SaaS players that target regional language support or specialty workflows, broadening competitive dynamics within the building information modeling market.
Regulatory alignment, rapid cloud innovation and demand for integrated lifecycle analytics ensure ongoing rivalry on platform completeness, ecosystem openness and subscription value rather than traditional license pricing alone.
Building Information Modeling Industry Leaders
Autodesk Inc.
Bentley Systems Inc.
Dassault Systems SA
Nemetschek SE
Trimble Inc.
- *Disclaimer: Major Players sorted in no particular order

Market Opportunities and Future Outlook
A key opportunity is in information-management-led workflows that convert BIM from a model authoring activity into a governed lifecycle data layer across delivery and operations. In March 2026, work around the revised ISO 19650 Draft International Standard (DIS) highlighted a shift toward formal information management constructs, creating whitespace for vendors and service providers to hard-wire Level of Information Need and standardized information delivery into Common Data Environments, automated checking, and API-driven exchanges. This aligns with owner and regulator requirements that increasingly emphasize durable, auditable data rather than only design geometry.
Public-sector programs and national strategies also keep creating addressable deployment pipelines, onboarding support, and compliance tooling, particularly for SMEs that remain cost-sensitive. Hong Kong DEVB Technical Circular No. 1/2025 makes design BIM models contractually binding for relevant tenders from April 1, 2025, strengthening the business case for contract-grade model governance, QA/QC, and managed services. Portugal's Resolution 89/2026 establishing PortugalBIM and Spain's January 1, 2026 threshold updates in public procurement provide concrete multi-year pathways where vendors can package implementation accelerators, templates, and training, while open-standard readiness (IFC/ISO-aligned) becomes a differentiator for cross-border teams and long-lived asset information.
Recent Industry Developments
- July 2026: Bentley Systems announced a strategic expansion in Japan, including a new Tokyo headquarters and plans to double its local workforce to support the national i-Construction initiative for 3D digital delivery by 2029. The expansion improves Bentley's proximity to public-works stakeholders and positions its digital delivery and digital twin platforms for large infrastructure programs where standards-driven workflows are becoming procurement requirements.
- June 2026: Autodesk signed a strategic collaboration agreement with Amazon Web Services to advance cloud-based Design and Make solutions. The agreement supports BIM workloads that require scalable compute and data services, reinforcing the shift toward cloud collaboration and centralized project information across distributed project teams.
- April 2026: Bentley Systems achieved FedRAMP Moderate authorization for its ProjectWise and OpenGround cloud platforms. This security milestone expands eligibility for U.S. federal use cases and reduces a key barrier to cloud deployment in regulated environments where data governance and certification requirements influence platform selection.


Research Methodology Framework and Report Scope
Market Definition and Coverage
This market covers the revenues generated from building information modelling (BIM) software and BIM-related services used to plan, design, build, and manage buildings and infrastructure using a shared digital model across the project lifecycle.
Scope exclusions: We do not count general construction execution work, raw materials, or non-BIM design tools that do not create or manage BIM models.
Segmentation Overview
- By Solution Type
- Software
- Dimension
- 3D
- 4D
- 5D
- 6D
- 7D and Beyond
- Dimension
- Services
- Consulting and Advisory
- Implementation and Integration
- Training and Support
- Managed Services
- Software
- By Deployment Mode
- On-premises
- Cloud
- By Project Lifecycle Stage
- Pre-construction (Planning and Design)
- Construction (Site Execution)
- Post-construction (Operations and Maintenance)
- By Application
- Commercial Buildings
- Residential Buildings
- Industrial and Manufacturing Facilities
- Infrastructure (Roads, Rail, Airports, Ports, Bridges)
- Institutional (Healthcare, Education, Government)
- Other Applications
- By End User
- Architects and Designers
- Engineers (Structural, MEP)
- Contractors and Builders
- Owners and Developers
- Facilities and Asset Managers
- Consultants and Project Managers
- By Geography
- North America
- United States
- Canada
- Mexico
- South America
- Brazil
- Argentina
- Rest of South America
- Europe
- Germany
- United Kingdom
- France
- Italy
- Nordics
- Rest of Europe
- Middle East
- United Arab Emirates
- Saudi Arabia
- Turkey
- Rest of Middle East
- Africa
- South Africa
- Rest of Africa
- Asia-Pacific
- China
- Japan
- India
- South Korea
- Southeast Asia
- Rest of Asia-Pacific
- North America
Data Sources, Market Sizing, and Validation
Desk Research
Desk research was used to build the basic structure of the BIM market model and to set practical boundaries on what is, and is not, included in the revenue pool. Public sources, such as the US Census Bureau construction spending series, Eurostat construction output, and World Bank macro indicators, helped us align BIM demand with construction cycles and investment levels.
We also reviewed materials from standards and public bodies that shape BIM adoption signals, for example, NIST publications, ISO-related public guidance pages, and public procurement or infrastructure program portals where BIM requirements are disclosed. These were checked against company annual reports, investor presentations, and reputable construction technology press coverage to understand pricing direction, cloud adoption, and services intensity. Where available, a paid subscription focused on company financials and another on patents were used to validate revenue ranges and innovation activity without relying on a single disclosure. The desk research source list is illustrative only, and many other public references were used for data collection, cross-checking, and clarifying assumptions.
Primary Interviews and Surveys
Primary work focused on confirming how BIM is purchased and delivered across software and services, and on pressure-testing adoption levels across contractors, designers, and owner-operators. We conducted expert interviews and structured surveys across APAC, EMEA, and the Americas to validate pricing patterns, cloud versus on-premises splits, and the typical scope of services delivered during pre-construction, construction, and post-construction.
Distribution of primary research fieldwork respondents
| Company type | Respondent position | Region |
|---|---|---|
| Top tier: 31% | CXOs: 13% | APAC: 42% |
| Mid tier: 48% | Functional/Unit leaders: 32% | EMEA: 31% |
| Smaller Players: 21% | Managers: 55% | Americas: 27% |
Market-Sizing & Forecasting
The core sizing starts with a top-down build that reconstructs the addressable BIM spend from construction activity and digital design intensity, and then allocates it into software and services based on observed purchase patterns. After that, totals are corroborated with selective bottom-up approximations, such as sampled average selling price (ASP) ranges by seat or project, channel feedback on deal sizes, and vendor revenue cues where disclosures are clear enough to be comparable.
Inputs used in the model include construction spending and construction output trends, the share of projects using BIM due to public mandate and owner requirements, cloud deployment adoption, services attach rates during implementation and model management, and typical renewal or subscription dynamics that influence recognized revenue. When data was sparse for a country or end user group, we filled gaps using proxy indicators like construction capex growth and the local maturity of digital project delivery, then confirmed with experts to avoid overstating demand.
Forecasting was run using scenario analysis supported by near-term leading indicators, and then smoothed so the results reflect how BIM adoption scales across real projects rather than jumping year to year. The scenario paths were reviewed with practitioners so assumptions on penetration, price progression, and services intensity stay grounded for the forecast window.
Data Validation & Update Cycle
Estimates were cross-checked through triangulation across construction activity signals, adoption indicators, and revenue reasonableness checks, then reviewed through multiple analyst steps before sign-off. Large variances triggered follow-up checks, including re-contacting selected respondents and revisiting assumptions that drive penetration, ASP movement, and the split between software and services.
The report is refreshed annually, and interim updates are made when material events can change demand or pricing assumptions. Before delivery, a final analyst pass is completed to ensure the latest public releases and market signals are reflected in the model outputs.
Mordor Intelligence's Building Information Modelling Market Size Versus Other Published Estimates
Published BIM market sizes often vary because firms draw the boundary differently between BIM software, BIM services, and adjacent AEC software tools, and they also differ in the year they treat as the starting point. The conversion rate used and whether values are stated as a base-year number or as a forecasted year number can further widen the spread.
By tracking software-plus-services revenues by lifecycle usage and then checking penetration and ASP movement, Mordor Intelligence keeps the total tied to BIM-specific spend, instead of folding in broader AEC design and project management tools that are not always used for BIM model creation and management.
Benchmark comparison
| Source | Market Size | Gaps in Research Methodology |
|---|---|---|
| Mordor Intelligence | USD 9.93 B (2025) | |
| Global Consultancy A | USD 9.70 B (2025) | Uses a different base-year setup (2024 actuals rolling into a 2025 forecast) and can apply broader modeling around construction tech demand, which shifts how quickly penetration ramps in early years. |
| Industry Publisher B | USD 9.12 B (2025) | Treats the scope more narrowly around BIM software in places where services and implementation work are not consistently counted, which reduces the addressable revenue pool in the base year. |
The table indicates that the biggest differences come from what is included as BIM versus adjacent tools, plus how services revenues and early-year adoption are handled. With clear scope rules, traceable inputs, and repeatable checks, the sizing stays balanced and can be followed back to practical market drivers.


Key Questions Answered in the Report
What is driving the rapid growth of the building information modeling market?
Growth is propelled by government mandates, expanding cloud adoption, integration of AI and digital twins, and the need to meet net-zero targets, all of which raise demand across design, construction and operations.
How large will the building information modeling market size become by 2031?
The market is projected to reach USD 21.42 billion by 2031, reflecting a 13.7% compound annual growth rate.
Which deployment model is growing fastest within the building information modeling market?
Cloud-based solutions are expanding at an 18.1% CAGR because they lower capital costs and support real-time collaboration for distributed teams.
Why are post-construction applications important for BIM adoption?
Facility managers can link BIM models with maintenance systems, reducing annual operating costs by about 5% and extending asset life, which strengthens the ROI narrative for adopting BIM through the entire lifecycle.
Which region is expected to show the highest future growth in the building information modeling industry?
Asia-Pacific is forecast to advance at a 14.6% CAGR, driven by large infrastructure programs in China and India and supportive digital-construction policies in Japan and Singapore.
What are the main obstacles to wider BIM uptake among smaller contractors?
High software licensing fees, expensive training, and lingering interoperability issues make it difficult for SME contractors to justify investment, although targeted grants and maturing open standards are gradually lowering those barriers.
Page last updated on:


