Broaching Machine Market Size and Share
Market Overview
| Study Period | 2020 - 2031 |
|---|---|
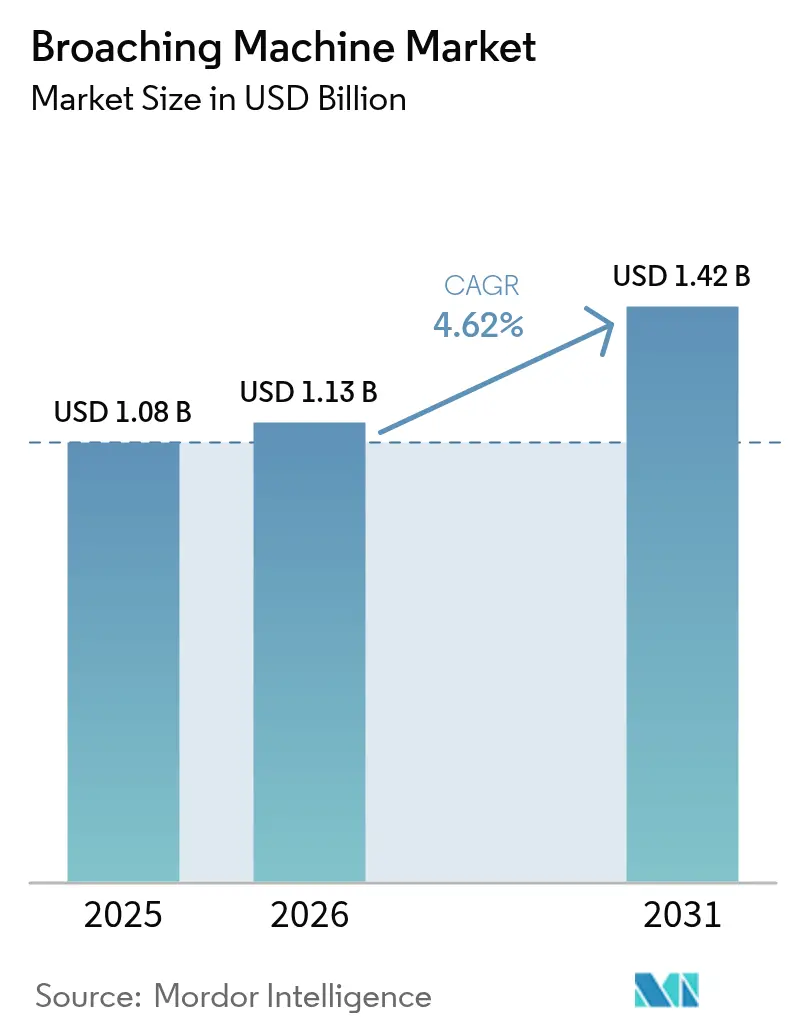
| Market Size (2026) | USD 1.13 Billion |
| Market Size (2031) | USD 1.42 Billion |
| Growth Rate (2026 - 2031) | 4.62% CAGR |
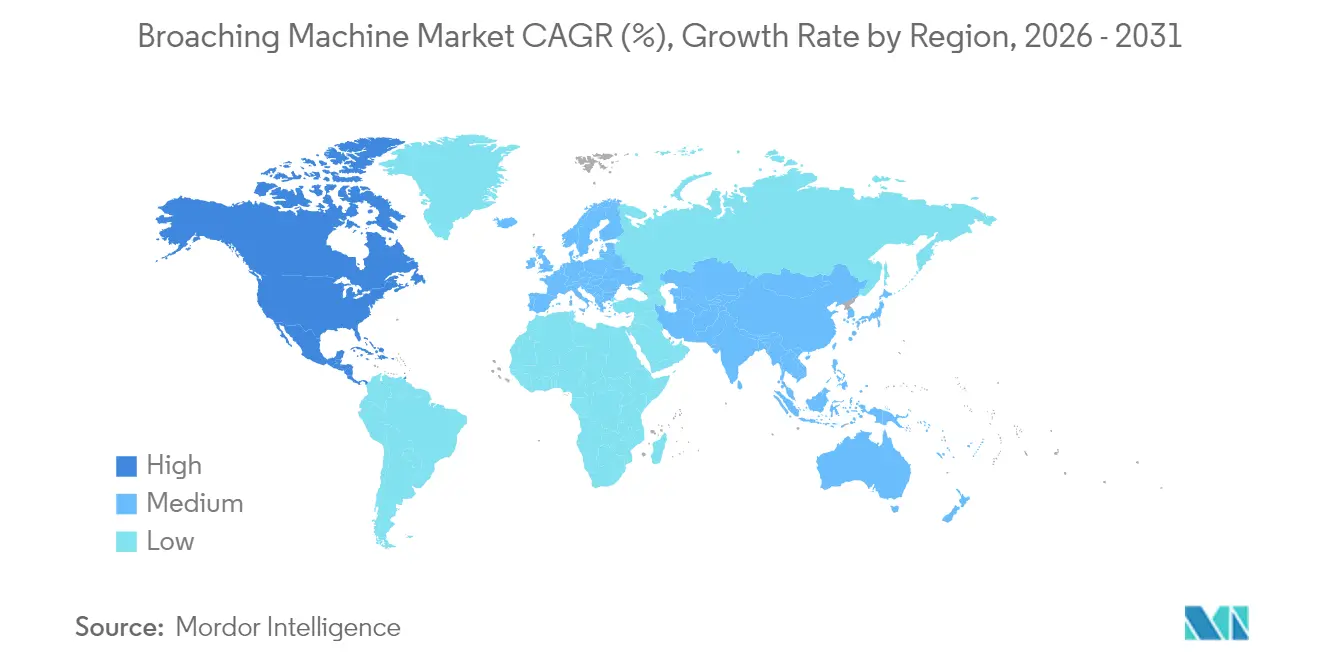
| Fastest Growing Market | North America |
| Largest Market | Asia Pacific |
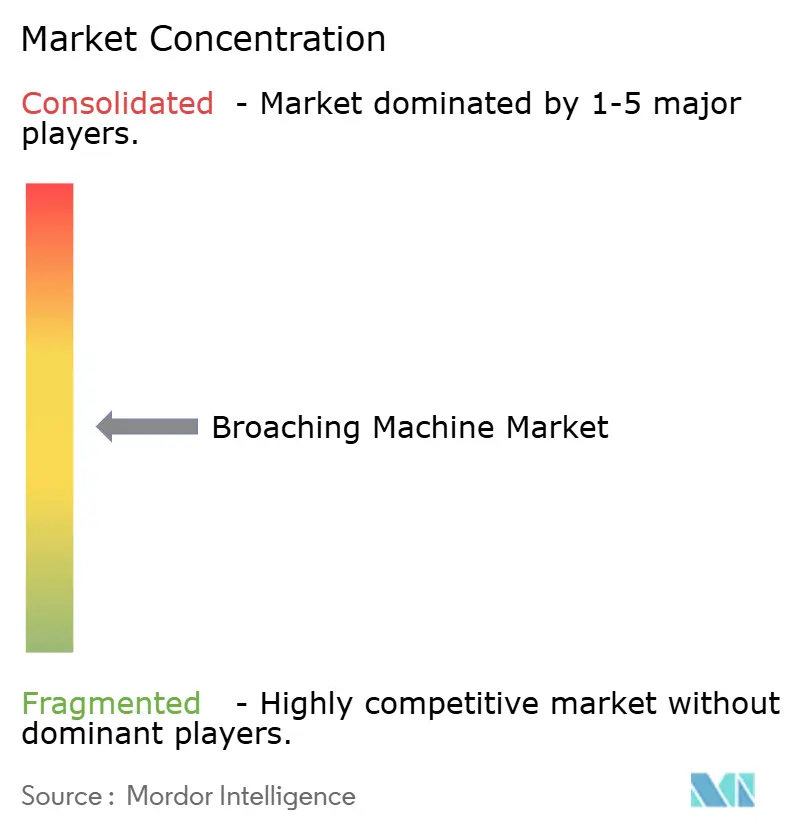
| Market Concentration | Medium |
Major Players *Disclaimer: Major Players sorted in no particular order Image © Mordor Intelligence. Reuse requires attribution under CC BY 4.0. | |
Broaching Machine Market Analysis by Mordor Intelligence
The Broaching Machine market size is expected to grow from USD 1.08 billion in 2025 to USD 1.13 billion in 2026 and is forecast to reach USD 1.42 billion by 2031 at 4.62% CAGR over 2026-2031. Rising demand for sub-micron tolerances in electric-vehicle gearboxes, the rebound of commercial aviation production schedules, and defense localization mandates lift capital spending on advanced broach lines. Orders for horizontal and surface machines expand as factories pair legacy CNC cells with high-speed broaching units to compress takt times. Equipment-as-a-service subscriptions, remote diagnostics, and predictive-maintenance modules widen access for small and mid-sized suppliers that lack upfront capital. Labor scarcity and tungsten-carbide price swings weigh on profit margins, yet regional incentives for smart-factory retrofits maintain a supportive investment climate. Collectively, these elements sustain a steady, mid-single-digit growth path for the broaching machines market through 2030.
Key Report Takeaways
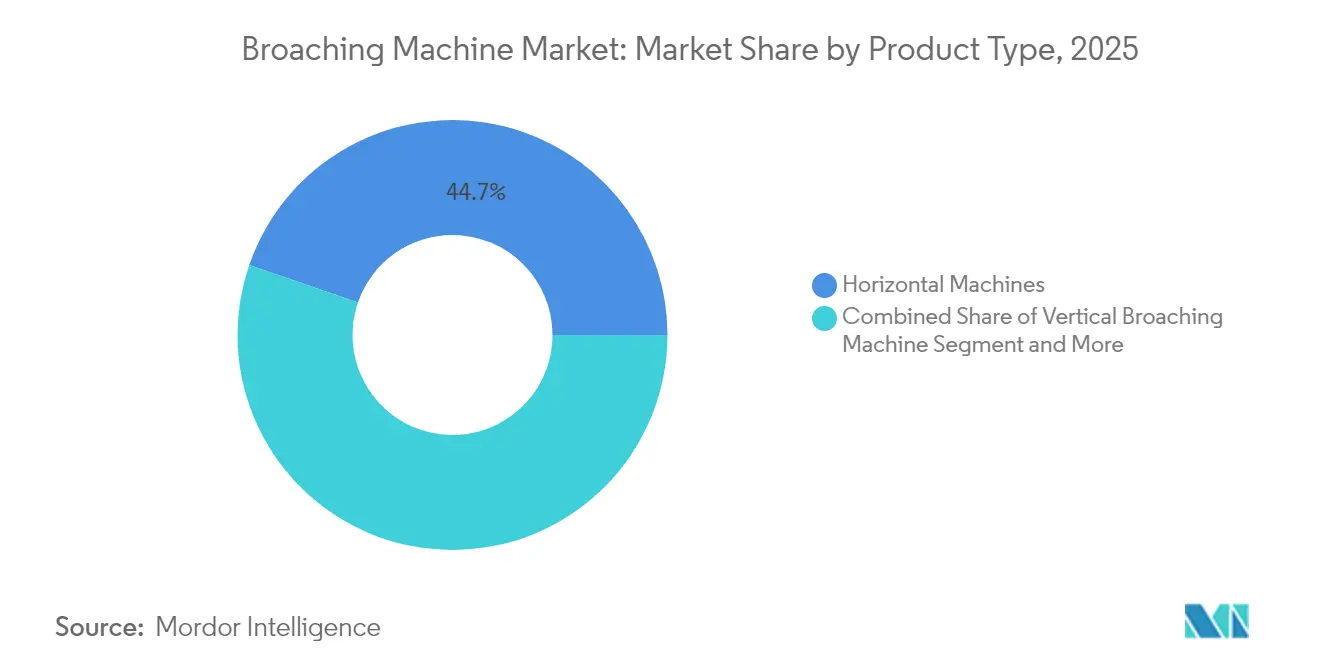
- By product type, horizontal machines held 44.72% revenue share in 2025; surface broaching is projected to expand at a 6.46% CAGR through 2031.
- By operation mode, the semi-automatic segment accounted for 52.98% of the broaching machines market share in 2025, while fully automatic systems are forecast to grow at a 7.12% CAGR to 2031.
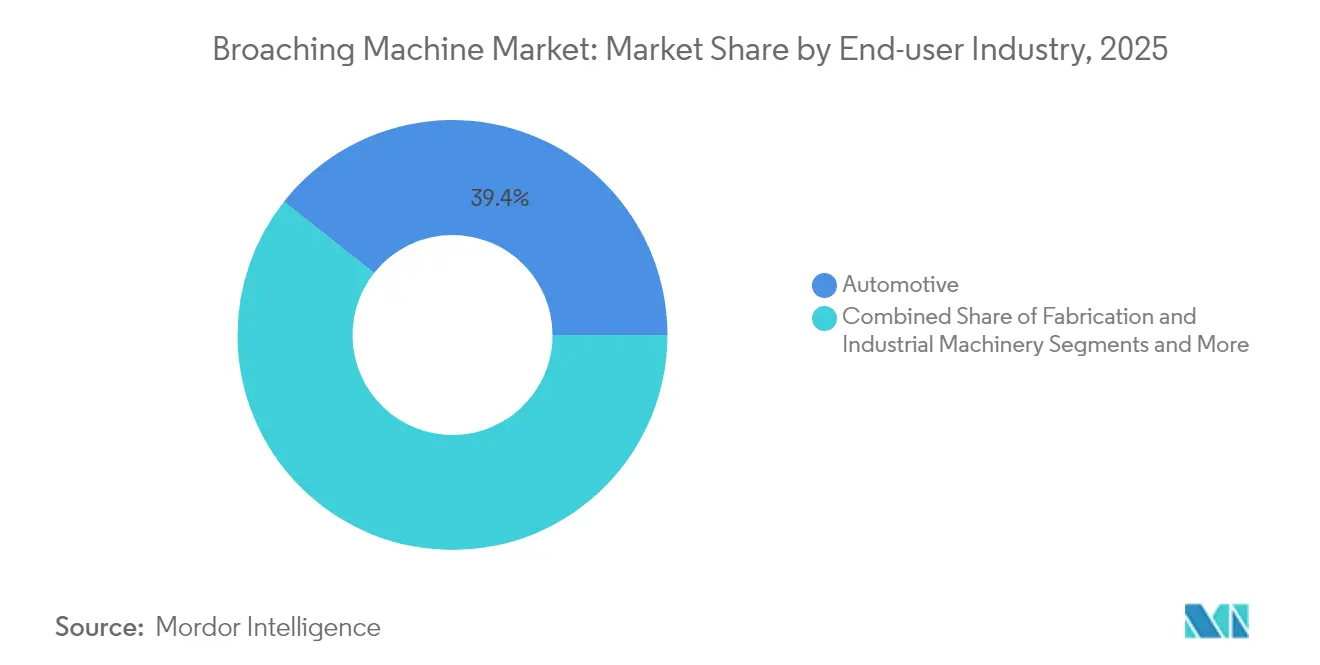
- By end-user industry, automotive contributed 39.35% of the broaching machines market size in 2025; medical devices are slated to register a 6.85% CAGR from 2026-2031.
- By geography, Asia-Pacific captured 55.22% of global revenue in 2025, whereas North America is expected to post the fastest 6.94% CAGR through 2031.
Note: Market size and forecast figures in this report are generated using Mordor Intelligence’s proprietary estimation framework, updated with the latest available data and insights as of 2026.
Global Broaching Machine Market Trends and Insights
Drivers Impact Analysis*
| Driver | % Impact on CAGR Forecast | Geographic Relevance | Impact Timeline |
|---|---|---|---|
| Surge in Precision-Machined EV Power-train Components (Asia) | +1.2% | Asia-Pacific core, spill-over to North America | Medium term (2-4 years) |
| Aggressive Automation Retrofits in Chinese Tier-2 Job-Shops | +0.9% | China, with technology transfer to ASEAN | Medium term (2-4 years) |
| Revival of Commercial Aerospace Build-Rates (North America & Europe) | +0.8% | North America & Europe | Short term (≤ 2 years) |
| OEM Shift from Hobbing to Rotary-Table Broaching for High-Mix Gearboxes | +0.7% | Global, with early adoption in North America & Europe | Medium term (2-4 years) |
| Defence Offset Mandates Fueling Local Gear-Hob & Broach Demand (Middle East) | +0.6% | Middle East, with expansion to emerging markets | Long term (≥ 4 years) |
| Rapid Tooling-as-a-Service Models for Short-Run Prototyping | +0.5% | North America & Europe, expanding to Asia-Pacific | Short term (≤ 2 years) |
| Source: Mordor Intelligence | |||
Surge in Precision-Machined EV Power-train Components (Asia)
Electric-vehicle gearboxes now require tooth accuracy of ±0.0005 inches, a tolerance level impractical for milling at scale. Chinese manufacturers leverage policy loans and tax credits to install horizontal broach cells with fully enclosed servo drives that hold dimensional drift below 2 microns for 20-hour runs. Integrated e-axle designs fold multiple gears, splines, and keyways into a single housing, pushing demand toward flexible broaching lines able to complete internal and surface cuts sequentially. Export contracts for Asia-manufactured e-power-trains into North American assembly plants reinforce capacity additions, amplifying the broaching machines market across both regions. As product life cycles compress, suppliers favor modular broach heads with quick-change guides that cut setup times by 40%, further entrenching technology adoption.
Aggressive Automation Retrofits in Chinese Tier-2 Job Shops
Beijing’s equipment-upgrade initiative seeks 25% real growth in machine-tool investment by 2027 and targets 75% numerical-control penetration across key processes. Provincial grant programs reimburse up to 30% of CNC broach-line spend for small and mid-sized firms[1]Ministry of Industry and Information Technology, “Notice on Promoting High-End Equipment Upgrading,” Government of China, gov.cn. Automation retrofits integrate robot loaders, vision-based datum checking, and closed-loop tool-wear sensors, enabling lights-out operation in high-mix environments. Pilot plants report 18% unit-cost savings and 32% scrap reduction, reinforcing repeat orders. Technology diffusion to ASEAN vendors follows, as Chinese tier-ones transfer production packages to regional partners, expanding the broaching machines market footprint across Southeast Asia.
Revival of Commercial Aerospace Build-Rates (North America & Europe)
Aircraft order backlogs exceeded 14,700 units in late-2024, prompting air-framers to raise monthly output targets. Landing-gear trunnions, engine-mount sockets, and titanium pylon-flange bosses all feature deep internal slots best produced on broaching equipment. Tier-one structures groups therefore add surface broach stations rated at 120 MPa cutting pressure, reducing cycle times by 30% versus ram-type machining. European subcontractors diversify into broaching to satisfy dual-sourcing mandates from air-framers, distributing new-machine demand across the Atlantic. Process-capability audits by aerospace primes increasingly require in-house broach capability, embedding the technology as a core fixture of supply-chain resilience.
Defence Offset Mandates Fueling Local Gear-Hob & Broach Demand (Middle East)
Kuwait enforces a 35% industrial-participation clause on defense imports, and Saudi Arabia targets 50% defense-spend localization by 2030 under Vision 2030. Program offices direct a share of offset funds to joint ventures that build gearboxes for armored vehicles and helicopter power-trains. These plants specify horizontal broach systems capable of processing 17-4 PH stainless, while regional tool-grind centers ensure sovereign sustainment. Because funding is tied to multi-year platform life cycles, broaching capacity additions in the Gulf are largely insulated from near-term commodity swings, granting the broaching machines market a long-dated revenue stream.
Restraints Impact Analysis*
| Restraint | % Impact on CAGR Forecast | Geographic Relevance | Impact Timeline |
|---|---|---|---|
| Shortage of Broach-Skilled Toolmakers in EU & U.S. | -0.7% | Europe & North America | Long term (≥ 4 years) |
| Volatile Tungsten-Carbide Pricing Disrupting Broach Tool Supply | -0.4% | Global | Short term (≤ 2 years) |
| Cap-Ex Freeze at Oil-field Service Firms (2024-25) | -0.3% | Global, concentrated in North America & Middle East | Short term (≤ 2 years) |
| Import Tariffs on Japanese CNC Systems in India | -0.2% | India, with spillover effects in South Asia | Medium term (2-4 years) |
| Source: Mordor Intelligence | |||
Shortage of Broach-Skilled Toolmakers in EU & U.S.
The manufacturing sector forecasts 2.1 million unfilled roles by 2030 as senior machinists retire[2]European Labour Authority, “Annual Report on Labour Shortages 2024,” ELA, ela.europa.eu. Broach-tool design demands expertise in rake-angle sequencing and shear-zone heat management, skills rarely covered in standard CNC curricula. Finland’s Tampere region reports machinist graduation rates at half replacement demand, mirroring shortages across Germany and the United States. Factories hesitate to install new broaching lines until apprenticeship pipelines improve. Vendors respond with mixed-reality simulators and cloud-based application support, yet the talent gap persists as a structural cap on throughput, limiting upside for the broaching machines market.
Volatile Tungsten-Carbide Pricing Disrupting Broach Tool Supply
China supplies more than 80% of global tungsten concentrate, exposing toolmakers to quarterly price swings above 20%. High-grade carbide billets account for up to 45% of broach tool cost, so a 15% price spike can neutralize maintenance budgets at mid-sized plants[3]U.S. Geological Survey, “Mineral Commodity Summary: Tungsten 2025,” USGS, usgs.gov. Geopolitical uncertainty and export quota adjustments complicate long-term procurement, while alternative cermet solutions lack wear resistance in high-load broach operations. Some aerospace primes now manage vendor-held stock to buffer shocks, but uneven surcharge pass-through still compresses margins, dampening capital expansion in the broaching machines market.
*Our forecasts treat driver/restraint impacts as directional, not additive. The impact forecasts reflect baseline growth, mix effects, and variable interactions.
Segment Analysis
By Product Type: Horizontal Machines Retain Scale Leadership
Horizontal models generated 44.72% of 2025 revenue, reflecting their dominance in drive-shaft and heavy-equipment lines where components exceed 1 m length. Built on cast-iron bases, modern units integrate dual-servo hydraulic drives that boost push forces to 300 kN without chatter. Surface broach systems, though smaller in unit shipments, post the fastest 6.46% CAGR as aerospace and orthopedic applications require fir-tree and bone-plate contours unachievable with grinding. The broaching machines market size for surface platforms is projected to climb from USD 223.7 million in 2026 to USD 306.1 million by 2031.Rotary-table attachments expand reach into high-mix gearbox shops. Mounted on standard CNC centers, they cut 10 times faster than milling while holding ±0.0005 inches. Quick-change guide packs enable programed switch-over in under 3 minutes, attractive for batch sizes below 200 pieces. The broaching machines industry continues to evolve toward hybrid vertical-horizontal frames that swap out heads for shaping or slotting, delivering a flexible cell capable of three distinct cutting processes without repositioning, thereby deepening equipment utilization.


By Operation Mode: Semi-Automatic Dominance Meets Rapid Automation
Semi-automatic systems accounted for 52.98% revenue in 2025, combining manual fixture loading with automated stroke cycles that suit moderate volumes. Plants appreciate the operator’s ability to intervene on first-article setup and unusual alloys, yet chronic absenteeism pushes management toward lights-out solutions. Fully automatic lines, forecast to grow at 7.12% CAGR, integrate robot loaders, barcode traceability, and adaptive tool-wear compensation, raising overall equipment effectiveness by 28% on medical-device pilot runs. The broaching machines market size for full-automation platforms is expected to rise from USD 428.6 million in 2026 to USD 604.8 million in 2031.Digital-twin models simulate force loads across the stroke, flagging thermal drift beyond 1 micron in real time. Predictive-maintenance modules schedule tool changes using vibration signatures, extending stick life by 15%. Though upfront investment is 35% higher than semi-automatic counterparts, labor savings and higher first-pass yield shorten payback to 2.8 years, accelerating adoption. The broaching machines industry now offers subscription models bundling equipment, software, and tool re-conditioning, transforming capex hurdles into opex commitments.
By End-user Industry: Automotive Volume Meets Medical Velocity
The automotive sector contributed 39.35% of 2025 revenue as multi-speed transmissions, differential gears, and electric-drive splines rely on broach finishes for spiroid and involute profiles. Hybrid-power-train adoption requires tighter stack-up tolerances, locking in baseline demand. At 6.85% CAGR, medical devices form the fastest-growing end-use, stimulated by FDA quality-system regulations that enforce full process validation and traceability. Orthopedic implants and surgical instruments demand burr-free internal slots and chamfers that broaching can deliver in a single pass.Aerospace and defense segments register steady growth as landing-gear trunnions, engine-mount brackets, and missile fins all feature complex internal pockets unsuitable for end-milling. Oil and gas stays subdued amid capital-discipline policies, yet valve manufacturers still specify broach lines for non-circular seat geometry. Electronics and precision components gain traction as 5G infrastructure and semiconductor-tooling parts move toward sub-100-micron features, broadening the broaching machines market across high-tech verticals.
Geography Analysis
Asia-Pacific retained 55.22% global share in 2025, buoyed by China’s 25% equipment-investment growth target through 2027. Chinese OEMs integrate broach lines into intelligent-manufacturing cells under the “Made in China 2025” strategy, while Japan upgrades long-stroke machines for precision machinery exports. South Korea and ASEAN nations invest in semiconductor and automotive supply chains, spurring incremental demand. India contributes fresh orders via defense-offset gear-train plants, though import tariffs on Japanese CNC systems raise cost hurdles.
North America is projected to post the fastest 6.94% CAGR to 2031 as US air-frame build-rates rebound and defense programs expand. Reshoring policies funnel grants toward small machine shops that add broaching to shorten component lead times. Canada benefits from Pratt & Whitney turbofan offsets and mining-truck component demand, while Mexico’s Bajío corridor hosts new propulsion and aerospace machining centers. The broaching machines market size for North America is estimated to climb from USD 185.7 million in 2026 to USD 259.8 million in 2031.
Europe maintains stable growth as Germany’s automotive supply chain refreshes horizontal broach capacity, and the United Kingdom accelerates aerospace tooling upgrades. France and Italy renew equipment under energy-efficiency tax credits, and Nordic plants leverage automation to offset labor scarcity. Skilled-worker shortages remain a limiting factor, with 367 occupations flagged as in deficit across the EU in 2024. Nonetheless, vendor managed-services and virtual training mitigate bottlenecks, sustaining a modest yet predictable expansion of the broaching machines market.

Competitive Landscape
The market shows moderate concentration. Mitsubishi Heavy Industries reported FY 2024 revenue of JPY 5,027.1 billion, a 7.9% year-on-year increase, with 35.6% business-profit growth attributed to precision-manufacturing and smart-factory projects. Top players differentiate through servo-hydraulic drives that cut cycle times by 15%, integrated tool-life analytics, and cloud dashboards that visualize real-time overall equipment effectiveness.
Strategic playbooks emphasize vertical integration and recurring-revenue models. Several OEMs now market equipment-as-a-service contracts bundling machines, software, and scheduled tool re-sharpening. Patent filings highlight adaptive clamping, edge-force monitoring, and machine-learning driven parameter optimization. Rotary broach attachments for CNC centers represent a white-space that disruptors exploit, offering lower entry cost for job shops that cannot justify standalone machines.
Service networks form a critical moat. Established providers operate tool-re-conditioning hubs within 48 hours’ reach of major aerospace and automotive clusters. Remote diagnostics cut on-site callouts by 60%, boosting uptime and reinforcing vendor loyalty. Market consolidation is probable as global suppliers acquire regional tool-sharpening firms to secure consumables flow. Together, these moves sustain a balanced yet competitive environment within the broaching machines market.
Broaching Machine Industry Leaders
American Broach & Machine Co
Axisco Precision Machinery Co., Ltd
Forst Technologie GmbH & Co. KG
Nachi-Fujikoshi Corp
Mitsubishi Heavy Industries, Ltd
- *Disclaimer: Major Players sorted in no particular order

Recent Industry Developments
- May 2025: Mitsubishi Heavy Industries recorded record FY 2024 results with revenue rising to JPY 5,027.1 billion and issued FY 2025 guidance targeting JPY 5.4 trillion.
- March 2025: FANUC America opened a USD 110 million robotics and automation campus in Michigan, adding capacity for 6,000 quick-delivery robots and 400 jobs.
- February 2025: Mitsubishi Heavy Industries honored 21 products under its “Best Innovation 2024” program, including advanced broaching solutions for aircraft-maintenance training.
- January 2025: SLB announced Q4 revenue of USD 9.28 billion and planned USD 2.3 billion capital investment for 2025, indicating sustained tooling demand in oil and gas equipment.


Research Methodology Framework and Report Scope
Market Definitions and Key Coverage
Our study defines the broaching machines market as all newly manufactured equipment, vertical, horizontal, surface, continuous, and specialized units, designed to remove material by linearly pushing or pulling a multi-tooth broach through metal or advanced composites in production environments. We measure value in USD at the point of original sale, excluding maintenance contracts and used equipment resales.
(Exclusion) Second-hand machines, tooling accessories, and standalone broaches are outside this study's scope.
Segmentation Overview
- By Product Type
- Vertical Broaching Machines
- Horizontal Broaching Machines
- Surface Broaching Machines
- Others (Rotary, CNC Broaching, Hydraulic Broaching Machines)
- By Operation Mode
- Manual
- Semi-Automatic
- Fully Automatic
- By End-user Industry
- Automotive
- Fabrication & Industrial Machinery
- Aerospace & Defense
- Oil & Gas / Energy
- Construction Equipment
- Electronics & Precision Components
- Medical Devices
- Others (Agricultural Equipment, Firearms & Defense, etc.)
- By Geography
- North America
- United States
- Canada
- Mexico
- South America
- Brazil
- Argentina
- Peru
- Rest of South America
- Europe
- United Kingdom
- Germany
- France
- Italy
- Spain
- BENELUX (Belgium, Netherlands, and Luxembourg)
- NORDICS (Denmark, Finland, Iceland, Norway, and Sweden)
- Rest of Europe
- Asia-Pacific
- China
- India
- Japan
- Australia
- South Korea
- ASEAN (Indonesia, Thailand, Philippines, Malaysia, Vietnam)
- Rest of Asia-Pacific
- Middle East and Africa
- Saudi Arabia
- United Arab Emirates
- Qatar
- Kuwait
- Turkey
- Egypt
- South Africa
- Nigeria
- Rest of Middle East and Africa
- North America
Detailed Research Methodology and Data Validation
Primary Research
Mordor analysts spoke with machine OEM engineers, tier-1 automotive purchasers, aerospace machining supervisors, and Southeast Asian distributors to validate cycle-time assumptions, average selling prices, and adoption hurdles. Interviews spanned North America, Europe, China, India, and Brazil, helping us bridge data gaps on installation counts and automation add-on rates.
Desk Research
We began with trade statistics and industrial machinery production datasets from UN Comtrade, Eurostat PRODCOM, and the U.S. Census Current Industrial Reports, which outline cross-border flows and factory shipments. Sectoral demand cues were gathered from sources such as the International Organization of Motor Vehicle Manufacturers, the Civil Aviation Administration databases, and national purchasing managers' indexes that signal capital goods spending patterns. Company 10-Ks, investor decks, and reputable business press helped us map revenue splits, while subscription files from D&B Hoovers and Dow Jones Factiva enriched competitor financials and news flow. These sources illustrate intent only; numerous additional publications supported granular checks.
A second pass tapped trade associations, Germany's VDMA, Japan Machine Tool Builders' Association, and the Precision Machined Products Association, for capacity utilizations and shipment pricing ranges, then corroborated findings against patent trends on Questel to sense technology diffusion.
Market-Sizing & Forecasting
A top-down construct converts production plus net-import volumes into potential machine demand, which is then cross-checked through sampled ASP × new installations by product type. Key variables like global light-vehicle output, commercial aircraft deliveries, fabrication capacity additions, average plant capex per CNC center, and PMI trends drive the model. Multivariate regression projects each variable through 2030; where bottom-up samples lag, interpolation uses nearest peer benchmarks.
Data Validation & Update Cycle
Outputs undergo variance tests versus historical growth corridors, peer ratios, and macro indicators. Senior reviewers sign off only after anomalies are resolved; we refresh figures annually and revisit sooner if policy shifts or large M&A events alter baselines.
Why Mordor's Broaching Machines Baseline Earns Trust
Published figures often diverge because studies pick different machine classes, mix new and refurbished sales, or apply one-size pricing curves. We disclose assumptions, refresh every year, and anchor values to verifiable shipment and ASP data, which gives decision-makers a steady compass.
Key gap drivers include scope inflation that folds broaching tools into machine revenue, aggressive roll-ups of small retrofit jobs as 'new sales,' and undisclosed currency conversions.
Benchmark comparison
| Market Size | Anonymized source | Primary gap driver |
|---|---|---|
| USD 1.08 B (2025) | Mordor Intelligence | - |
| USD 1.62 B (2024) | Global Consultancy A | Includes broaches and refurbishment services |
| USD 0.95 B (2024) | Trade Journal B | Uses list prices without regional ASP weighting |
| USD 0.47 B (2024) | Industry Analytics C | Omits Asia-Pacific installations below 5 tons capacity |
The comparison shows that when scope and pricing filters differ, values swing widely; Mordor's disciplined variable selection, paired with continuous source vetting, delivers the balanced, reproducible baseline clients rely on.


Key Questions Answered in the Report
What is the current size of the broaching machines market?
The broaching machines market was valued at USD 1.13 billion in 2026 and is forecast to grow to USD 1.42 billion by 2031.
Which region leads the broaching machines market?
Asia-Pacific holds the largest regional share at 55.22% of 2025 revenue, driven by substantial equipment-upgrade programs across China, Japan, and emerging ASEAN manufacturing hubs.
What factors are driving demand for broaching machines in electric-vehicle manufacturing?
EV gearboxes require sub-micron accuracy, internal splines, and keyways that broaching delivers more efficiently than milling, spurring investments in advanced broach cells.
How does the labor shortage affect the broaching machines market?
A shortage of skilled toolmakers, especially in Europe and North America, slows new-equipment adoption and pushes manufacturers toward higher automation and remote-support solutions.
Page last updated on:


