
Market Overview
| Study Period | 2021 - 2031 |
|---|---|
| Forecast Data Period | 2026 - 2031 |
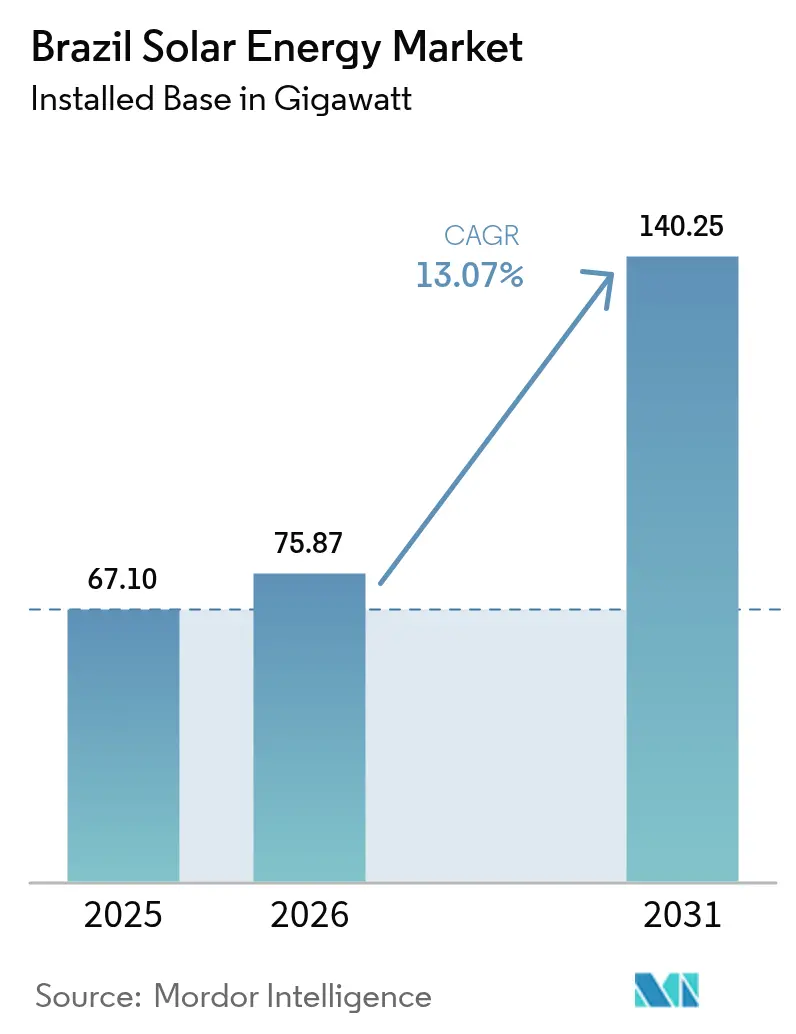
| Base Year Market Size (2025) | 67.10 gigawatt |
| Market Volume (2026) | 75.87 gigawatt |
| Market Volume (2031) | 140.25 gigawatt |
| Growth Rate (2026 - 2031) | 13.07 % |
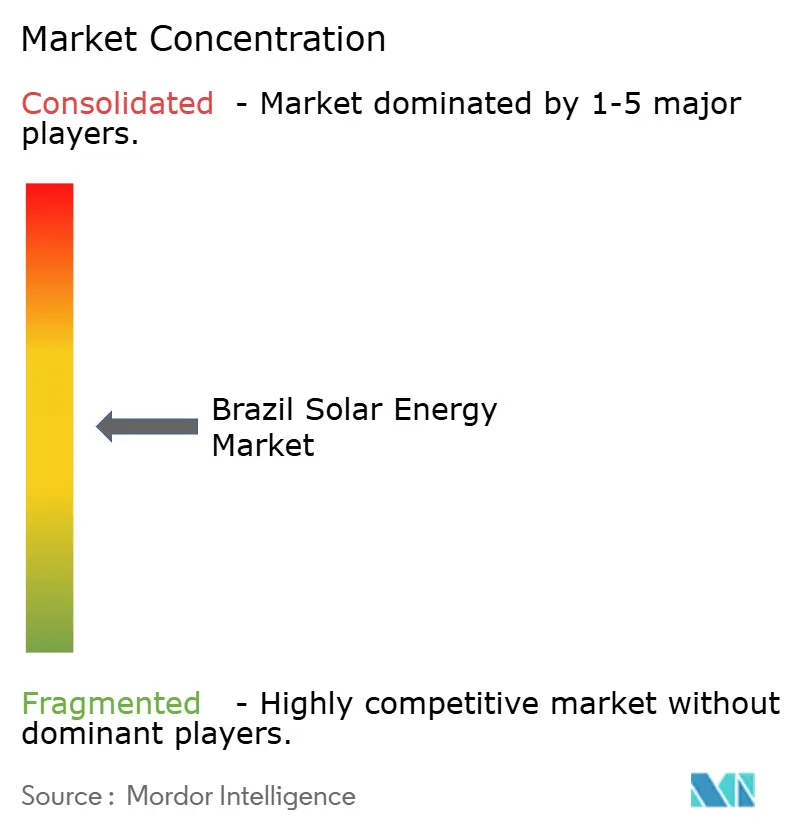
| Market Concentration | Medium |
Major Players *Disclaimer: Major Players sorted in no particular order Image © Mordor Intelligence. Reuse requires attribution under CC BY 4.0. | |
Brazil Solar Energy Market Analysis by Mordor Intelligence
The Brazil Solar Energy Market size in terms of installed base was valued at 67.10 gigawatt in 2025 and estimated to grow from 75.87 gigawatt in 2026 to reach 140.25 gigawatt by 2031, at a CAGR of 13.07% during the forecast period (2026-2031).
Robust federal incentives, declining equipment costs, and a surge in corporate power-purchase agreements are accelerating deployment as energy-intensive industries lock in long-term clean power. Planned green-hydrogen hubs along the Northeast coast could add 25–30 GW of additional photovoltaic demand, reinforcing Brazil’s position as Latin America’s largest solar producer. Utility-scale projects still dominate installed capacity, yet distributed generation is growing faster as the residential, commercial, and industrial segments seize the tariff certainty created by Federal Law 14.300.[1]Agência Nacional de Energia Elétrica, “Dados de Geração Distribuída,” aneel.gov.br Transmission upgrades, battery-storage hybrids, and dual-use agrivoltaic solutions are emerging to mitigate grid congestion, shorten interconnection queues, and preserve high-value agricultural land.
Key Report Takeaways
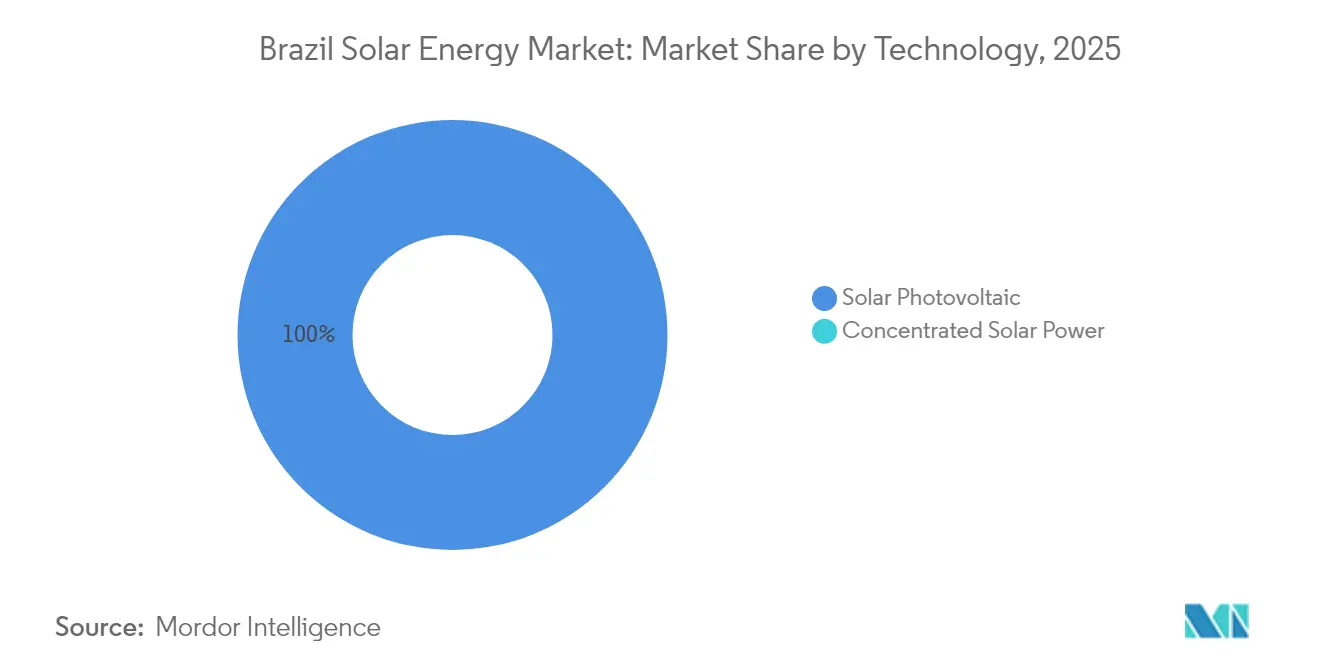
- By technology, photovoltaic systems retained a 100.00% revenue share in 2025, while concentrated solar power remained absent from the Brazil solar energy market.
- By grid type, on-grid projects held 92.15% of installed capacity in 2025; off-grid systems are forecast to expand at a 17.12% CAGR through 2031.
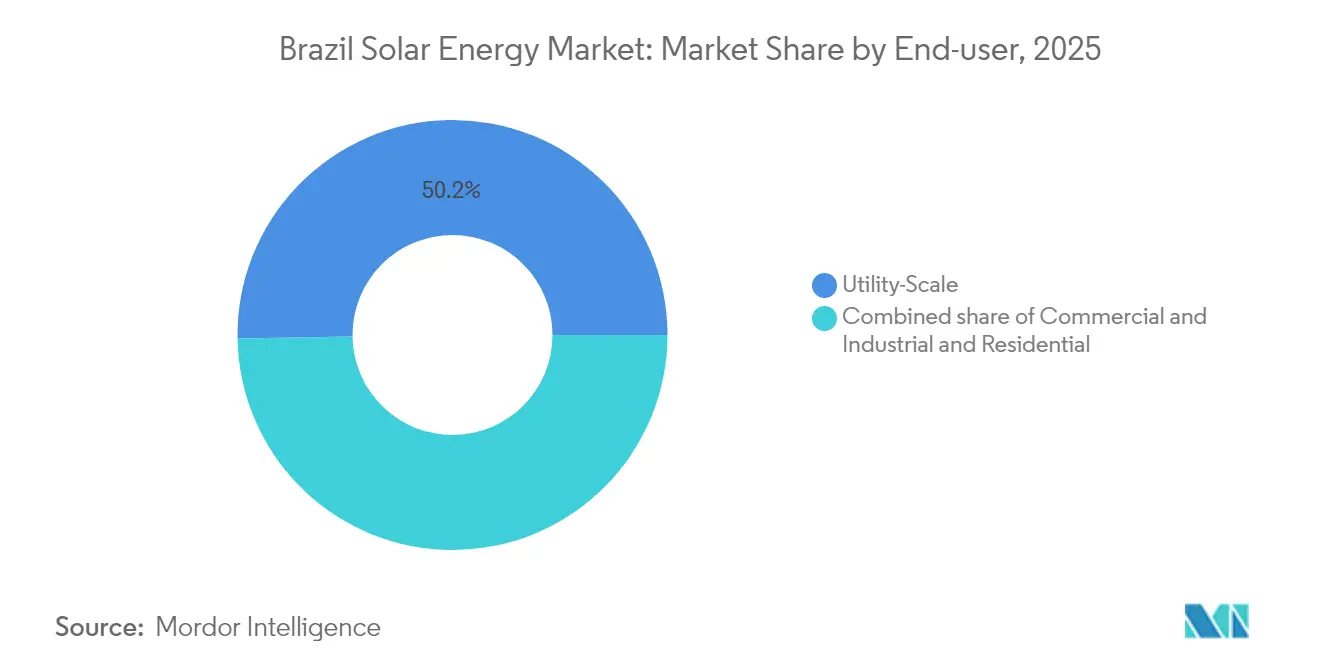
- By end user, utility-scale sites commanded 50.25% of the Brazil solar energy market share in 2025, while the commercial-and-industrial segment is advancing at a 16.42% CAGR to 2031.
- The top five developers collectively controlled about 40% of installed utility-scale capacity in 2024, highlighting a moderately consolidated competitive field.
Note: Market size and forecast figures in this report are generated using Mordor Intelligence’s proprietary estimation framework, updated with the latest available data and insights as of 2026.
Brazil Solar Energy Market Trends and Insights
Drivers Impact Analysis*
| Driver | (~) % Impact on CAGR Forecast | Geographic Relevance | Impact Timeline |
|---|---|---|---|
| Federal Lei 14.300 incentives for distributed generation | +2.8% | National; strongest in Southeast and South | Medium term (2–4 years) |
| Declining PV module and balance-of-system costs | +2.1% | National | Short term (≤ 2 years) |
| Corporate clean-PPA boom from energy-intensive industries | +1.9% | Southeast, South | Medium term (2–4 years) |
| Agrivoltaics uptake in Brazil’s semi-arid Northeast | +0.7% | Bahia, Pernambuco, Rio Grande do Norte | Long term (≥ 4 years) |
| Planned green-hydrogen hubs creating extra solar demand | +1.5% | Ceará, Pernambuco, Rio de Janeiro | Long term (≥ 4 years) |
| Battery-storage integration enabling firm capacity | +1.2% | National | Medium term (2–4 years) |
| Source: Mordor Intelligence | |||
Federal “Lei 14.300” incentives for distributed generation
Lei 14.300 preserves one-to-one net-metering for projects connected before 6 January 2023, giving legacy systems a protected cash-flow through 2046.[2]Portal Solar, “Entenda a Lei 14.300,” portal-solar.com.br That security spurred a surge of pre-deadline installations and cemented distributed generation as the economic backbone of the Brazil solar energy market. Developers now retool business plans around declining compensation, adding battery storage and energy-efficiency services to protect returns. ANEEL’s 45% Fio B reduction starting in 2025 raises cost heterogeneity across 63 concession areas, triggering regional price competition among installers. The regulation therefore drives technological innovation while locking in a sizeable early-mover advantage for incumbents.
Declining PV module & BOS costs
Excess global manufacturing capacity forced ex-factory module prices below USD 0.15/W in late-2024, yet Brazil faces a counter-force after tariffs climbed from 9.6% to 25% in November 2024. Developers that secured duty-free inventory enjoy a temporary cost edge of USD 0.03–0.05/W. Simultaneously, Arctech opened a 3 GW tracker plant in Bahia, anchoring local BOS supply and reducing logistics expenses taiyangnews.info. Inverter prices stabilize as new arc-fault safety mandates push suppliers to launch upgraded units, while mounting-structure costs fall thanks to domestic steel output. Net savings continue to lower the levelized cost of electricity, broadening the addressable demand for the Brazil solar energy market.
Corporate clean-PPA boom from energy-intensive industries
Heavy industries account for 40% of Brazil’s power demand, and their decarbonization agenda underpins a record pipeline of long-term solar PPAs. ArcelorMittal allocated USD 290 million to two dedicated plants to secure stable, low-carbon power. Atlas Renewable Energy inked a 315 MW contract with a domestic steelmaker, while Votorantim Cimentos signed multi-site deals that run beyond 15 years. These agreements unlock cheaper capital, lift average project scale, and concentrate utility-scale growth along industrial corridors. Higher regional clustering, however, creates grid-absorption risks that developers mitigate through co-located batteries and flexible offtake clauses.
Agrivoltaics uptake in Brazil’s semi-arid Northeast
Dual-use solar farms cut crop water demand by up to 30% and boost farmer income, turning Ceará’s semi-arid interior into a test bed for agrivoltaics. Shade-tolerant vegetables now thrive beneath bifacial panels that generate 1,500 kWh/m²/year. Floating PV over irrigation reservoirs reduces evaporation and can supply 2.3–12 TWh annually across Northeast dams. Development banks bundle concessional loans with rural-development grants, making agrivoltaics a cornerstone of climate adaptation policy and a long-run driver for the Brazil solar energy market.
Restraints Impact Analysis*
| Restraint | % Impact on CAGR Forecast | Geographic Relevance | Impact Timeline |
|---|---|---|---|
| Transmission bottlenecks in Northeast–Southeast link | -1.80% | Bahia, Piauí → São Paulo | Short term (≤ 2 years) |
| High domestic interest rates raising WACC | -1.40% | National | Short term (≤ 2 years) |
| Possible import tariffs on Asian PV modules | -1.10% | National | Medium term (2–4 years) |
| Land-use conflicts with irrigated agriculture | -0.60% | São Francisco Valley, Minas Gerais | Medium term (2–4 years) |
| Source: Mordor Intelligence | |||
Transmission bottlenecks in Northeast–Southeast interconnection
The Northeast exports surplus daytime power through corridors that already operate near design limits, forcing ONS to curtail several solar parks during clear-sky peaks.[3]Reuters, “Brazil grid bottlenecks challenge renewable boom,” reuters.com Fitch Ratings warns that curtailment risk now influences credit spreads for merchant generators. USD 9.5 billion of transmission upgrades are authorised, yet licensing, land acquisition, and indigenous consultations add up to seven years, outpacing the three-year build cycle of new PV plants. Developers hedge revenue through split-site PPAs and battery hybrids, but persistent congestion still trims the Brazil solar energy market growth trajectory.
High domestic interest rates raising WACC for projects
SELIC may touch 14.75% in mid-2025, pushing all-in solar project WACC above 11% and cutting internal rates of return by 200 basis points. BNDES soft-loans cushion large sponsors, yet smaller distributed-generation installers rely on costly commercial credit that narrows profit margins. International sponsors exploit dollar-linked financing to arbitrage local rates, reinforcing consolidation and slowing community-owned schemes. Elevated rates, therefore moderate, but do not derail the long-term expansion of the Brazil solar energy market.
*Our forecasts treat driver/restraint impacts as directional, not additive. The impact forecasts reflect baseline growth, mix effects, and variable interactions.
Segment Analysis
By Technology: Photovoltaic Dominance Solidified by Costs and Storage Synergies
Photovoltaic systems held 100.00% of installed capacity in 2025, and the segment is forecast to expand at a 13.07% CAGR through 2031, cementing its lock on the Brazil solar energy market. Tracker-mounted, bifacial modules captured 65% of 2024 additions, lifting capacity factors to 26–28% in Bahia compared with 22–24% for fixed-tilt arrays. Utility developers favor these designs because they squeeze more energy from the same grid-connection quota, a critical edge where transmission is scarce. CSP remains absent: its capital intensity and need for thermal storage peg levelized costs near USD 100 per MWh, well above lithium-ion-backed photovoltaics. Battery prices below USD 120 per kWh now allow four-hour storage to firm solar output for evening peaks at a lower cost than dispatchable CSP, closing the technology’s potential niche.
Hybrid models deepen photovoltaics’ moat. Enel’s 133 MW solar-plus-battery site illustrates how firm-capacity payments and energy-arbitrage revenues converge, creating a template for 5 GW of similar projects that developers intend to bid into capacity auctions by 2028. As ANEEL finalizes rules crediting storage duration, photovoltaic projects will increasingly pair with batteries, locking in additional earnings streams and pushing any prospective CSP entrants further out of the money.



By Grid Type: Off-Grid Mini-Grids Race Ahead Under Luz para Todos
On-grid facilities delivered 92.15% of national capacity in 2025, yet off-grid mini-grids are growing fastest, at a 17.12% CAGR, energized by Brazil’s effort to electrify remote Amazon communities. The Luz para Todos program re-launched in 2024 with a BRL 2.5 billion budget to connect 100,000 households by 2027, deploying 10–50 kW arrays paired with 20–100 kWh lithium-iron-phosphate batteries. Extending transmission through rainforest terrain costs up to USD 50,000 per km, making stand-alone solar cheaper for villages under 500 homes. The Brazil solar energy market size for off-grid systems reached 48.6 MW in 2025 and will surpass 162 MW by 2028 under signed funding commitments.
On-grid growth continues in absolute terms: 5.6 GW of utility-scale projects came online in 2024, clustered along Bahia’s solar belt, while distributed generators added 8.5 GW of rooftop capacity under Lei 14.300. However, grid-connected projects face margins squeezed by falling auction prices and curtailment in the Northeast–Southeast corridor, prompting more co-located industrial offtake and storage hybrids. Off-grid deployments, though small in absolute capacity, unlock quality-of-life gains and create new equipment markets for robust, tropicalized systems, drawing concessional finance from the IFC and other multilaterals.
By End User: C&I Segment Surges on PPA Economics
Utility-scale plants held 50.25% of installed capacity in 2025, yet the commercial-and-industrial segment is set to expand 16.42% annually, outpacing utility-scale’s 12.45% and residential’s 13.95% growth trajectories. Corporate PPAs priced at BRL 110–130 per MWh unlock predictable cash flows that satisfy lenders even without auction-style contracts, making C&I the brightest pocket of the Brazil solar energy market. Distributed systems sized between 500 kW and 5 MW deliver paybacks within five years in São Paulo, where tariffs hover near BRL 0.90 per kWh.
Auction-linked utility-scale margins continue to tighten, with 2024 bids 12% below prior-year clearing prices. Curtailment and high domestic interest rates further erode returns, driving some developers to pivot assets toward bilateral C&I sales. Residential growth, concentrated in the Southeast, benefits from grandfathered net-metering rules but is constrained by rooftop suitability and household affordability. The Brazil solar energy market size attached to the C&I segment is projected to reach 52.7 GW by 2031, eclipsing utility-scale additions for the first time, provided transmission bottlenecks and financing costs remain manageable.
Geography Analysis
Minas Gerais leads state-level installations with 15.6 GW operating by March 2025, buoyed by a favourable ICMS tax exemption and streamlined environmental licensing. Its mining complexes adopt captive solar to meet ESG targets and displace grid energy priced above USD 0.13/kWh during dry-season peaks. The state’s distribution grid accommodates high penetration, allowing surplus flows into neighbouring Rio de Janeiro, thereby reinforcing regional electricity security. São Paulo follows with 11.4 GW, where commercial rooftops line the industrial belt stretching from Guarulhos to Campinas. Here, multitenant buildings deploy virtual net-metering to allocate generation across multiple tax IDs.
Rio Grande do Sul gathers momentum through agrivoltaic orchards that overlay grape trellises, merging agro-exports with green-power certificates. State incentives offer 50% reductions in environmental-licence fees for dual-use systems, tipping the economics in farmers’ favour. The Brazil solar energy market further benefits from the state’s shallow-sloped terrain, easing tracker installation. Conversely, Paraná remains under-represented due to stricter grid connection queues that limit distributed generation beyond 3 MW feeders.
The Northeast hosts 60% of the national utility-scale pipeline owing to world-class irradiation. Ceará attracts mega-projects tied to green-hydrogen exports at Pecém Port, catalysing new transmission corridors and industrial parks. Bahia’s Camaçari cluster emerges as an equipment-manufacturing hub, home to the 3 GW tracker plant and multiple module-glass ventures. Still, bottlenecks on the Northeast–Southeast intertie create curtailment risk that could shave 3% off annual revenues until reinforcements come online after 2027. Despite the constraint, superior resource quality sustains the long-term allure of the Brazil solar energy market, provided transmission keeps pace with generation.
Regulatory Landscape
Brazil’s solar sector is governed by a mix of distributed-generation (DG) rules and utility-scale authorization requirements under ANEEL. Law 14.300/2022 established the legal framework for micro- and mini-distributed generation and the Electric Energy Compensation System (SCEE), defining how DG units offset consumption on the grid and creating long-dated tariff certainty for qualifying systems connected within the law’s transition rules. For centralized photovoltaic plants, ANEEL’s permitting and oversight relies on formal grant instruments (such as a Despacho de Registro de Outorga, DRO, or an authorization, depending on plant size and modality), and the registration and authorization process is aligned with ANEEL’s normative framework for generation projects.
For utility-scale UFV projects above 5,000 kW, the regulatory requirements are structured under ANEEL Normative Resolution No. 1.071 of August 29, 2023, which sets the procedural and compliance expectations applied to photovoltaic generation assets. At the planning level, the Ministry of Mines and Energy (MME) approved the Plano Decenal de Expansao de Energia (PDE) 2034 through Ordinance No. 831 on April 9, 2025, which anchors Brazil’s medium-term expansion priorities for the power sector and shapes the pipeline environment where solar competes for transmission access and project approvals.
Competitive Landscape
The Brazil solar energy market is moderately concentrated, with the top five utility-scale owners controlling close to 45% of operational capacity. ENGIE completed a R$3.24 billion acquisition of five Atlas plants totalling 545 MWac across Bahia, Ceará, and Minas Gerais, bolstering its platform to 2.4 GW.[4]ENGIE Brasil, “ENGIE concludes Atlas solar acquisition,” engie.com.br Brookfield injected R$1.2 billion into the Elera Janaúba expansion, underscoring the appetite for scale and high-quality irradiation in Minas Gerais. Enel earmarked USD 1.2 billion for grid modernisation and new renewable projects in Ceará through 2027, blending generation with distribution upgrades.
Technology providers pursue vertical integration to defend margins. Nextracker grew domestic market share to 38% by aligning with steel suppliers and launching an Electrical Balance-of-System unit via a USD 78 million Bentek acquisition. WEG committed R$500 million to transformer capacity and bought an energy-storage integrator, signalling a pivot into complete renewable packages. Module makers weigh local fabs but hesitate until stable demand matches a 2-GW annual economic scale. Fintech newcomers such as SolFácil provide BNPL rooftop loans, capturing the long tail of residential demand.
Strategic differentiation increasingly rests on hybridisation, digital O&M, and merchant-risk management. International IPPs adopt currency swaps and inflation-indexed PPAs, while domestic utilities layer ancillary-service revenues on top of energy sales. As consolidation intensifies, the Brazil solar energy market rewards players with multi-disciplinary talent pools that span real-estate acquisition, environmental permitting, structured finance, and AI-enabled asset-management systems.
Brazil Solar Energy Industry Leaders
Enel Green Power Brasil
Elera Renováveis (Brookfield)
Atlas Renewable Energy
Canadian Solar Inc.
Engie Brasil Energia
- *Disclaimer: Major Players sorted in no particular order

Market Opportunities and Future Outlook
Near-term whitespace is concentrated in bankable capacity that can secure grid delivery and in applications that reduce exposure to curtailment in congested corridors. Official capacity statistics indicate continued scale: EPE’s early-2026 snapshot reported 64.8 GW of solar PV in Brazil (44.7 GW distributed, 20.1 GW centralized), and 16.3 GW of new solar capacity additions in 2025, supporting demand for EPC, O&M, trackers, inverters, and interconnection services across both DG and centralized segments. ANEEL’s March 2026 commercial-operation updates, with 25 solar plants totaling 1,109 MW entering operation in a single month, further highlight how quickly revenue can follow permitting and grid alignment once conditions are in place.
Utility-scale opportunities increasingly cluster around named industrial offtakers and large operating complexes, while DG opportunities tend to be packaged around compliance, financing, and system performance. ENGIE Brasil bringing the Assu Sol Photovoltaic Complex (895 MWp / 753 MWac) to full commercial operation in February 2026 signals ongoing appetite for very large-scale assets in high-irradiance states when transmission and contracting are secured. At the same time, the Mercado Livre de Energia (ACL) continues to support financing structures for large projects through long-term offtake and self-production models, while DG remains anchored by the Law 14.300/2022 framework and ANEEL’s SCEE rulebook. This combination leaves room for installers and integrators to differentiate with storage-ready designs, energy management, and multi-site solutions that address regional tariff and compensation heterogeneity.
Recent Industry Developments
- June 2026: Atlas Renewable Energy (BlackRock-backed) froze about USD 1 billion of renewable investment in Brazil amid reported high curtailment levels, highlighting how grid constraints can override project economics even after development milestones are met. The move raised the bar for transmission-secured siting and reinforced the commercial case for storage, firming solutions, and contracted offtake structures that reduce exposure to congestion-driven revenue volatility.
- March 2026: Brazilian authorities revoked authorizations for 150 MW of Elera Renovaveis solar projects, tightening the link between regulatory standing and deliverability in a transmission-constrained environment. The action increased execution risk for developers holding non-operational permits and raised the premium on projects with mature interconnection positions, financing, and construction readiness.
- June 2025: Enel Brasil cancelled 333 MW of planned solar capacity (Novo Lapa 1-8) in Bahia, citing a mismatch between solar build timelines and the availability of transmission capacity. The cancellation underscored that project pipelines increasingly depend on synchronized grid reinforcement and has pushed developers toward more selective site origination, hybridization, and alternative connection strategies.


Research Methodology Framework and Report Scope
Market Definition and Coverage
For this report, the Brazil solar energy market is defined as the total installed solar photovoltaic (PV) capacity added and operating in the country, measured in gigawatts (GW) for a given year.
Scope exclusions: We do not size EPC contract value, O&M service revenue, financing, or component sales value because the market is reported in installed capacity terms.
Segmentation Overview
- By Technology
- Solar Photovoltaic (PV)
- Concentrated Solar Power (CSP)
- By Grid Type
- On-Grid
- Off-Grid
- By End-User
- Utility-Scale
- Commercial and Industrial (C&I)
- Residential
- By Component (Qualitative Analysis)
- Solar Modules/Panels
- Inverters (String, Central, Micro)
- Mounting and Tracking Systems
- Balance-of-System and Electricals
- Energy Storage and Hybrid Integration
Data Sources, Market Sizing, and Validation
Desk Research
Desk work started with public power-sector and solar deployment references so the capacity build could be grounded in official and repeatable data. Sources used include government and regulator publications such as Brazil energy planning statistics, grid and generation registries, and renewable program updates, along with international databases such as IEA, IRENA, and World Bank indicators for macro checks.
We also reviewed company annual reports, investor presentations, and reputable press releases to understand project timelines, commissioning slippage, and pipeline maturity, which then informs how quickly capacity can move from awarded to operating. Where it helped with cross-checks, paid subscriptions were used for company financials and intelligence, plus patent databases to validate technology direction and local manufacturing signals. These are illustrative sources only, and many other references were used to collect data, validate assumptions, and clarify gaps.
Primary Interviews and Surveys
Primary calls and surveys were used to check yearly commissioning expectations, typical capacity factors by region, and how policy changes affect distributed versus utility-scale additions. We spoke with a mix of developers, utilities, installers, component distributors, and industry advisors to correct assumptions from desk inputs when field reality differed, especially around timing between licensing, grid connection, and commissioning.
Distribution of primary research fieldwork respondents
| Company type | Respondent position |
|---|---|
| Top tier: 32% | CXOs: 14% |
| Mid tier: 47% | Functional/Unit leaders: 35% |
| Smaller Players: 21% | Managers: 51% |
Market-Sizing & Forecasting
Sizing was built using a top-down approach where official generation and grid-connection series are used to reconstruct the solar PV installed base each year, and then validated through selective bottom-up approximations from sampled project additions and typical MW block sizes seen in the pipeline. When project-level details were incomplete, gaps were handled by applying conservative commissioning timing and capacity class averages, which are then rechecked with interview feedback.
Inputs that matter in Brazil include annual PV capacity additions, grid connection and licensing timelines, distributed generation adoption under net metering rules, utility-scale auction activity, module price direction, and interest-rate sensitivity for project finance. Forecasting relied mainly on scenario analysis, because policy adjustments and grid constraints can shift build-out quickly, and the scenarios were tuned using what interviewees expect for permitting speed and capex progression.
Data Validation & Update Cycle
Outputs are triangulated against independent signals such as regulator capacity registries, public generation statistics, and announced commissioning schedules so the final time series stays consistent with what is physically operating. Any large year-to-year jumps are flagged, rechecked for unit consistency, and reviewed across analysts before sign-off. When interview feedback conflicts with desk indicators, follow-up outreach is used to reconcile the drivers.
The report is refreshed annually, and interim updates are made when material events occur, such as major rule changes for distributed generation or large auction outcomes. Before delivery, a final refresh pass is completed so clients receive the most current view available at that time.
Mordor Intelligence's Brazil Solar Energy Market Size Versus Other Published Estimates
Published market sizes for Brazil solar can look far apart because some studies measure installed capacity in GW, while others report revenue in USD, which naturally mixes price and volume effects. Differences also come from whether distributed generation is counted fully, how projects in construction are treated, and the base year chosen.
By checking regulator capacity registries and grid-connection milestones, Mordor Intelligence keeps the 2025 market size tied to operating PV capacity (GW) rather than mixing it with EPC or equipment value, which is a common reason estimates stated in USD move in a different direction.
Benchmark comparison
| Source | Market Size | Gaps in Research Methodology |
|---|---|---|
| Mordor Intelligence | USD 67.10 B (2025) | |
| Industry Publisher A | USD 2.49 B (2025) | Reports market value in USD and includes broader solar scope (PV plus CSP) and associated value-chain spending, so it is not comparable to a capacity-based installed GW measure. |
| Market Publisher B | USD 11.67 B (2023) | Uses a different base year and a USD valuation approach that can reflect pricing and service inclusion, and it may treat pipeline and installation activity differently than only counting operating capacity. |
Taken together, the spread is mainly explained by unit choice (GW capacity versus USD value), base-year alignment, and how distributed and utility additions are counted. Using clear boundary rules, traceable public datasets, and field checks makes the estimate easier to reproduce and safer to use for planning.


Key Questions Answered in the Report
How large is the Brazil solar energy market today?
Installed photovoltaic capacity reached 75.87 GW in 2026 and is forecast to hit 140.25 GW by 2031.
What CAGR is expected for Brazil’s solar build-out to 2031?
National photovoltaic capacity is projected to expand at a 13.07% compound annual growth rate.
Which segment is growing fastest?
Commercial-and-industrial systems are forecast to rise 16.42% per year on the back of corporate PPAs.
Where are most new utility-scale solar plants located?
Bahia, Piauí, and Rio Grande do Norte dominate utility development thanks to superior irradiance and land availability.
How are transmission constraints being addressed?
ANEEL auctioned 3 GW of new Northeast–Southeast lines set for 2028 and developers are adding batteries to time-shift output.
Could module tariffs raise project costs?
A CAMEX anti-dumping probe may impose 25–50% duties by 2026, which would lift module prices by USD 0.04–0.08 per watt and delay some projects.
Page last updated on:





