
Market Overview
| Study Period | 2021 - 2031 |
|---|---|
| Forecast Data Period | 2026 - 2031 |
| Base Year Market Size (2025) | 230.89 gigawatt |
| Market Volume (2026) | 243.36 gigawatt |
| Market Volume (2031) | 316.37 gigawatt |
| Growth Rate (2026 - 2031) | 5.40 % |
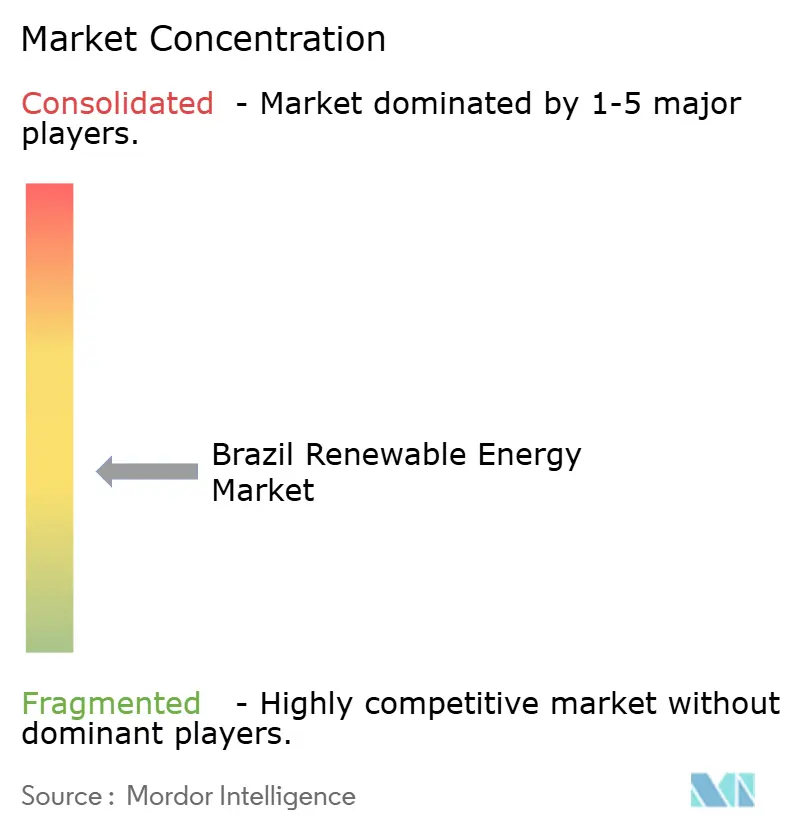
| Market Concentration | Medium |
Major Players *Disclaimer: Major Players sorted in no particular order Image © Mordor Intelligence. Reuse requires attribution under CC BY 4.0. | |
Brazil Renewable Energy Market Analysis by Mordor Intelligence
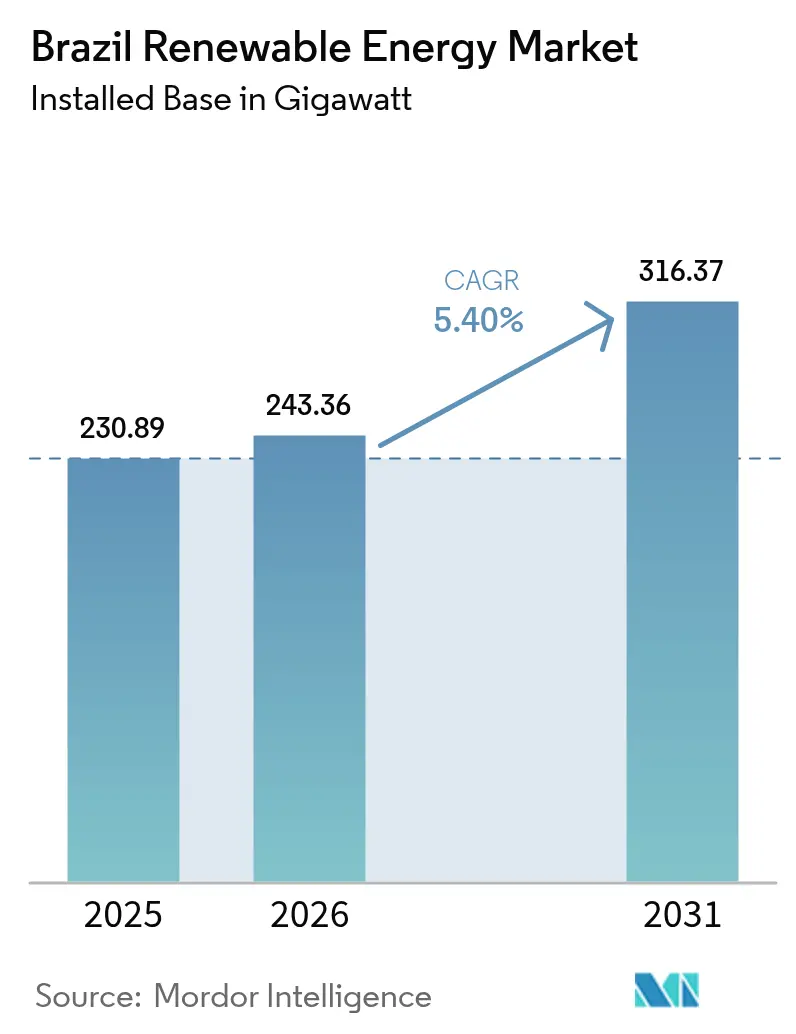
Brazil Renewable Energy Market size in 2026 is estimated at 243.36 gigawatt, growing from 2025 value of 230.89 gigawatt with 2031 projections showing 316.37 gigawatt, growing at 5.40% CAGR over 2026-2031.
At the heart of this expansion sits a well-designed auction program that anchors revenue visibility and keeps bid prices competitive. Falling technology costs strengthen project economics: global utility-scale solar averaged USD 0.044/kWh in 2023, and onshore wind settled at USD 0.033/kWh, trends mirrored in current Brazilian tenders. A grid already boasting more than 85% renewable penetration offers an advantageous springboard for further diversification into wind, solar, and nascent offshore resources. Foreign capital, particularly from European utilities and Chinese state-owned investors, continues to flow, aided by the long-term financing of the national development bank. Developers do, however, face headwinds from transmission congestion in the Northeast and protracted environmental licensing for large hydro schemes.
Key Report Takeaways
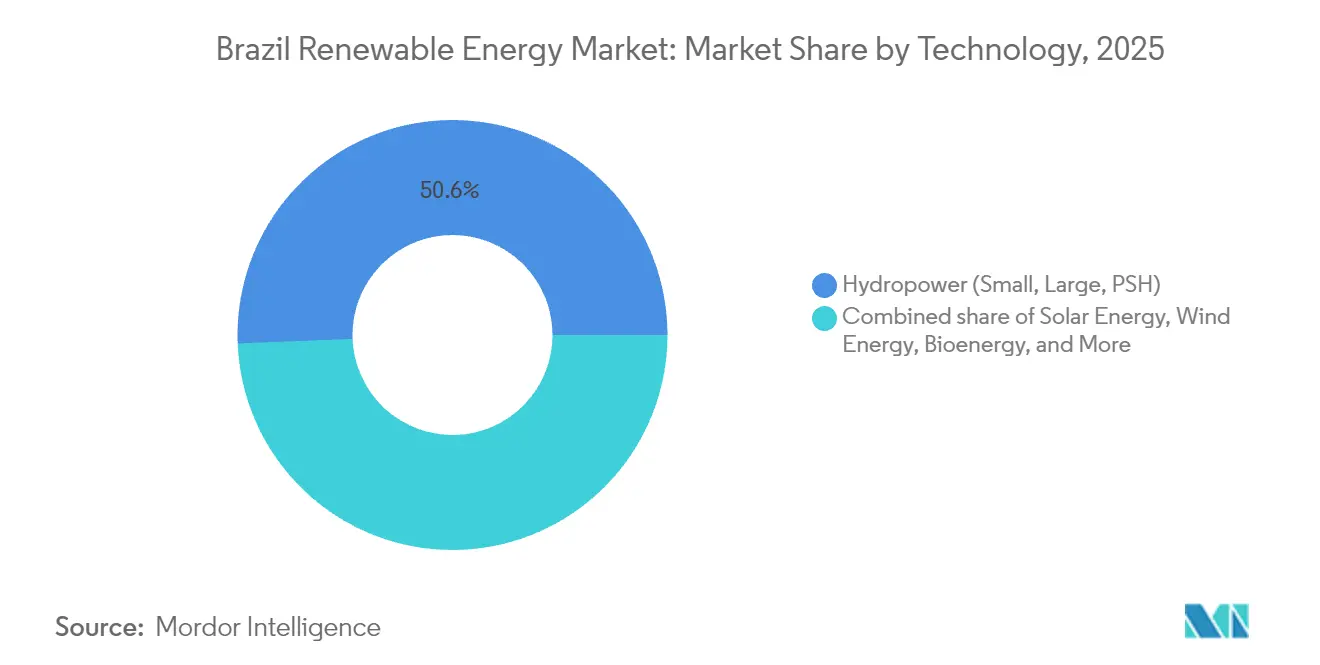
- By technology, hydropower led with 50.62% of the Brazilian renewable energy market share in 2025, while solar energy is poised to expand at a 12.97% CAGR through 2031.
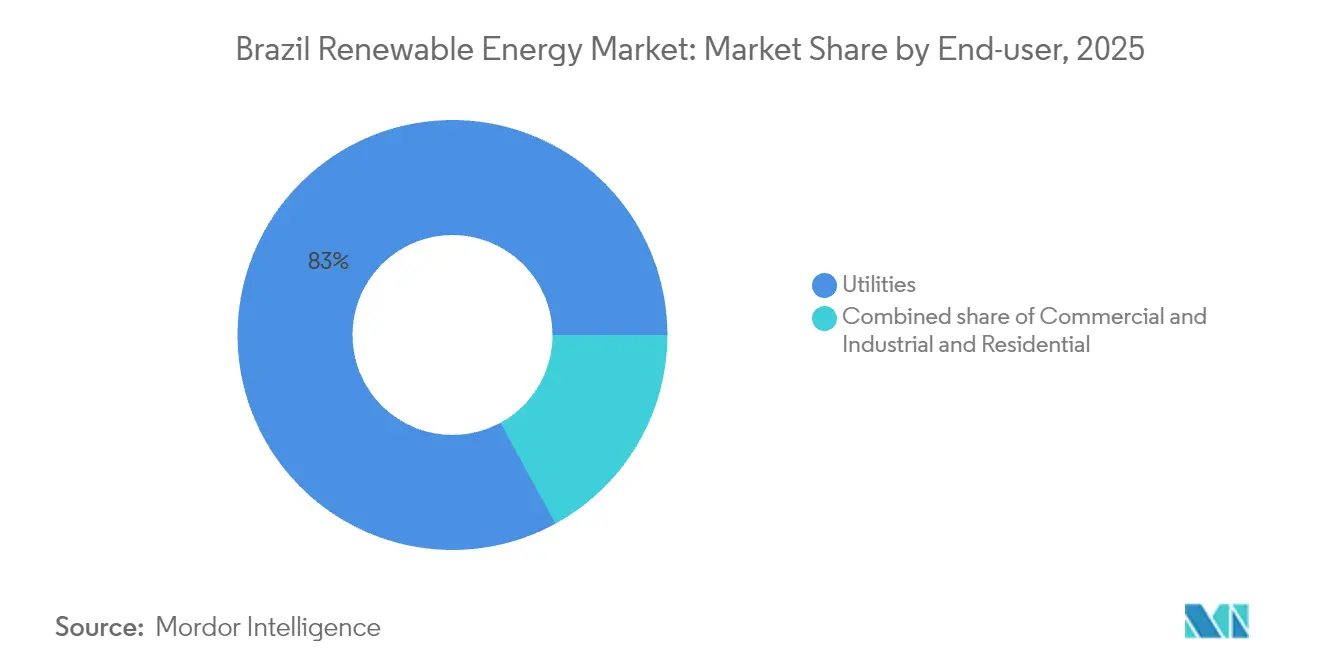
- By end-user, utilities commanded 82.95% of the Brazilian renewable energy market size in 2025, whereas the commercial and industrial segment is projected to grow at a 14.18% CAGR to 2031.
Note: Market size and forecast figures in this report are generated using Mordor Intelligence’s proprietary estimation framework, updated with the latest available data and insights as of 2026.
Brazil Renewable Energy Market Trends and Insights
Drivers Impact Analysis*
| Driver | (~) % Impact on CAGR Forecast | Geographic Relevance | Impact Timeline |
|---|---|---|---|
| Increasing investments in wind & solar generation | +1.80% | National, concentrated in Northeast (Bahia, Rio Grande do Norte, Ceará) and Southeast (São Paulo, Minas Gerais) | Medium term (2-4 years) |
| Robust federal & state auction-based procurement model | +1.50% | National, with state-level auctions in São Paulo, Minas Gerais, Bahia | Long term (≥ 4 years) |
| Declining LCOE of onshore wind & utility-scale PV | +1.20% | National, strongest impact in Northeast for wind, Southeast for solar | Medium term (2-4 years) |
| Net-metering Law 14.300/2022 spurring distributed PV | +0.90% | National, early gains in São Paulo, Minas Gerais, Rio Grande do Sul | Short term (≤ 2 years) |
| Corporate PPAs & green-hydrogen demand pull | +0.70% | Northeast (Ceará, Bahia) for hydrogen; Southeast (São Paulo) for corporate PPAs | Long term (≥ 4 years) |
| Emerging offshore-wind pipeline (189 GW at IBAMA) | +0.40% | Coastal states (Rio Grande do Sul, Santa Catarina, Bahia, Sergipe, Rio Grande do Norte, Ceará) | Long term (≥ 4 years) |
| Source: Mordor Intelligence | |||
Increasing Investments in Wind & Solar Generation
The Brazil renewable energy market is drawing record foreign and domestic capital. ENGIE paid BRL 3.24 billion for a 545 MW solar portfolio, while BP purchased Bunge Bioenergia for USD 1.4 billion. Chinese state investors deployed USD 147 million in new wind parks and kicked off solar projects, strengthening bilateral energy ties. BNDES remains pivotal, having financed close to USD 100 billion in renewables and spearheading green-bond structures that lower capital costs. These transactions underscore confidence in the country’s project-finance environment.[1]ENGIE Brasil, “Acquisition of Atlas Assets,” engie.com
Robust Federal & State Auction-Based Procurement Model
National and state auctions underpin long-run demand. In the first Capacity Reserve Auction of 2025, bids totaling 74 GW flooded the Energy Research Office. Twenty-year PPAs lock in offtake, while state-level rounds in São Paulo, Minas Gerais, and Bahia provide additional hedging avenues. The design keeps clearing prices aligned with falling equipment costs and attracts global developers seeking predictable cash flows.[2]Energy Research Office (EPE), “Auction Results 2025,” epe.gov.br
Declining LCOE of Onshore Wind & Utility-Scale PV
Brazil boasts wind capacity factors topping 45% in the Northeast, and solar irradiation above 2,000 kWh/m² in multiple states. Local manufacturing, exemplified by Goldwind’s takeover of a turbine facility in Bahia, helps cushion supply-chain shocks and preserve cost gains. With grid parity achieved in several dispatch zones, developers now bid without subsidies, anchoring a self-sustaining growth cycle.
Net-Metering Law 14.300/2022 Spurring Distributed PV
Distributed generation topped 50 GW in 2024. The law extends net-metering benefits to 2045, sustaining residential adoption even after a 25% module tariff was reimposed in late 2024. More than 1.8 million micro-generation systems have been installed, 99% of them solar. Retail electricity inflation amplifies the appeal, driving a steady pipeline of rooftop projects in São Paulo and Minas Gerais.[3]U.S. Energy Information Administration, “Brazil Country Analysis,” eia.gov
Restraints Impact Analysis*
| Restraint | (~) % Impact on CAGR Forecast | Geographic Relevance | Impact Timeline |
|---|---|---|---|
| Transmission bottlenecks in the Northeast wind corridor | -0.80% | Northeast (Bahia, Rio Grande do Norte, Ceará, Piauí) | Short term (≤ 2 years) |
| Lengthy environmental licensing for large hydro & wind | -0.60% | National, acute in Amazon basin (Pará, Amazonas) and coastal zones (Rio Grande do Sul, Santa Catarina) | Medium term (2-4 years) |
| Mid-day PV curtailment & flow-inversion risk | -0.40% | Southeast (São Paulo, Minas Gerais) and South (Rio Grande do Sul) | Short term (≤ 2 years) |
| 25% import tariff on PV modules raising project CAPEX | -0.50% | National, highest impact in Southeast and South where solar penetration is accelerating | Medium term (2-4 years) |
| Source: Mordor Intelligence | |||
Transmission Bottlenecks in the Northeast Wind Corridor
Rapid wind build-out has outpaced transmission additions. ONS has already curtailed output during peak wind seasons, eroding project returns. Construction delays to major 500 kV lines add risk premiums to merchant revenues. Iberdrola’s BRL 5.5 billion, 1,700 km Minas Gerais-São Paulo line, the world’s largest currently under construction, illustrates the scale of catch-up investment required.[4]Iberdrola, “Transmission Line Investment,” iberdrola.com
Lengthy Environmental Licensing for Large Hydro & Wind
Complex permitting slows large projects. The 2,338 MW Jatobá hydro scheme still awaits a final license after several years of environmental studies. For wind, cumulative avian and marine-life assessments can stretch beyond three years, dissuading some developers. While the government pledges to streamline procedures, meaningful acceleration has yet to materialize.
*Our forecasts treat driver/restraint impacts as directional, not additive. The impact forecasts reflect baseline growth, mix effects, and variable interactions.
Segment Analysis
By Technology: Solar Outpaces All Other Sources
Solar energy added 14.97 GW in 2024, lifting cumulative capacity above 55 GW and positioning the segment to command a rising slice of the Brazilian renewable energy market size over the forecast period. Hydropower still anchors 50.62% of the installed base, yet constrained greenfield prospects shift attention to wind, solar, and a nascent 189 GW offshore pipeline.
Utility-scale PV benefits from falling module prices, while distributed rooftops gain from net-metering incentives. Wind will accelerate once new lines relieve Northeast congestion, and offshore projects will take off after legislative approval, ultimately broadening the Brazilian renewable energy market.



By End-User: C&I Buyers Gain Momentum
Utilities retained 82.95% of 2025 capacity, but commercial and industrial demand is rising fastest at 14.18% CAGR as firms lock in corporate PPAs below regulated tariffs. Vale, CSN, and Suzano collectively contracted more than 3 GW to hedge energy costs and meet ESG goals.
Behind-the-meter installations for factories, malls, and agribusinesses already top 22 GW, and green-hydrogen projects are securing dedicated renewable capacity. This behavioral shift steers fresh volumes into the Brazilian renewable energy market and gradually erodes utility dominance.
Geography Analysis
The Northeast anchors Brazil's renewable energy market growth, housing 90% of installed wind capacity and a high-quality solar resource. States such as Bahia, Ceará, and Rio Grande do Norte host multi-gigawatt onshore clusters leveraging wind factors above 45%. Transmission congestion and occasional curtailment shave revenues, yet a steady pipeline of 5-plus GW annually persists as operators tap hybrid layouts to better match load. The same coastline offers shallow-water bathymetry attractive for the early offshore-wind rounds expected after 2025, with preliminary licensing underway at IBAMA for 189 GW of proposals. Environmental groups remain vigilant about marine biodiversity, implying rigorous baseline studies before final permits.
The Southeast is the epicenter of distributed solar and green-hydrogen offtake. São Paulo and Minas Gerais combined for roughly one-third of the national distributed PV installs in 2024, thanks to dense urban load and utility rebate programs. The region's industrial clusters spur corporate PPAs, illustrated by recent steel, cement, and data-center contracts exceeding 2 GW collectively. Sugarcane bagasse cogeneration thrives in the interior, supporting bioelectricity exports into the grid during the harvest season. Transitioning truck and rail logistics hubs also boost gasified biomass demand, reinforcing the circular energy narrative.
Central-West and South states diversify the Brazil renewable energy market with emerging wind and biomass projects. Mato Grosso's agribusiness sector is piloting biogas-fueled micro-grids to decarbonize grain storage and processing. Rio Grande do Sul ranks among the top three for distributed solar, aided by simplified municipal permitting. Paraná's small hydro refurbishment schemes maintain local voltage stability as aged reservoirs confront hydrology variability. Lastly, the Amazon region sees limited new large-hydro capacity due to socio-environmental pushback. Instead, isolated micro-grids powered by run-of-river turbines and solar-battery kits are being deployed to cut diesel reliance in remote communities.
Regulatory Landscape
Brazil's renewable power market operates under a mature federal framework led by ANEEL (Agencia Nacional de Energia Eletrica), established by Law 9.427/1996, which governs regulation across generation, transmission, distribution, storage, and commercialization. Sector modernization has progressed through Law 15.269/2025, which updates the electricity-sector framework and gives ANEEL an explicit mandate to regulate energy storage activities, while also raising the administrative penalty ceiling to 3% of revenues and increasing compliance stakes for market participants.
Policy direction also includes programmatic support and new rules to accommodate emerging technologies and grid needs. Law 15.103/2025 created the Energy Transition Acceleration Program (PATEN) to support infrastructure and modernization projects across renewable sources (solar, wind, and biomass). A 2025 law also established a legal framework for offshore wind development and grid integration, linking permitting and connection requirements to federal oversight. As of January 1, 2026, differentiated annual CDE quota charges by voltage level were introduced, influencing the retail cost environment and shaping procurement and contracting decisions, especially for larger consumers participating in the free market.
Competitive Landscape
Market leadership in the Brazil renewable energy market is moderately concentrated yet dynamic. ENGIE Brasil, Eletrobras, and Neoenergia collectively operate more than 20 GW, spanning hydro, wind, and solar. Enel Green Power, EDF, and Voltalia lead the foreign developer cohort, each topping 2 GW in operation or late-stage construction. Mid-sized independent power producers, often backed by private equity, fill in regional niches and supply the growing free-market customer base.
Acquisition momentum accelerated in 2024 and 2025. ENGIE absorbed Atlas’ 545 MW solar package, while BP took over Bunge Bioenergia’s ethanol-energy complex to strengthen its bioenergy footprint. Invenergy joined forces with Patria Investments to buy a 600 MW wind portfolio in its first Brazilian bet. Deal flow reflects a maturing asset-recycling cycle whereby developers monetize operating plants to finance new builds.
Technological innovation is becoming a key differentiator. Hybridization, pairing wind and solar on common interconnection points, improves capacity-factor economics and moderates grid stress. Battery storage pilots, including a 50 MW-2-hour lithium-ion system in Ceará, show improving bankability as regulatory clarity for ancillary-service remuneration emerges. Companies are also positioning for the green-hydrogen wave: Neoenergia and Petrobras both launched feasibility studies tied to port export hubs. As auction volumes rise and financing structures broaden, strategic partnerships between equipment OEMs, utilities, and large industrial off-takers are expected to define competitive edges.
Brazil Renewable Energy Industry Leaders
Eletrobras (inc. CHESF, Furnas)
ENGIE Brasil Energia
Neoenergia
Enel Green Power Brasil
CPFL Renováveis
- *Disclaimer: Major Players sorted in no particular order

Market Opportunities and Future Outlook
The case for grid integration and flexibility services is becoming clearer as variable solar and wind deepen their footprint and curtailment risk becomes more visible in constrained corridors. The federal Ten-Year Energy Expansion Plan (PDE 2035), published on July 2, 2026, explicitly includes battery energy storage (7 GW by 2035). This creates a more concrete planning signal for storage-linked business models, including ancillary services, hybridization at shared interconnection points, and congestion-management solutions across the National Interconnected System (SIN). ANEEL also communicated a 2026 expansion pipeline of 9,142 MW of new power capacity (released January 13, 2026), which reinforces near-term project flow and increases the value of dispatchability and grid support.
Distributed solar remains a central commercialization opportunity given its scale and customer economics. EPE data indicates renewables represented 86.8% of domestic electricity supply in 2025, while Brazil's distributed generation base has already surpassed 50 GW (with more than 1.8 million micro-generation systems, predominantly solar). This underpins demand for inverters, engineering services, financing, and O&M tailored to behind-the-meter assets. On the utility side, the offshore wind pipeline lodged at IBAMA (189 GW) and corporate procurement activity (multi-gigawatt PPAs contracted by large industrials) create additional routes to market, while also keeping transmission build-out and regulatory execution central for new connection capacity, particularly in the Northeast wind corridor.
Recent Industry Developments
- July 2026: Neoenergia announced a plan to invest EUR 2.4 billion in electricity grid infrastructure in Brazil's Northeast. The program targets distribution and network reinforcement in a region central to wind and solar build-out, linking regulated grid capex with the ability to absorb new renewable connections and reduce operational constraints.
- May 2026: ENGIE Brasil Energia reported that the Assu Sol photovoltaic complex in Rio Grande do Norte reached full commercial capacity at 895 MWp after a reported investment of BRL 3.3 billion. Bringing a utility-scale solar asset to full operation increases solar supply in the Northeast and raises the importance of transmission availability and portfolio balancing tools such as hybridization and storage.
- October 2024: Eletrobras and Ocean Winds agreed to assess offshore wind project opportunities in Brazil through a cooperation arrangement. This links a major domestic power company with an established offshore developer platform for early-stage project screening, ahead of Brazil's offshore wind framework and the associated environmental licensing pathway.


Research Methodology Framework and Report Scope
Market Definition and Coverage
This market is defined as the installed renewable power capacity operating in Brazil, captured in gigawatts and tracked across the study period to show additions and retirements over time.
Scope exclusions: We do not count fossil fuel capacity, and we also do not convert the capacity totals into a USD revenue market value in this sizing view.
Segmentation Overview
- By Technology
- Solar Energy (PV and CSP)
- Wind Energy (Onshore and Offshore)
- Hydropower (Small, Large, PSH)
- Bioenergy
- Geothermal
- Ocean Energy (Tidal and Wave)
- By End-User
- Utilities
- Commercial and Industrial
- Residential
Data Sources, Market Sizing, and Validation
Desk Research
Desk work starts with building a capacity baseline and a technology-by-technology timeline of additions, then checking the resulting Brazil renewables series against multiple public datasets. For the installed capacity context in Brazil, we use sources such as the International Renewable Energy Agency (IRENA), we cross-check energy-balance figures with the International Energy Agency (IEA), and we use the Energy Institute Statistical Review for cross-country consistency checks.
To keep the Brazil view practical, we also review official Brazilian energy planning and system operator publications (where available), plus project and auction announcements, company filings, and investor presentations to distinguish commissioned capacity from assets still under construction. Patent databases are used in a limited way to sense where technology effort is rising, and an import-export shipment-level database is referenced selectively when equipment flow signals help validate build cycles. The sources listed here are illustrative, and additional public documents and datasets were used for collection, checks, and clarification.
Primary Interviews and Surveys
Primary work focuses on validating what desk sources cannot fully confirm, especially commissioning timing, typical project delays, and how the pipeline converts into actual operating capacity in Brazil. We speak with developers, utilities, equipment and service participants, and commercial and industrial renewable buyers across Brazil, and then reconcile differences through follow-up questions when inputs do not align.
Distribution of primary research fieldwork respondents
| Company type | Respondent position |
|---|---|
| Top tier: 33% | CXOs: 19% |
| Mid tier: 45% | Functional/Unit leaders: 34% |
| Smaller Players: 22% | Managers: 47% |
Market-Sizing & Forecasting
Sizing is built around a top-down capacity reconstruction, where official renewable capacity series and commissioning timelines are used to rebuild the yearly installed base by technology in Brazil. Once the totals are formed, they are stress-tested with selective bottom-up approximations such as sampled project roll-ups, channel checks on typical build rates, and volume sanity checks that use average project sizes and likely commissioning schedules.
Key model inputs include historical annual capacity additions, the mix shift between solar, wind, hydropower, bioenergy, and newer options, observed lead times from award to operation, and grid connection readiness signals that often explain slippage. We also factor in policy and auction cadence as an indicator for near-term starts, and we use retirements and repowering patterns as a small but important correction, because the installed base can be overstated when old assets are not removed. For forecasting, scenario analysis is applied around pipeline conversion and delay ranges, and the chosen path is aligned to what industry experts consider reasonable under current constraints.
Data Validation & Update Cycle
Outputs are checked against independent indicators, including whether implied additions match known commissioning clusters and whether technology shares move in a realistic way year to year in Brazil. When a large variance appears, the driver is isolated, the source trail is reviewed, and respondents may be re-contacted to confirm timing, status, or definition alignment.
Before sign-off, the model and assumptions go through more than one analyst review, and the final numbers are compared against alternate calculations built from a different set of inputs to catch hidden errors. The report is refreshed on an annual schedule, and interim adjustments are made when major auctions, regulatory changes, or commissioning waves materially change the near-term outlook. Right before delivery, we run a final update pass so clients receive the most current view available.
Mordor Intelligence's Brazil Renewable Energy Market Size Measured Against Other Published Estimates
Published estimates for Brazil renewable energy often do not match because the underlying unit of measure is not always the same, and updates are applied on different timelines. Some figures are stated as installed capacity, while others present a USD revenue view that depends heavily on price, contract structure, and currency timing.
In practice, the spread typically comes from refresh cadence and the assumptions that sit behind pricing, since new auctions and commissioning dates can shift the near-term picture quickly, and currency translation can change the final USD totals even when local activity is steady. By re-checking commissioning status and locking currency timing consistently at the update point, Mordor Intelligence keeps the capacity baseline tied to what is actually operating in Brazil, instead of blending in revenue assumptions that move with power prices.
Benchmark comparison
| Source | Market Size | Gaps in Research Methodology |
|---|---|---|
| Mordor Intelligence | USD 243.36 B (2026) | |
| Global Consultancy A | USD 18.60 B (2025) | Uses a revenue definition in USD, so results move with power price and contract assumptions, and the stated scope is not anchored to installed capacity additions. |
| Industry Publisher B | USD 17.40 B (2025) | Reports a current USD market value with broader type and region splits, which can differ materially depending on tariff, wholesale price proxies, and currency conversion timing. |
The table shows that the largest difference is not a small calculation issue, it is the measurement choice itself, capacity versus revenue. Once the unit is aligned and the update timing is made clear, the sizing steps become easier to repeat, and users can trace the totals back to visible commissioning and installed base signals.


Key Questions Answered in the Report
What is the forecast capacity for renewable generation in Brazil by 2031?
Installed renewable capacity is projected to reach 316.37 GW by 2031, reflecting a 5.40% CAGR from 2026.
Which end-user segment is expanding the fastest?
Commercial and industrial buyers are advancing at 14.18% CAGR through 2031, driven by corporate PPAs and behind-the-meter projects.
How significant is offshore wind in Brazil’s pipeline?
Licensing requests at the environmental agency total 189 GW, indicating large-scale coastal potential once federal rules are finalized.
Why does Law 14.300/2022 matter for rooftop solar?
The law locks in net-metering rights for existing systems until 2045 and phases grid fees in slowly, triggering a surge in residential and small-business installations.
What are the main obstacles to new onshore wind projects in the Northeast?
Transmission congestion causes generation curtailment, and new 500 kV lines scheduled for 2028 are essential to relieve the bottleneck.
How will the 25% solar module tariff affect project economics?
The duty lifts utility-scale solar CAPEX by 8-12% until domestic assembly plants ramp up, nudging the levelized cost of energy higher in the near term.
Page last updated on:


 Your data is secure and never sold or shared.


