Boron Market Size and Share
Market Overview
| Study Period | 2021 - 2031 |
|---|---|
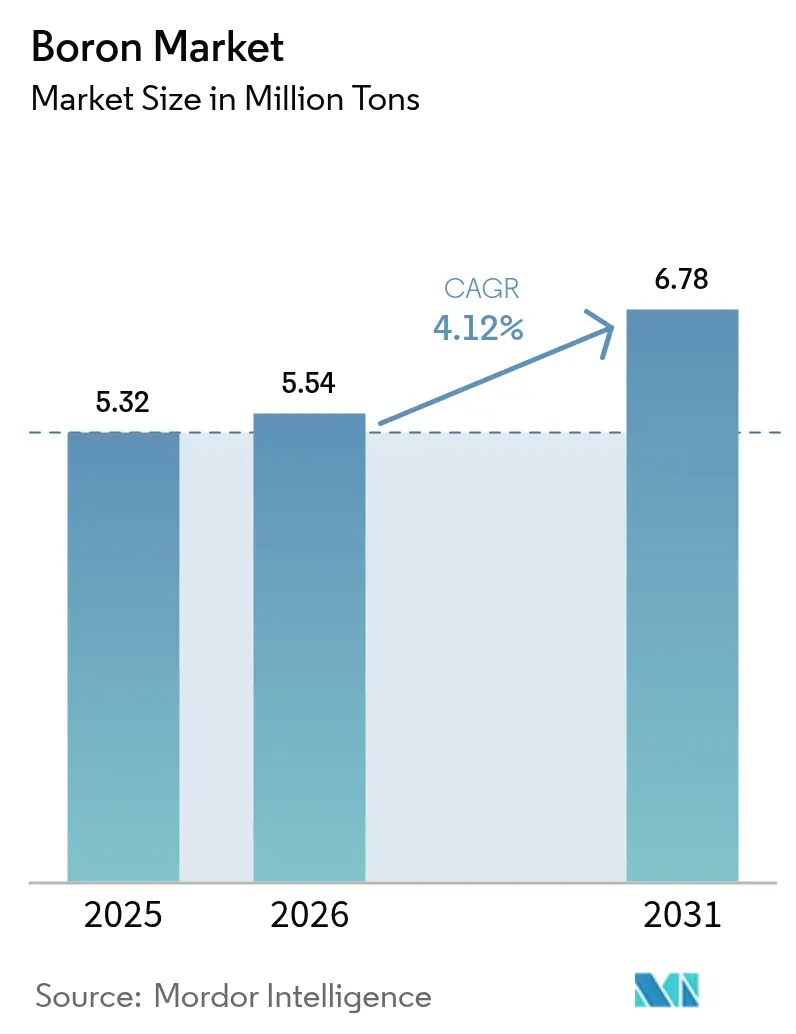
| Market Volume (2026) | 5.54 Million tons |
| Market Volume (2031) | 6.78 Million tons |
| Growth Rate (2026 - 2031) | 4.12% CAGR |
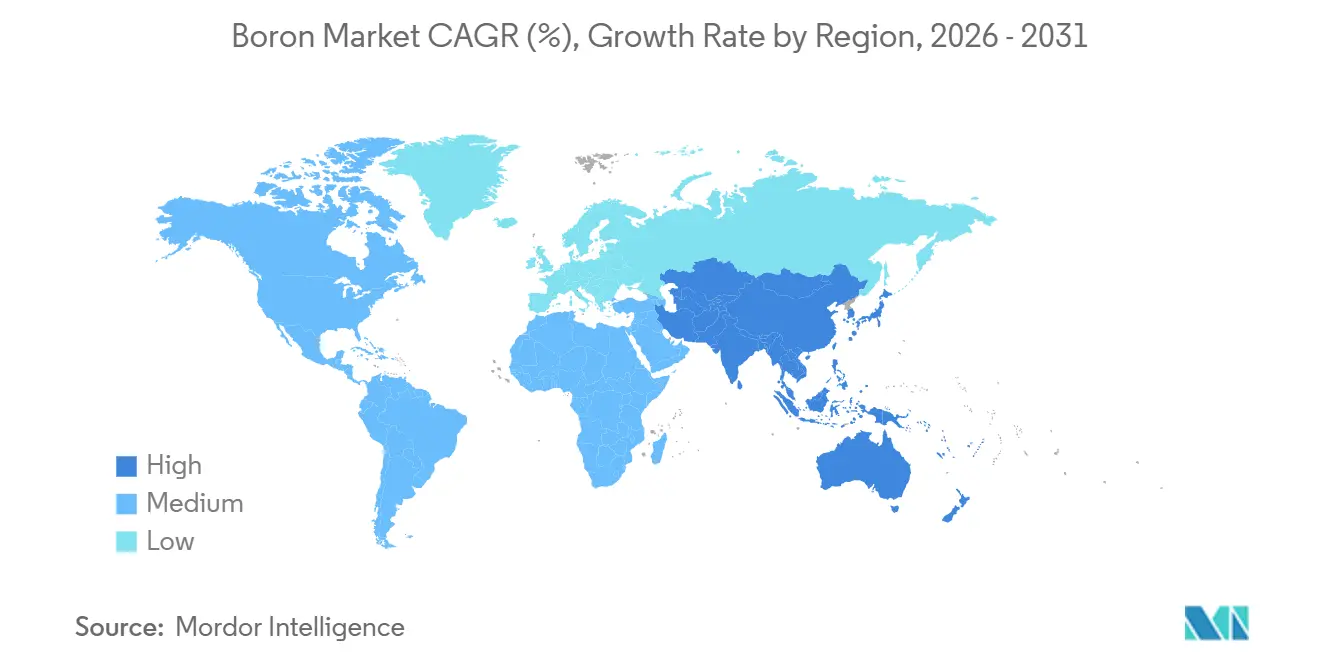
| Fastest Growing Market | Asia Pacific |
| Largest Market | Asia Pacific |
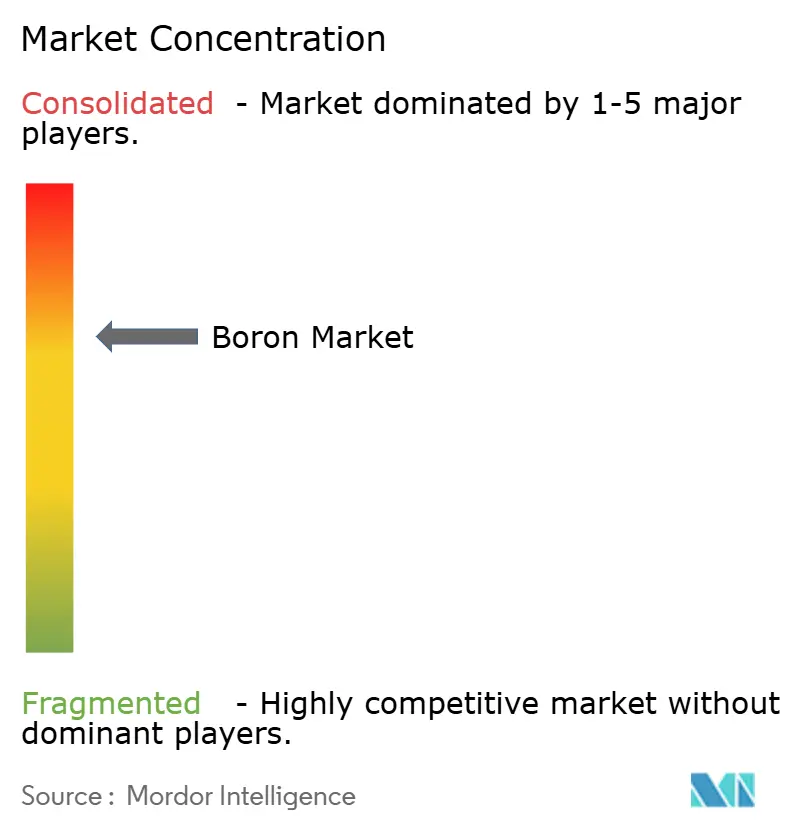
| Market Concentration | Medium |
Major Players *Disclaimer: Major Players sorted in no particular order Image © Mordor Intelligence. Reuse requires attribution under CC BY 4.0. | |
Boron Market Analysis by Mordor Intelligence
The Boron Market size is expected to increase from 5.32 million tons in 2025 to 5.54 million tons in 2026 and reach 6.78 million tons by 2031, growing at a CAGR of 4.12% over 2026-2031. In November 2025, the U.S. designated boron as a federal critical mineral, spurring incentives for onshore projects and intensified supply-chain audits. Turkey, seizing the moment, ramped up its production year-on-year through August 2024. In September 2024, it inaugurated a granular facility, further solidifying its grip on deposits that account for a significant portion of the world's reserves. Meanwhile, on February 6, 2026, Searles Valley Minerals issued a WARN notice, revealing permanent layoffs. This move underscored the mounting pressure on unintegrated North American producers, who find themselves at a disadvantage against Turkey's subsidized capacity. Developments like Ioneer’s Rhyolite Ridge, which capitalize on both lithium and boron, are now seen as strategic moves, positioning them competitively against state-backed suppliers.
Key Report Takeaways
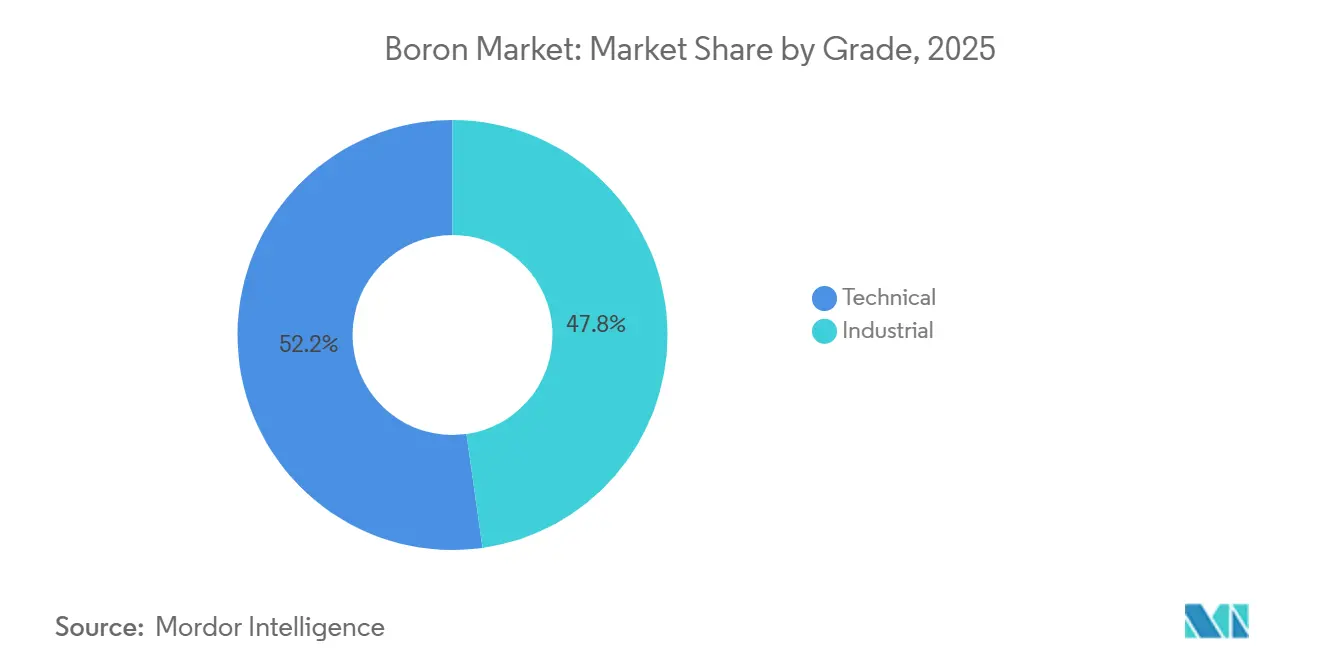
- By grade, technical grade captured 52.23% of the boron market share in 2025, and the segment is forecast to post a 4.16% CAGR through 2031.
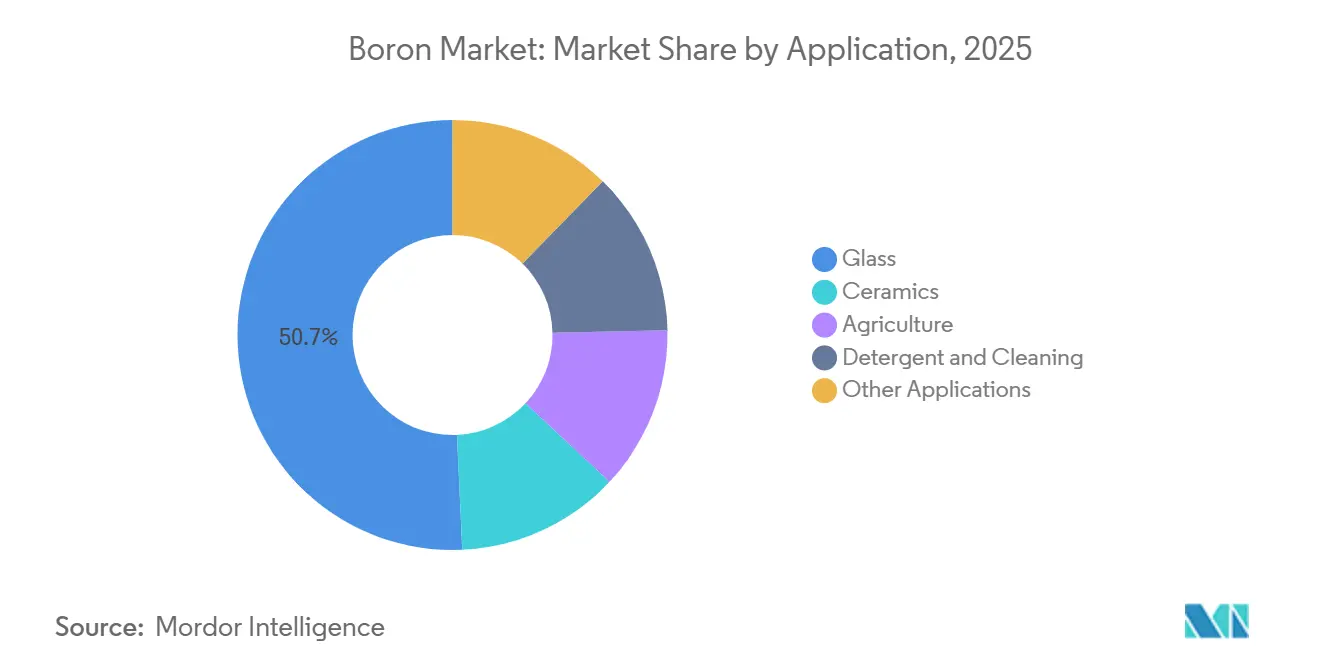
- By application, glass led with 50.71% revenue share in 2025 and is poised for the quickest 4.23% CAGR to 2031.
- By geography, Asia-Pacific accounted for 52.34% of 2025 sales; the region is projected to record the fastest 4.20% CAGR through 2031.
Note: Market size and forecast figures in this report are generated using Mordor Intelligence’s proprietary estimation framework, updated with the latest available data and insights as of 2026.
Global Boron Market Trends and Insights
Drivers Impact Analysis*
| Drivers | (~) % Impact on CAGR Forecast | Geographic Relevance | Impact Timeline |
|---|---|---|---|
| Construction-grade glass demand surge (borosilicate, glass-ceramics) | +1.2% | Global, with APAC core and North America secondary | Medium term (2-4 years) |
| Electrification-induced semiconductor boron dopants | +0.9% | APAC (Taiwan, South Korea, Japan), North America (US) | Long term (≥ 4 years) |
| Micronutrient-driven agritech adoption | +0.8% | APAC (India, China), South America (Brazil, Argentina) | Short term (≤ 2 years) |
| Hydrogen storage via solid borohydrides | +0.4% | Europe, North America, Japan | Long term (≥ 4 years) |
| Ultra-high-temperature ceramics for hypersonics | +0.5% | North America, Europe (defense contractors) | Medium term (2-4 years) |
| Source: Mordor Intelligence | |||
Construction-Grade Glass Demand Surge
Borosilicate glass has transitioned from specialized laboratory use to becoming a staple in mainstream infrastructure. Producers of pharmaceutical vials turn to Type I borosilicate to sidestep leachables in biologics. Manufacturers in the solar industry opt for low-iron borosilicate cover sheets, as these sheets not only transmit more light but also endure hail impacts. Notably, installations in the Asia-Pacific region represented a significant portion of photovoltaic glass consumption. Developers of solid-oxide fuel cells are choosing calcium-borosilicate substrates, which can operate at 800 °C while retaining ionic conductivity. While flat-panel display lines in South Korea and Taiwan continue to utilize aluminoborosilicate, the shift towards OLEDs has tempered volume growth. Collectively, these dynamics ensure a consistent demand for borosilicate glass, providing a buffer for the boron market against fluctuations seen in other sectors.
Electrification-Induced Semiconductor Boron Dopants
Ion implantation depends on ultra-high-purity boron trifluoride. Gate-all-around transistors at sub-3 nm nodes tolerate no metallic contamination, reinforcing demand for 99.999% gas. Research during 2024 demonstrated boron-doped diamond MOSFET mobility above 100 cm²/V·s, suggesting future displacement of silicon carbide in electric-vehicle inverters[1]MDPI, “Boron-Doped Diamond MOSFETs for High-Voltage Applications,” mdpi.com. Due to the defense-critical nature of neutron-absorbing control rods, the U.S. Department of Defense has allocated funds to boost domestic boron carbide production. Foundry majors in Taiwan and South Korea import all boron feedstock, so geopolitical shifts in Turkish export policy present a latent supply risk that further incentivizes diversification of the boron market.
Micronutrient-Driven Agritech Adoption
In January 2026, India revised its Nutrient-Based Subsidy, adding boron-fortified fertilizers to the same policy tier as zinc and manganese. Agronomic trials indicate that a deficiency in boron can lead to a significant yield drop in cotton and rapeseed. However, a tissue-specific application can effectively restore these yields. China is implementing similar measures in regions with high-pH soils. Meanwhile, Brazil and Argentina incorporate boron into NPK blends specifically for soy. Given that crop cycles are annual, the consistent agricultural offtake creates a demand floor, helping to stabilize the boron market even during construction downturns.
Hydrogen Storage via Solid Borohydrides
While metal borohydrides like LiBH₄ can store hydrogen, their high desorption temperatures pose challenges for commercialization. Alloying LiBH₄ with magnesium hydride cut release thresholds to below 300 °C in 2024 experiments, a range compatible with proton-exchange-membrane waste heat. Horizon Europe and Japan’s NEDO have since funded pilot synthesis lines, aiming to support long-haul transport that batteries cannot serve. Sodium borohydride, already used in pulp bleaching, may provide a circular loop because spent sodium borate can be regenerated electrolytically. While no automaker has yet committed, the work keeps a technology option alive and widens the strategic envelope of the boron market.
Restraints Impact Analysis*
| Restraints | (~) % Impact on CAGR Forecast | Geographic Relevance | Impact Timeline |
|---|---|---|---|
| Energy-intensive refining cost swings | -0.6% | Global, acute in Europe and North America | Short term (≤ 2 years) |
| Open-pit mining environmental curbs | -0.4% | Turkey, South America (Chile, Argentina) | Medium term (2-4 years) |
| Silicon-based glass modifiers substitution risk | -0.3% | Global, concentrated in low-cost glass segments | Long term (≥ 4 years) |
| Source: Mordor Intelligence | |||
Energy-Intensive Refining Cost Swings
In boron refining, energy costs dominate, especially with multi-stage calcination processes exceeding 900 °C. European gas prices surged in early 2024, only to plummet by late 2025. However, this volatility has made investors wary of committing to new kilns. In 2024, Rio Tinto transitioned its California mobile equipment to renewable diesel. This move reduced its Scope 1 carbon emissions but simultaneously increased its fuel costs. Meanwhile, Eti Maden capitalizes on subsidized electricity rates in Turkey, creating a pronounced cost disparity that ultimately influences transaction prices in the boron market.
Open-Pit Mining Environmental Curbs
Turkey’s Kırka and Bigadiç pits now face tougher dust-suppression and water-recycling audits introduced in 2024; compliance requires electrostatic precipitators and covered conveyors that raise capital intensity. Chile’s January 30, 2026, critical minerals strategy placed stricter tailings standards on Salar de Surire and Salar de Atacama, where boric acid is a coproduct with lithium. Europe’s draft Critical Raw Materials Act will require ISO 14001 verification for importers. Higher compliance costs do not remove supply but elevate the global cost floor for the boron market.
*Our forecasts treat driver/restraint impacts as directional, not additive. The impact forecasts reflect baseline growth, mix effects, and variable interactions.
Segment Analysis
By Grade: Technical Purity Lifts Premium Applications
Technical Grade held 52.23% of the 2025 volume, and its dominance is set to expand at a 4.16% CAGR. This is driven by heightened demands for ppm-level purity from sectors like microelectronics and defense. For instance, sub-3 nm nodes necessitate ion-implant boron trifluoride with a high level of purity. Similarly, to ensure reactor safety margins, neutron-absorbing boron carbide mandates boron-10 enrichment exceeding specific thresholds. Notably, funding directed specifically at this grade hints at a predictable multi-year demand surge. On the other hand, Industrial Grade caters to sectors like glass, detergents, and fertilizers. However, its growth is tempered. Mature applications impose limits, and there's an ongoing substitution trend in household cleaners.
Premium spreads for boron widened significantly in 2025. This shift occurred as refiners in Turkey and Chile opted for higher-margin lithium brines, sidelining boron purification and thereby capping the incremental supply of Technical Grade. Major aerospace players are increasingly turning to single-sourcing high-purity powders. This strategy not only sidesteps qualification delays but also results in long-term contracts, bolstering price stability in the boron market. In contrast, prices for Industrial Grade are influenced by fluctuations in freight rates and energy surcharges. Such volatility has a ripple effect, impacting agricultural retailers who navigate seasonal inventory challenges.


By Application: Glass Anchors Structural Growth
Glass captured 50.71% of 2025 volume and remains the fastest expanding application at 4.23% CAGR through 2031, securing over half of projected incremental tonnage and reinforcing its place at the center of the boron market. Pharmaceutical vials, solar cover sheets, and laboratory equipment account for the bulk, each leveraging borosilicate’s coefficient of thermal expansion, which is one-third that of soda-lime alternatives. Solar adoption in Asia-Pacific, coupled with U.S. factory-build announcements, sustains baseline momentum even if construction sentiment wavers elsewhere.
Ceramics also hold significant shares, driven by hypersonic hardware and thermal-management substrates in high-density power electronics. India’s new subsidy has bolstered agriculture's share of boron-fortified micronutrients. In North America and Europe, sodium percarbonate and enzyme cocktails are replacing sodium perborate, leading to a decline in detergent sales. However, borax maintains a price edge in ASEAN markets. Meanwhile, flame retardants and neutron-capture therapy, though minor players, are expanding in tandem with the broader boron market.

Geography Analysis
Asia-Pacific accounted for 52.34% of global volume in 2025 and will expand at a 4.20% CAGR, reflecting the region’s dominance in flat-panel glass, fertilizer consumption, and precision ceramics. China heavily relied on imports from Turkey and Chile due to the limited scale of local ores. Thanks to a subsidy, India's farm demand is set to rise annually. Meanwhile, Japan is making strides by exporting precision boron nitride parts, crucial for semiconductor packaging. Additionally, emerging glass clusters in Vietnam and Thailand are not only expanding supply chains but also integrating the boron market into the region's manufacturing landscape.
North America accounted for a significant share of the global volume in 2025. Rio Tinto's California complex contributes substantially to the global refined output, yet has not announced any expansions post-2024. A federal designation as a critical mineral in the U.S. from November 2025 paves the way for tax incentives, bolstering domestic ventures. Ioneer's Rhyolite Ridge, which received clearance in October 2024, is set to commence operations in 2028, producing boric acid annually. Meanwhile, Canada and Mexico play a minor role, primarily importing from U.S. distributors.
Europe accounted for a notable portion of the global boron consumption in 2025. Key players like Germany, France, and Italy, while central to fiberglass insulation and ceramics, depend on Turkey for a significant share of their boron imports[2]European Commission Joint Research Centre, “Boron Factsheet 2023,” ec.europa.eu. This reliance is further emphasized by the draft EU legislation classifying boron as a strategic raw material, highlighting the region's supply vulnerabilities. South America, with a considerable share, is spearheaded by Chile's Salar de Surire plant and SQM's unit at Salar de Atacama. In the Middle East and Africa, accounting for a smaller share, Saudi Arabia and South Africa emerge as the main importers.

Competitive Landscape
The boron market is moderately consolidated. Emergent solution-mining ventures in California began pilot extraction in January 2024. These entrants fragment a region long shared by two incumbents and test whether modular plants can remain viable against Turkish low-cost exports. Patent filings jumped in 2024 from 2023, signaling a pivot of innovation toward downstream chemistry, especially borohydride synthesis and ultra-high-temperature composites. Technical Grade suppliers are investing in ion-exchange purification and isotopic enrichment, while Industrial Grade players chase freight synergies and just-in-time warehousing.
Boron Industry Leaders
Eti Maden
Rio Tinto
Quiborax
Searles Valley Minerals
Minera Santa Rita (MSR)
- *Disclaimer: Major Players sorted in no particular order

Recent Industry Developments
- May 2025: Boron One Holdings and Serbian mining company Resavica RKU signed a letter of intent to explore strategic cooperation. The agreement focuses on improving the Pobrdje Colemanite Mine's efficiency and utilizing Resavica's infrastructure for the Piskanja Boron Project.
- January 2025: The U.S. Department of Energy's Loan Programs Office granted Ioneer a USD 996 million loan through its Advanced Technology Vehicles Manufacturing program. This funding will enable the development of an on-site processing facility at the Rhyolite Ridge Lithium-Boron project in Nevada.


Global Boron Market Report Scope
Boron is a nonmetallic element occurring naturally only in combination, as in borax or boric acid. It is a poor conductor of electricity and can also be found in ceramics, flare guns, and fiberglass.
The market is segmented by grade, application, and geography. By grade, the market is divided into technical and industrial. By application, the market is categorized into glass, ceramics, agriculture, detergent and cleaning, and other applications. The report also covers the market size and forecasts for boron in 16 countries across major regions. For each segment, the market sizing and forecasts are done in volume (Tons).
| Technical |
| Industrial |
| Glass |
| Ceramics |
| Agriculture |
| Detergent and Cleaning |
| Other Applications |
| Asia-Pacific | China |
| India | |
| Japan | |
| South Korea | |
| ASEAN Countries | |
| Rest of Asia-Pacific | |
| North America | United States |
| Canada | |
| Mexico | |
| Europe | Germany |
| United Kingdom | |
| France | |
| Italy | |
| Russia | |
| Nordic Countries | |
| Rest of Europe | |
| South America | Brazil |
| Argentina | |
| Rest of South America | |
| Middle-East and Africa | Saudi Arabia |
| South Africa | |
| Rest of Middle-East and Africa |
| By Grade | Technical | |
| Industrial | ||
| By Application | Glass | |
| Ceramics | ||
| Agriculture | ||
| Detergent and Cleaning | ||
| Other Applications | ||
| By Geography | Asia-Pacific | China |
| India | ||
| Japan | ||
| South Korea | ||
| ASEAN Countries | ||
| Rest of Asia-Pacific | ||
| North America | United States | |
| Canada | ||
| Mexico | ||
| Europe | Germany | |
| United Kingdom | ||
| France | ||
| Italy | ||
| Russia | ||
| Nordic Countries | ||
| Rest of Europe | ||
| South America | Brazil | |
| Argentina | ||
| Rest of South America | ||
| Middle-East and Africa | Saudi Arabia | |
| South Africa | ||
| Rest of Middle-East and Africa | ||


Key Questions Answered in the Report
How fast will the Asia-Pacific demand for boron grow through 2031?
Asia-Pacific demand is projected to rise at a 4.20% CAGR, supported by solar cover glass, fertilizer subsidies, and electronics glass.
Why is Technical Grade pricing rising faster than Industrial Grade?
Semiconductor and defense specifications require ppm-level purity, creating tight supply and pushing Technical Grade premiums within one year.
Which applications are most exposed to substitution risk?
Commodity flat glass can swap part of its boron content for alumina or zirconia, trimming demand growth in low-end segments.
What is the current demand for the boron market and its expected growth by 2031?
The global consumption is 5.54 million tons in 2026 and is projected to reach 6.78 million tons by 2031, reflecting a 4.12% CAGR.
Page last updated on:


