Bluetooth Smart And Smart Ready Market Size and Share
Market Overview
| Study Period | 2020 - 2031 |
|---|---|
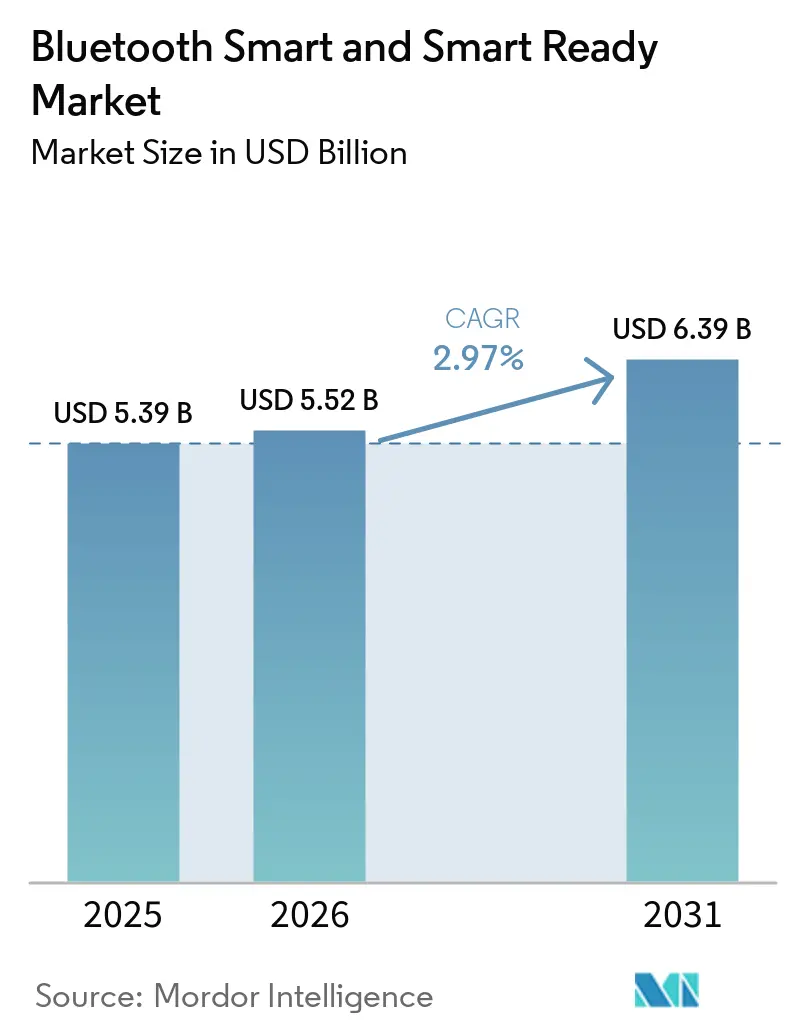
| Market Size (2026) | USD 5.52 Billion |
| Market Size (2031) | USD 6.39 Billion |
| Growth Rate (2026 - 2031) | 2.97% CAGR |
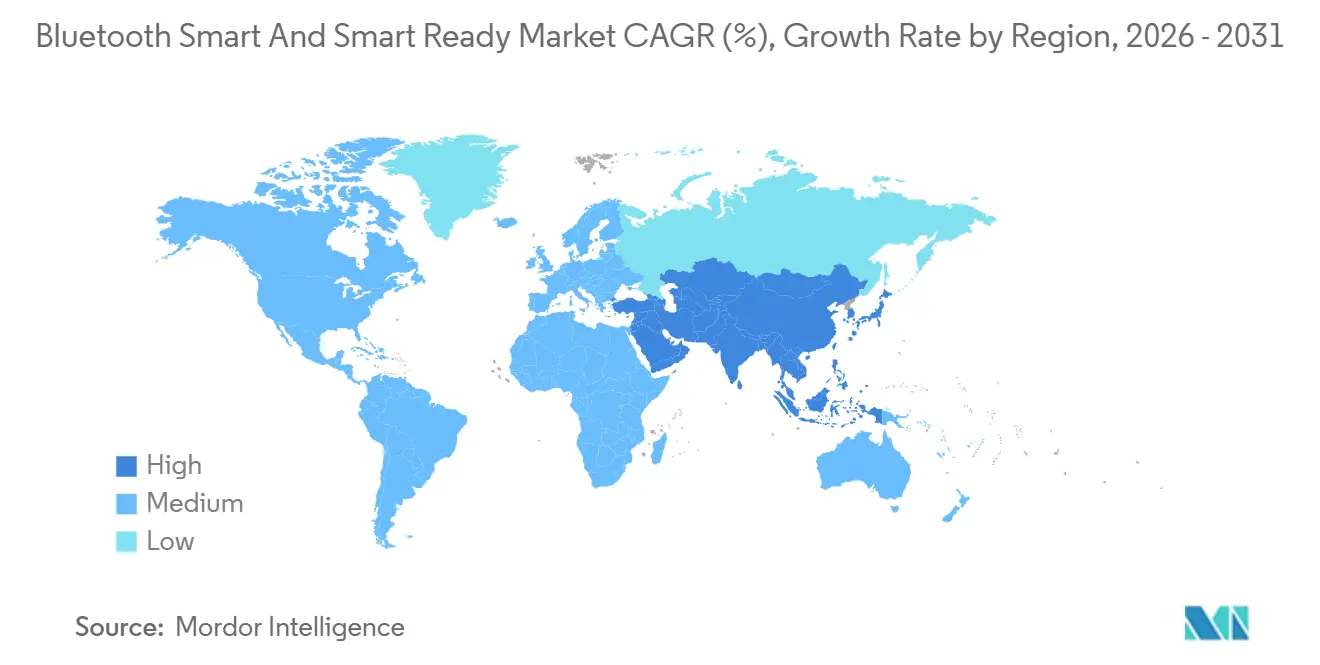
| Fastest Growing Market | Asia-Pacific |
| Largest Market | Asia Pacific |
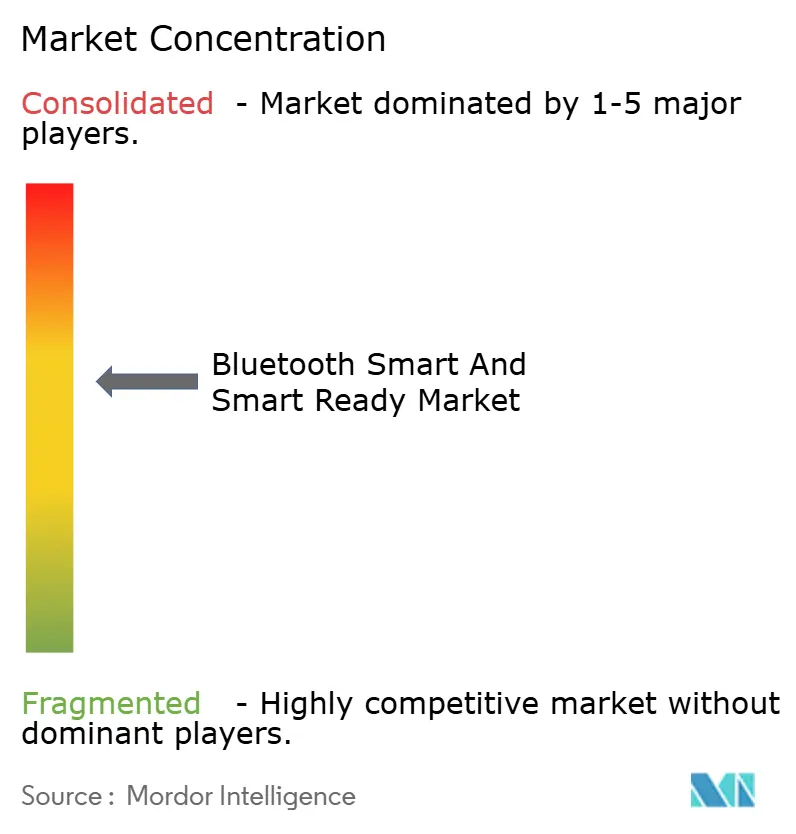
| Market Concentration | Medium |
Major Players *Disclaimer: Major Players sorted in no particular order Image © Mordor Intelligence. Reuse requires attribution under CC BY 4.0. | |
Bluetooth Smart And Smart Ready Market Analysis by Mordor Intelligence
The Bluetooth Smart and Smart Ready market size is expected to grow from USD 5.39 billion in 2025 to USD 5.52 billion in 2026 and is forecast to reach USD 6.39 billion by 2031 at a 2.97% CAGR over 2026-2031. Underneath the headline numbers, single-mode Bluetooth Low Energy shipments are accelerating, supply chains are pivoting to sub-40-nanometer nodes, and regulatory mandates in healthcare are broadening the use of secure connectivity. Vendor roadmaps now target standby currents below 50 nanoamperes, a threshold that enables 10-year coin-cell lifetimes and positions Bluetooth Low Energy as the default short-range protocol in smart-home and industrial sensors. At the same time, Bluetooth Mesh is converging with the Matter standard, setting the stage for unified firmware across lighting, HVAC, and security devices. Competitive dynamics revolve around integrating neural processing units and supporting Bluetooth 7.0 High Data Throughput, both of which differentiate premium smartphones, wearables, and automotive infotainment platforms.
Key Report Takeaways
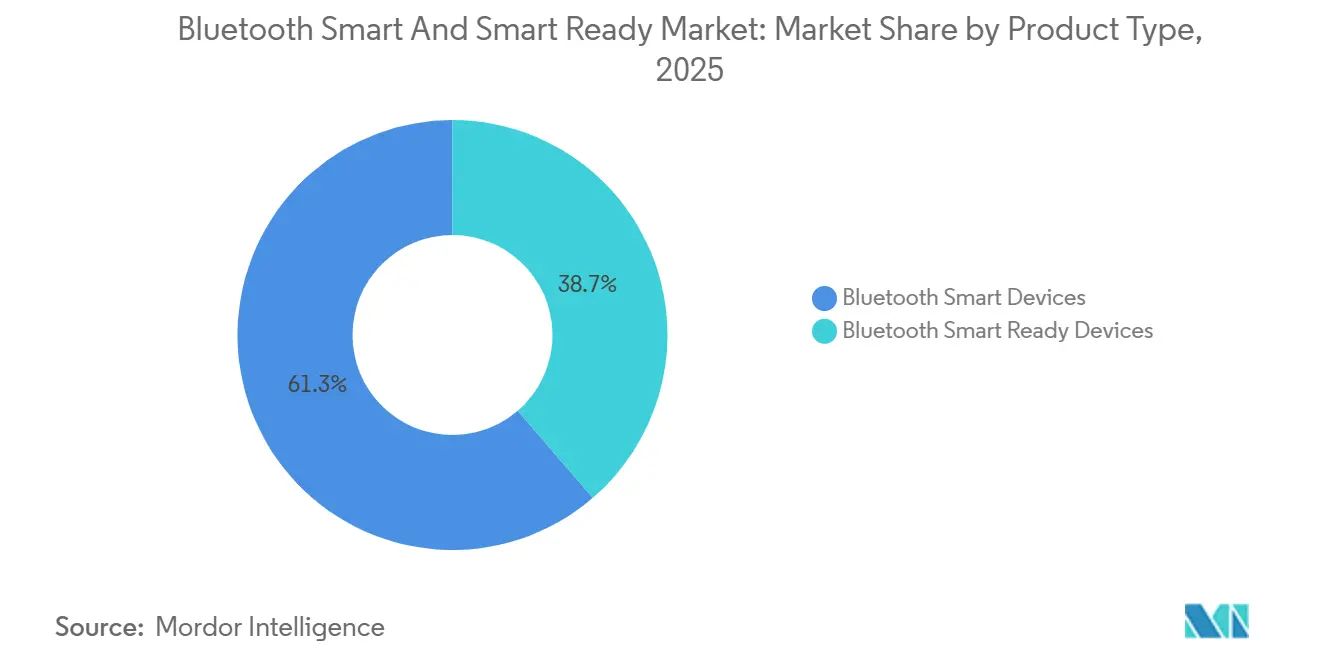
- By product type, Bluetooth Smart Devices held 61.32% of the Bluetooth Smart and Smart Ready market share in 2025 and are projected to expand at a 3.37% CAGR through 2031.
- By technology, Bluetooth 5.1 posted the fastest trajectory with a 3.97% CAGR, although Bluetooth Low Energy already commanded 46.36% of the Bluetooth Smart and Smart Ready market in 2025.
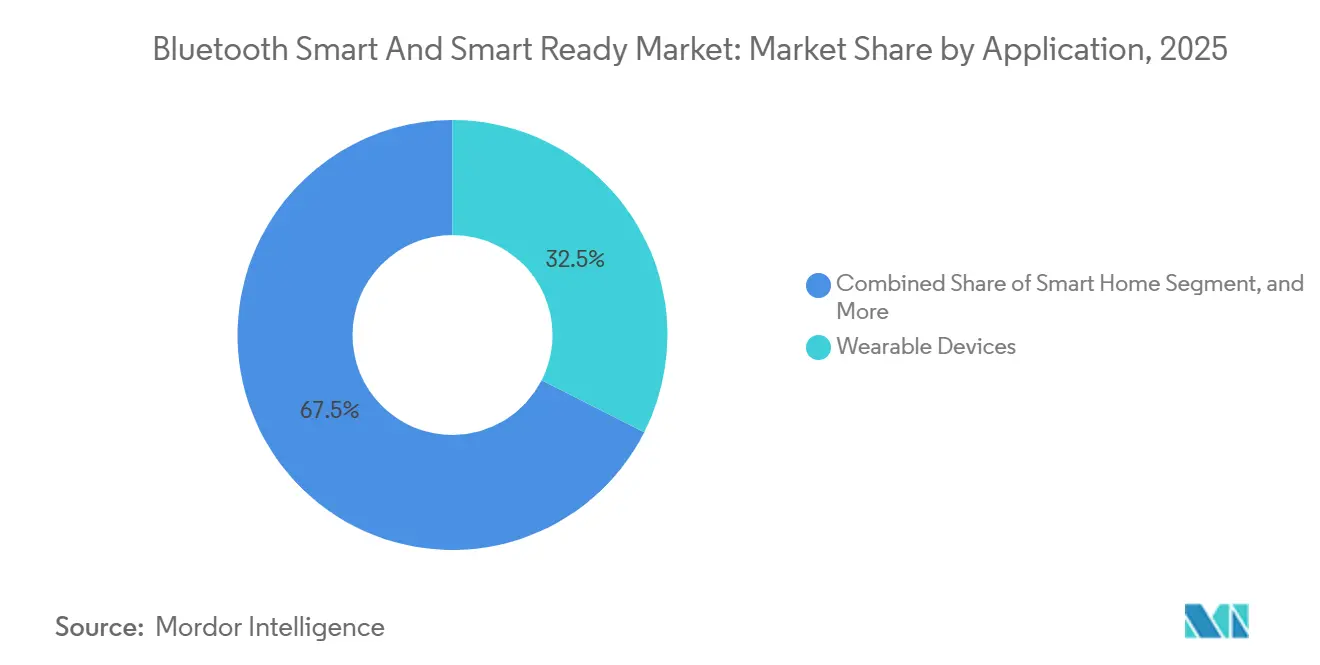
- By application, healthcare advanced at a 3.88% CAGR, overtaking wearables, which still accounted for 32.48% of shipments in 2025.
- By end-user industry, healthcare demand grew at a 3.91% CAGR while consumer electronics retained 39.31% revenue leadership in 2025.
- By geography, Asia-Pacific captured 38.83% of 2025 revenue and is pacing the forecast at a 3.83% CAGR.
Note: Market size and forecast figures in this report are generated using Mordor Intelligence’s proprietary estimation framework, updated with the latest available data and insights as of January 2026.
Global Bluetooth Smart And Smart Ready Market Trends and Insights
Driver Impact Analysis*
| Driver | (~) % Impact on CAGR Forecast | Geographic Relevance | Impact Timeline |
|---|---|---|---|
| Growing Installed Base of IoT Nodes | +0.9% | Global, led by Asia-Pacific | Long term (≥ 4 years) |
| Smartphone OEM Adoption of LE Audio Specification | +0.7% | North America, Europe, Asia-Pacific | Medium term (2-4 years) |
| Regulatory Push for Connected-Healthcare Devices | +0.6% | North America and EU, early growth in Japan and South Korea | Medium term (2-4 years) |
| Rising Demand for Location-Based Retail Analytics | +0.5% | North America and Europe retail hubs, expanding to Asia-Pacific cities | Short term (≤ 2 years) |
| Convergence of Bluetooth Mesh With Matter Standard | +0.4% | North America and Europe smart-home markets | Medium term (2-4 years) |
| Ultra-Low-Power SoC Roadmaps From Fabless Vendors | +0.3% | Global, early adoption in Asia-Pacific manufacturing | Long term (≥ 4 years) |
| Source: Mordor Intelligence | |||
Growing Installed Base of IoT Nodes
Shipments of Bluetooth-enabled devices climbed to 5.3 billion units in 2025, and forecasts approach 8 billion by 2029, underscoring the scale that is fueling the Bluetooth Smart and Smart Ready market. Industrial, agricultural, and building-automation projects now specify mesh-enabled Bluetooth Low Energy sensors for temperature, humidity, and occupancy, avoiding proprietary gateways and trimming bill-of-materials cost by nearly 30%.[1]Connectivity Standards Alliance, “Matter 1.4 Adds Energy Management, Appliances, and More,” CSA, csa-iot.org Edge architectures favor the protocol because every smartphone can act as a field programmer, accelerating commissioning and maintenance. The trend directly lifts coin-cell sensor volumes, which grew 22% year over year in 2025. The adoption wave strengthens over the next decade as sub-1-microampere active currents arrive, widening the gap with Zigbee and Z-Wave in power-sensitive endpoints.
Smartphone OEM Adoption of LE Audio Specification
Samsung built native LE Audio support into its Galaxy S25 series in January 2025, enabling Auracast broadcasts that stream gate announcements and music to any compatible earbud or hearing aid (samsung.com). Google followed by embedding mandatory LE Audio APIs in Android 16, previewed in February 2026, ensuring that future handsets expose multi-stream audio and low-latency broadcast functions. Public venues are already installing Auracast transmitters; 120 beacons went live at Chicago’s O’Hare airport in March 2025, to pipe localized audio directly to passengers’ devices. The upgrade cycle obliges smartphone vendors to support both Classic and LE Audio during transition, doubling validation matrices and driving demand for dual-mode system-on-chips. As the installed base flips toward LE Audio, single-mode designs will accelerate, reinforcing volume growth for the Bluetooth Smart and Smart Ready market.
Regulatory Push for Connected-Healthcare Devices
The EU’s Radio Equipment Directive 2022/30, effective August 2025, mandates encryption, secure firmware updates, and coordinated vulnerability disclosure for Bluetooth medical sensors. In the United States, the FDA’s Digital Health Center of Excellence requires Bluetooth devices seeking 510(k) clearance to demonstrate mutual authentication and over-the-air upgrade capability. Japan’s PMDA and South Korea’s MFDS aligned their guidelines in 2025, forcing vendors to validate coexistence among Wi-Fi, LTE, and 5G radios in hospitals. Compliance raises development costs, yet it also concentrates share among companies able to staff regulatory affairs teams, in turn expanding the Bluetooth Smart and Smart Ready market through wider clinical adoption and reimbursable use cases.
Rising Demand for Location-Based Retail Analytics
Bluetooth Low Energy beacons are the backbone of the retail analytics sector, which is projected to reach USD 11.38 billion by 2032, up from USD 4.68 billion in 2025. Deployments such as Nextome’s sub-meter positioning in grocery chains cut merchandising errors and produce real-time heat maps without requiring shoppers to install applications. Cisco Spaces pairs Bluetooth data with point-of-sale records to assess conversion in near real time, a capability retailers leverage to optimize staffing schedules. Conversion uplift improves further, one academic study cites an 18% rise when promotions are fired within 3 meters of the product shelf. Privacy frameworks such as the GDPR require explicit opt-ins, but the commercial upside still tilts toward analytics adoption that benefits the Bluetooth Smart and Smart Ready market.
Restraint Impact Analysis*
| Restraint | (~) % Impact on CAGR Forecast | Geographic Relevance | Impact Timeline |
|---|---|---|---|
| Security Vulnerabilities in Bluetooth Classic Stack | -0.5% | Global, acute in regions with strict cyber rules | Short term (≤ 2 years) |
| Chip-Level Supply Constraints for Sub-40 nm Nodes | -0.4% | Asia-Pacific foundry corridors | Medium term (2-4 years) |
| Inter-Protocol Interference in Dense RF Environments | -0.3% | Urban North America, Europe, Asia-Pacific | Medium term (2-4 years) |
| Fragmented Firmware Update Ecosystem for OEMs | -0.2% | Global, most severe on Android | Long term (≥ 4 years) |
| Source: Mordor Intelligence | |||
Security Vulnerabilities in Bluetooth Classic Stack
The National Vulnerability Database logged 17 high-severity CVEs tied to the Classic stack in 2025-2026, including exploits in Zephyr, Linux, and Airoha silicon. Associated recalls spanned 2.3 million vehicles, and downgrade attacks persisted in smart-home locks and medical monitors.[2]National Highway Traffic Safety Administration, “Recalls,” NHTSA, nhtsa.gov Although many OEMs are migrating to Bluetooth Low Energy with AES-128 secure connections, roughly 3.2 billion Classic-only devices remain in service, keeping exploit windows open. The risk erodes confidence and clips near-term expansion for the Bluetooth Smart and Smart Ready market until the installed base is refreshed.
Chip-Level Supply Constraints for Sub-40 nm Nodes
Foundries allocate only about 20% of their 22- and 28-nanometer wafer capacity to Bluetooth and true wireless stereo designs, channeling the majority toward higher-margin smartphone and automotive processors. Nordic Semiconductor’s nRF54L production faced 26-week lead times in early 2026, a delay that rippled across wearable and smart-home customers. Samsung Foundry operated at 85% utilization on its 28-nanometer FD-SOI line throughout 2025, leaving little safety stock to buffer unforecasted demand spikes. While the United States is injecting USD 52.7 billion into domestic fabrication through the CHIPS and Science Act, new capacity will not come online before 2028. Tight supply constrains revenue upside and tempers the otherwise positive outlook for the Bluetooth Smart and Smart Ready market.
*Our forecasts treat driver/restraint impacts as directional, not additive. The impact forecasts reflect baseline growth, mix effects, and variable interactions.
Segment Analysis
By Product Type: Smart Devices Extend Their Lead
Bluetooth Smart Devices accounted for 61.32% of 2025 revenue within the Bluetooth Smart and Smart Ready market, a dominance expected to widen under a 3.37% CAGR. Their appeal stems from ultra-low-power profiles that let glucose monitors, asset tags, and fitness trackers operate for years on coin-cell batteries. The Bluetooth Smart and Smart Ready market size for Smart Devices is projected to capture the lion’s share of incremental shipments through 2031 as smartphone operating systems phase out Classic profiles.
Dual-mode Smart Ready Devices, while still vital for automotive infotainment and industrial gateways, face structural headwinds. Classic stacks draw roughly 30 mA of active current compared with sub-5 mA for Bluetooth Low Energy, a disparity that pushes hardware designers toward single-mode silicon. Component suppliers signal the shift, Nordic’s 22-nanometer nRF54L pairs a Cortex-M33 with a RISC-V coprocessor to cut receive currents below 3 µA, while Silicon Labs’ BG29 squeezes 1 MB of Flash into a 2.0 mm × 2.5 mm package for hearing aids. As a result, Smart Ready share recedes, but premium smartphones and laptops will preserve niche volumes where backward compatibility is mandatory.


By Technology: Direction-Finding Fuels Bluetooth 5.1 Growth
Bluetooth Low Energy held 46.36% of shipments in 2025, yet Bluetooth 5.1 clocked the fastest CAGR at 3.97% on the strength of angle-of-arrival ranging for retail, warehousing, and hospital asset management. The Bluetooth Smart and Smart Ready market size tied to Bluetooth 5.1 tags benefits from sub-meter accuracy, enabling it to replace costly ultra-wideband in cost-sensitive scenarios. Legacy Classic retained 28% share, buoyed by automotive hands-free profiles, but growth slowed to 1.2% as LE Audio takes hold.
Bluetooth Mesh reached 12% share and improved under converged Matter firmware, especially in commercial lighting. Bluetooth 5.0 slipped in relevance as new chipsets embrace periodic advertising and channel sounding introduced in Bluetooth 5.4 and 6.0. Texas Instruments, NXP, and Silicon Labs all rolled out 6.0-ready silicon between January 2025 and April 2026, signaling a steep migration curve that keeps the Bluetooth Smart and Smart Ready market momentum intact.
By Application: Clinical Use Cases Drive Healthcare Upside
Wearables accounted for 32.48% of 2025 volumes, but healthcare posted a 3.88% CAGR by shifting from wellness to regulated diagnostics. Audio Streaming for Hearing Aids, standardized by the Bluetooth SIG, cut latency below 20 ms and reduced power draw by 40%, prompting FDA Class II submissions for next-generation hearing aids. The Centers for Medicare and Medicaid Services now reimburses remote patient monitoring at up to USD 60 per enrollee each month, accelerating device installations.[3]Centers for Medicare and Medicaid Services, “CMS.gov,” CMS, cms.gov
Smart Home held 22% share, advancing 2.8% on Bluetooth Mesh lighting and HVAC controls that bypass Wi-Fi infrastructure. Automotive applications captured 18% of shipments, climbing 3.2% thanks to digital keys that blend Bluetooth Low Energy with ultra-wideband. Industrial automation reached 12% share, fueled by predictive-maintenance sensors that plug directly into edge AI platforms, a trend that deepens the installed base and validates long-life battery roadmaps across the Bluetooth Smart and Smart Ready industry.

By End-User Industry: Reimbursement Transforms Healthcare Demand
Consumer electronics maintained the largest share at 39.31% in 2025, but healthcare is the growth engine with a 3.91% CAGR. Medicare and private insurers in the United States, along with parallel programs in the EU, reimburse Bluetooth-connected blood-pressure cuffs, pulse oximeters, and glucose monitors, directly boosting device volumes. The Bluetooth Smart and Smart Ready market share in healthcare will therefore grow faster than in any other vertical through 2031.
Automotive maintained a 16% share and is tracking a 3.5% CAGR as digital keys are filtering down from luxury to mid-range models. Industrial end users accounted for 14% of 2025 shipments, up 2.6%, driven by predictive maintenance and energy monitoring. Retail closed 2025 at 11% share and a 3% CAGR as foot-traffic analytics gain traction. Across industries, standards bodies continue to raise cyber requirements, tilting demand toward certified chipsets and long-term software support, both hallmarks of the Bluetooth Smart and Smart Ready markets.
Geography Analysis
Asia-Pacific led the Bluetooth Smart and Smart Ready market, accounting for 38.83% of revenue in 2025 and a 3.83% CAGR outlook. China mandated Bluetooth Low Energy in all smart-home appliances sold after January 2025, driving adoption across OEMs such as Midea and Haier.[4]Ministry of Industry and Information Technology, “Smart-Home Appliance Notice,” MIIT, miit.gov.cn Japanese electronics giants embedded LE Audio in 2025 model-year televisions, while South Korea’s Galaxy S25 family moved 42 million units in Q1 2026. India’s draft standards for Bluetooth medical devices, released in March 2026, will streamline approvals and widen the addressable base for connected glucose monitors.
North America secured 28% share and a 2.9% CAGR. The FDA’s stricter cybersecurity guidance lifted compliance spend but also cleared the path for reimbursable remote patient monitoring. U.S. semiconductor policy channels USD 52.7 billion into domestic fabs, yet sub-40-nanometer capacity will not come online until 2028, keeping most Bluetooth SOCs tied to Taiwan and South Korea in the interim. Canada harmonized power limits with FCC rules, and Mexico’s vehicle production line fitted 1.8 million cars with Bluetooth digital keys in 2025.
Europe finished 2025 with 24% revenue and a 2.7% CAGR. The Radio Equipment Directive’s August 2025 cyber clause now applies to every Bluetooth radio sold in the bloc, from medical sensors to smart-home hubs. German automakers adopted Bluetooth 6.0 channel sounding to guard against relay attacks, and the NHS piloted Bluetooth-connected monitors for 120,000 chronic-care patients. South America, the Middle East, and Africa combined for 10% share and a 2.4% CAGR, with Brazil’s Anatel harmonizing certification to ETSI EN 300 328 in April 2025.

Competitive Landscape
Competition in the Bluetooth Smart and Smart Ready market is moderately concentrated, with the top five chip vendors accounting for roughly 62% of 2025 revenue. Qualcomm’s FastConnect 8800 merges Wi-Fi 8 and Bluetooth 7.0 High Data Throughput at up to 7.5 Mbps, a triple-speed boost targeting AR glasses and lossless earbuds. Nordic’s nRF54LM20B layers an Axon neural engine and 2 MB of embedded flash on a 22-nanometer node, bringing edge inference to industrial sensors. Texas Instruments’ CC274xR-Q1 chips carry ISO 21434 certification for automotive digital keys and include power management to lower system cost.
NXP’s IW623 unites tri-band Wi-Fi 6E with Bluetooth Low Energy Audio on a single die, shrinking board real estate for smart-home hubs and car infotainment systems. Silicon Labs, meanwhile, addresses size-constrained medical wearables with the 2.0 mm × 2.5 mm BG29 SOC. Start-ups such as Atmosic pursue battery-less operation by harvesting RF, photovoltaic, and thermal energy, a concept still limited to pilot programs but promising for future extensions of the Bluetooth Smart and Smart Ready market.
Strategic positioning revolves around integration depth, AI accelerators, and sub-1 µA standby currents. Vendors capable of shipping multi-protocol, AI-ready silicon before 2028 will likely consolidate share as end-markets demand smaller, smarter, and more secure connectivity blocks. At the same time, supply-chain dual-sourcing, exemplified by Qualcomm qualifying both TSMC and Samsung Foundry, has become a prerequisite for high-volume contracts.
Bluetooth Smart And Smart Ready Industry Leaders
Qualcomm Inc.
Nordic Semiconductor ASA
Texas Instruments Incorporated
Broadcom Inc.
Silicon Laboratories Inc.
- *Disclaimer: Major Players sorted in no particular order

Recent Industry Developments
- April 2026: NXP Semiconductors introduced the MCX W72 and KW47 wireless MCUs, adding Bluetooth 6.0 channel sounding for automotive digital keys.
- March 2026: NXP launched the i.MX 93W SiP, combining an Arm Cortex-A55 with tri-radio connectivity for industrial edge gateways.
- March 2026: Nordic Semiconductor rolled out the entry-level nRF54LS05 family on a 22-nanometer process for cost-sensitive wearables.
- February 2026: Qualcomm submitted Linux kernel patches that offload hands-free profile processing on the QCA2066 and WCN6855 chipsets.


Global Bluetooth Smart And Smart Ready Market Report Scope
The Bluetooth Smart and Smart Ready market comprises the development, integration, and commercialization of Bluetooth-enabled wireless connectivity solutions designed for low-power data communication across connected devices and intelligent systems. Bluetooth Smart devices operate exclusively on Bluetooth Low Energy (BLE) to enable energy-efficient communication, while Bluetooth Smart Ready devices support both Bluetooth Classic and BLE, enabling compatibility with legacy and next-generation connected ecosystems. These technologies facilitate short-range wireless communication with optimized power consumption, interoperability, and real-time data exchange across consumer, commercial, and industrial applications.
The Bluetooth Smart and Smart Ready Market Report is Segmented by Product Type (Bluetooth Smart Devices, and Bluetooth Smart Ready Devices), Technology (Bluetooth Low Energy, Bluetooth Classic, Bluetooth Mesh, Bluetooth 5.0, and Bluetooth 5.1), Application (Healthcare, Wearable Devices, Smart Home, Automotive, and Industrial Automation), End-User Industry (Consumer Electronics, Healthcare, Automotive, and Industrial, Retail), and Geography (North America, South America, Europe, Asia-Pacific, and Middle East and Africa). The Market Forecasts are Provided in Terms of Value (USD).
| Bluetooth Smart Devices |
| Bluetooth Smart Ready Devices |
| Industrial Robots |
| Collaborative Robots |
| Professional Service Robots |
| Domestic Service Robots |
| Humanoid Robots |
| Bluetooth Low Energy |
| Bluetooth Classic |
| Bluetooth Mesh |
| Bluetooth 5.0 |
| Bluetooth 5.1 |
| Healthcare |
| Wearable Devices |
| Smart Home |
| Automotive |
| Industrial Automation |
| Consumer Electronics |
| Healthcare |
| Automotive |
| Industrial |
| Retail |
| North America | United States | |
| Canada | ||
| Mexico | ||
| South America | Brazil | |
| Argentina | ||
| Rest of South America | ||
| Europe | United Kingdom | |
| Germany | ||
| France | ||
| Italy | ||
| Rest of Europe | ||
| Asia-Pacific | China | |
| Japan | ||
| India | ||
| South Korea | ||
| Rest of Asia-Pacific | ||
| Middle East and Africa | Middle East | United Arab Emirates |
| Saudi Arabia | ||
| Rest of Middle East | ||
| Africa | South Africa | |
| Egypt | ||
| Rest of Africa | ||
| By Product Type | Bluetooth Smart Devices | ||
| Bluetooth Smart Ready Devices | |||
| By Robot Type | Industrial Robots | ||
| Collaborative Robots | |||
| Professional Service Robots | |||
| Domestic Service Robots | |||
| Humanoid Robots | |||
| By Technology | Bluetooth Low Energy | ||
| Bluetooth Classic | |||
| Bluetooth Mesh | |||
| Bluetooth 5.0 | |||
| Bluetooth 5.1 | |||
| By Application | Healthcare | ||
| Wearable Devices | |||
| Smart Home | |||
| Automotive | |||
| Industrial Automation | |||
| By End-User Industry | Consumer Electronics | ||
| Healthcare | |||
| Automotive | |||
| Industrial | |||
| Retail | |||
| By Geography | North America | United States | |
| Canada | |||
| Mexico | |||
| South America | Brazil | ||
| Argentina | |||
| Rest of South America | |||
| Europe | United Kingdom | ||
| Germany | |||
| France | |||
| Italy | |||
| Rest of Europe | |||
| Asia-Pacific | China | ||
| Japan | |||
| India | |||
| South Korea | |||
| Rest of Asia-Pacific | |||
| Middle East and Africa | Middle East | United Arab Emirates | |
| Saudi Arabia | |||
| Rest of Middle East | |||
| Africa | South Africa | ||
| Egypt | |||
| Rest of Africa | |||


Key Questions Answered in the Report
What is the current Bluetooth Smart and Smart Ready market size and how fast is it growing?
The Bluetooth Smart and Smart Ready market size stands at USD 5.52 billion in 2026 and is on track to reach USD 6.39 billion by 2031, reflecting a 2.97% CAGR.
Which product category leads in share within the Bluetooth Smart and Smart Ready market?
Bluetooth Smart Devices held 61.32% of 2025 revenue, far ahead of Smart Ready Devices, and are set to widen their lead through 2031.
Why is healthcare the fastest-growing application area?
Regulatory frameworks in the United States and European Union now reimburse Bluetooth-connected diagnostics, pushing healthcare devices to the fastest 3.88% CAGR among applications during 2026-2031.
How are smartphone makers accelerating the shift to LE Audio?
Samsung's Galaxy S25 and Google's Android 16 mandate LE Audio functions such as Auracast and multi-stream audio, driving broad handset compatibility and, by extension, accessory demand.
What supply risks threaten Bluetooth SOC availability?
Sub-40 nm wafer capacity is tight because foundries prioritize higher-margin CPUs and automotive MCUs, leading to lead times exceeding six months for some Bluetooth chip families.
Which regions will contribute most to future market growth?
Asia-Pacific will remain the growth engine with a 3.83% CAGR, buoyed by mandates for Bluetooth Low Energy in smart appliances and large volumes of connected consumer electronics.
Page last updated on:


