
Bleaching Clay Market Size and Share
Market Overview
| Study Period | 2020 - 2031 |
|---|---|
| Market Volume (2026) | 2.49 Million tons |
| Market Volume (2031) | 3.12 Million tons |
| Growth Rate (2026 - 2031) | 4.62 % |
| Fastest Growing Market | Asia Pacific |
| Largest Market | Asia Pacific |
| Market Concentration | Medium |
Major Players *Disclaimer: Major Players sorted in no particular order Image © Mordor Intelligence. Reuse requires attribution under CC BY 4.0. | |
Bleaching Clay Market Analysis by Mordor Intelligence
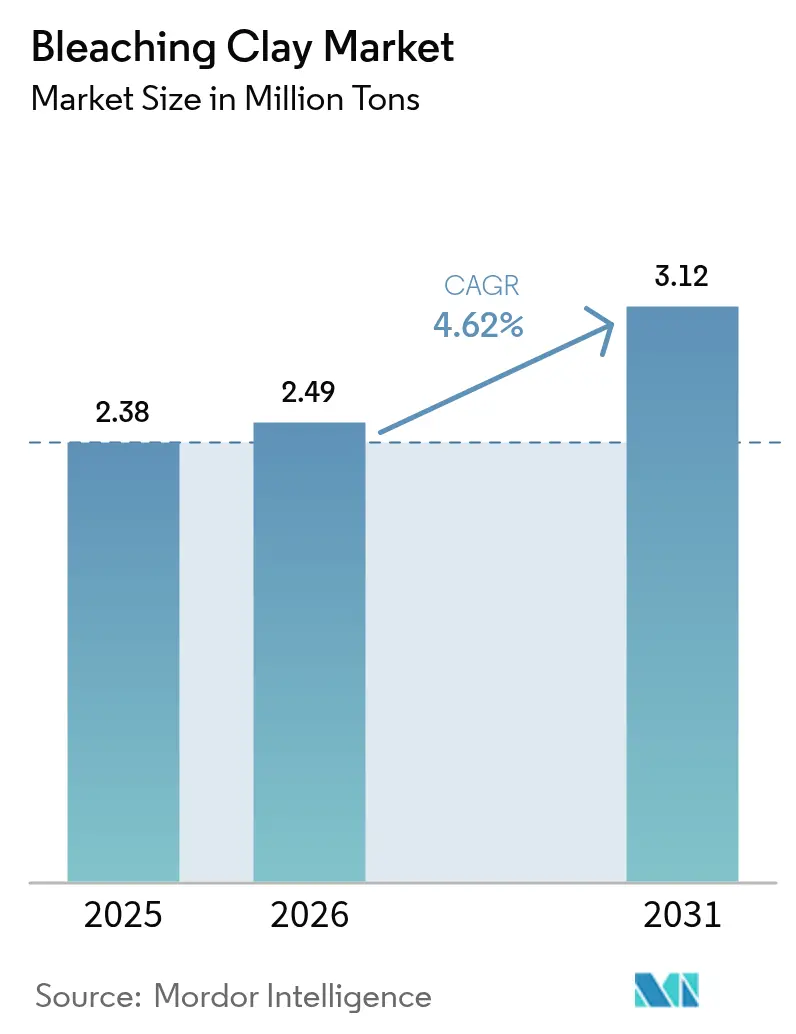
The Bleaching Clay market size is expected to grow from 2.38 Million tons in 2025 to 2.49 Million tons in 2026 and is forecast to reach 3.12 Million tons by 2031 at 4.62% CAGR over 2026-2031. This growth reflects steady expansion in refined vegetable oil production, rising adoption in biodiesel purification, and new uses in premium cosmetics. Fuller's Earth, notable for its low oil-loss rate, remains the dominant product type, while activated clays record the quickest uptake because refiners need higher adsorption capacity for specialty oils. Asia-Pacific leads the bleaching clay market with 47.29% volume share in 2024 as Chinese and Indian refineries scale capacity, yet North America and Europe steer high-margin niches such as pharmaceutical-grade oils and ultra-low-sulfur lubricants. Despite price pressure from bentonite cost swings, players offset margin risks through technical differentiation, recycling of spent bleaching earth, and selective price rises. Environmental regulation—especially EU rules classifying spent bleaching earth as hazardous waste—tightens operational requirements but fuels innovation in closed-loop processing where up to 85% biodiesel yield has been demonstrated from recovered oil.
Key Report Takeaways
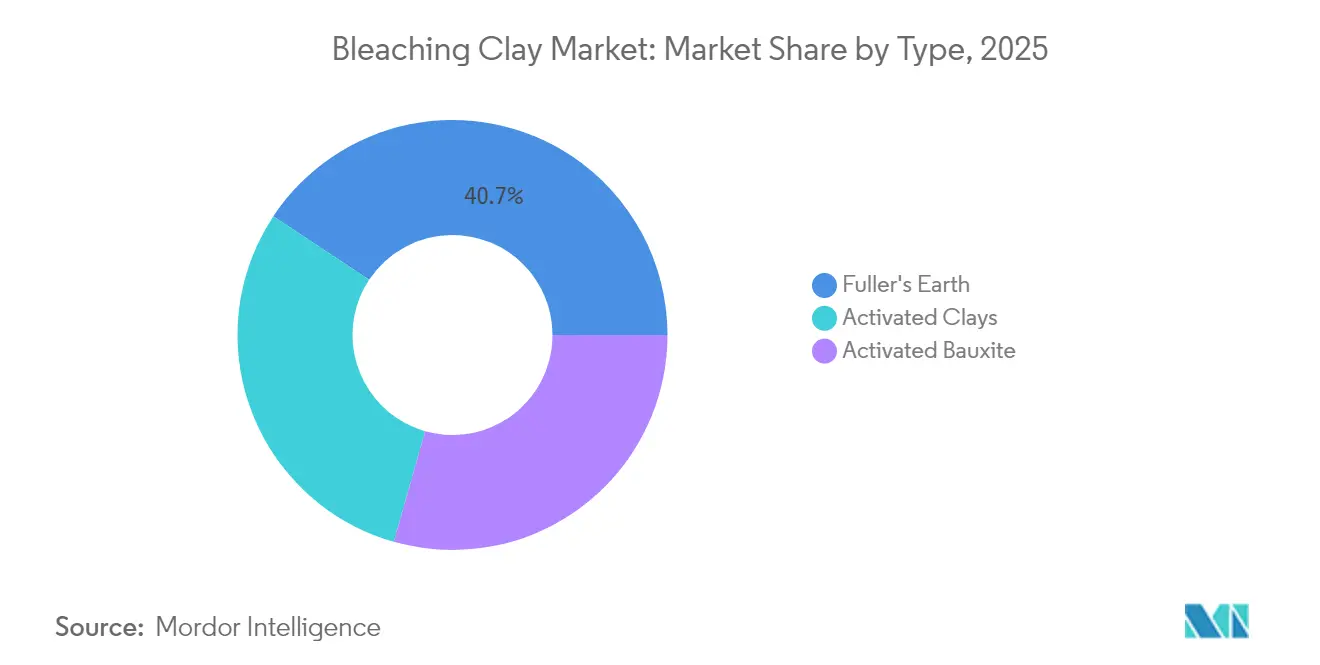
- By type, Fuller's Earth commanded 40.68% of bleaching clay market share in 2025, while activated clays posted the highest projected growth at 5.21% CAGR through 2031.
- By application, vegetable oil and animal fats accounted for 85.30% share of the bleaching clay market size in 2025 and is advancing at a 5.43% CAGR between 2026 and 2031.
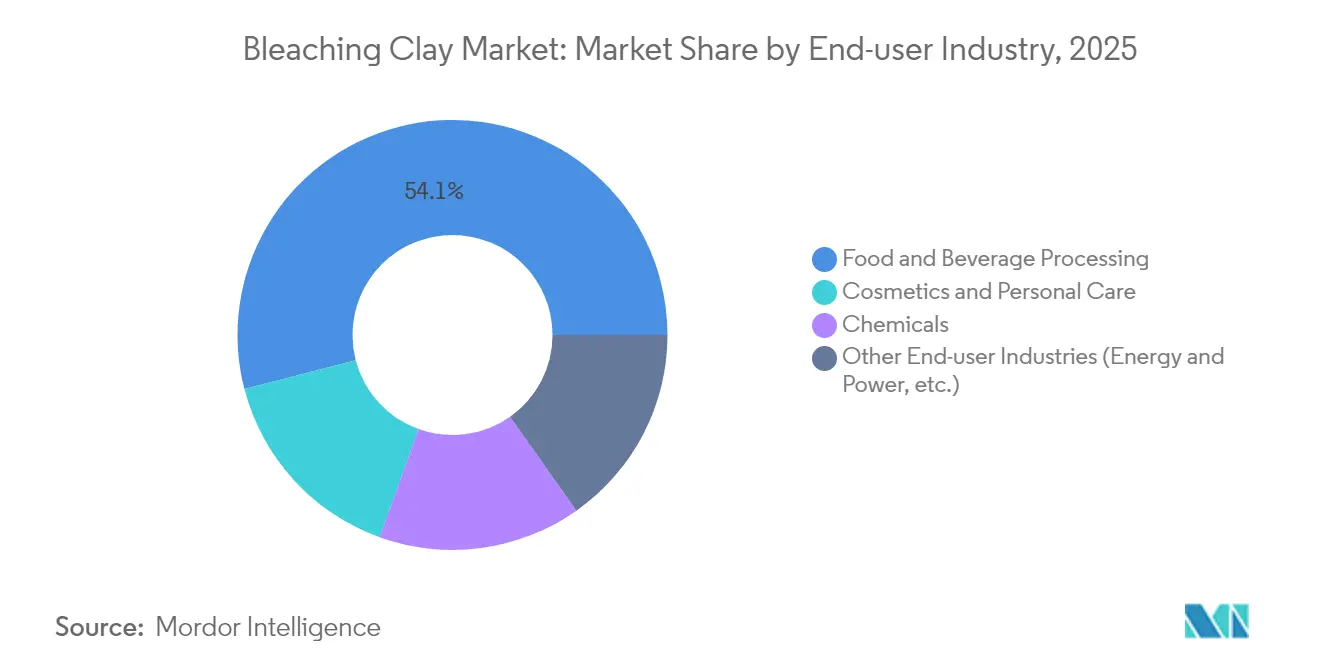
- By end-user, food and beverage processing held 54.05% share of the bleaching clay market size in 2025, while cosmetics and personal care is the fastest growing at 5.02% CAGR to 2031.
- By geography, Asia-Pacific contributed 47.10% volume share in 2025 and is growing at 4.95% CAGR to 2031.
Note: Market size and forecast figures in this report are generated using Mordor Intelligence’s proprietary estimation framework, updated with the latest available data and insights as of 2026.
Global Bleaching Clay Market Trends and Insights
Drivers Impact Analysis*
| Driver | (~) % Impact on CAGR Forecast | Geographic Relevance | Impact Timeline |
|---|---|---|---|
| Accelerating Consumption of Refined Vegetable Oils | +1.2% | Global, with APAC leading growth | Medium term (2-4 years) |
| Rising Demand from Cosmetics and Personal Care Formulations | +0.9% | North America and EU, expanding to APAC | Long term (≥ 4 years) |
| Growth Of Biodiesel and Renewable Diesel Refining | +0.8% | Global, with EU and North America leading | Medium term (2-4 years) |
| Increasing Need for Ultra-Low-Sulfur Mineral Oils and Lubricants | +0.7% | Global, driven by automotive regulations | Short term (≤ 2 years) |
| Pharmaceutical-Grade Cannabinoid Oil Purification Adoption | +0.6% | North America, expanding to EU | Long term (≥ 4 years) |
| Local Beneficiation of Bentonite Deposits In Africa | +0.5% | Africa, with spillover to global supply chains | Long term (≥ 4 years) |
| Source: Mordor Intelligence | |||
Accelerating Consumption of Refined Vegetable Oils
Global oilseed output is set to touch 680 million tons in the 2024/25 season, lifting demand for specialized bleaching formulations that remove chlorophyll, carotenoids, and trace metals from solvent-extracted oils. Asia-Pacific refiners, supported by favorable logistics and expanding crushing capacity, represent the largest incremental volume. The segment also benefits from dietary shifts toward soybean and sunflower oil, both of which require higher clay dosage rates than cold-pressed alternatives. Producers that can tailor pore structure for specific oil chemistries capture procurement preference, especially as OPEC projects 19.2 million barrels per day of new refining capacity in developing regions by 2050[1]Organisation of the Petroleum Exporting Countries, “World Oil Outlook 2045,” opec.org. This structural uplift secures long-run volume visibility for the bleaching clay market.
Rising Demand from Cosmetics and Personal Care Formulations
Cosmetic brands increasingly replace synthetic absorbents with naturally derived clays to meet clean-label expectations and regulatory pressure over microplastics. High surface area and cation exchange capacity allow bleaching clays to act both as oil absorbers and as stabilizers for ultraviolet filters, encouraging wider use in sun-care and matte-finish products. Clariant’s acquisition of Lucas Meyer Cosmetics strengthens value-added supply for this high-margin end-use, evidenced by the firm’s Care Chemicals profitability increase in 2024. Premium formulations demand low-heavy-metal content clays, which supports price differentiation and compensates for the smaller tonnage relative to edible oils.
Growth of Biodiesel and Renewable Diesel Refining
Mandatory blending targets in the EU, United States, and parts of Asia raise feedstock purification needs. Specialty grades such as TONSIL™ remove phosphorus and metals that shorten catalyst life during transesterification, directly impacting plant economics. Research confirms that spent bleaching earth can itself convert to biodiesel with up to 85% yield through in-situ esterification, creating a secondary revenue stream and reducing disposal liabilities. This dual benefit reinforces the bleaching clay market as a circular-economy enabler.
Increasing Need for Ultra-Low-Sulfur Mineral Oils and Lubricants
Tighter automotive and industrial emission norms compel lubricant formulators to cut sulfur and trace metal content to parts-per-million levels. Activated bentonite grades provide efficient adsorption without impairing viscosity index modifiers, making them essential for multigrade hydraulic fluids and synthetic base stocks. The technical barrier to replicate such performance protects incumbents and supports premium pricing.
Restraints Impact Analysis*
| Restraint | (~) % Impact on CAGR Forecast | Geographic Relevance | Impact Timeline |
|---|---|---|---|
| Strict Environmental Regulations on Mining and Acid Activation Waste | -0.4% | Global, with EU leading regulatory stringency | Short term (≤ 2 years) |
| Competition from Synthetic Adsorbents (Silica Gels) | -0.3% | North America and EU, expanding globally | Medium term (2-4 years) |
| Volatile Bentonite Prices Due to Supply Concentration | -0.2% | Global, with regional supply chain impacts | Short term (≤ 2 years) |
| Source: Mordor Intelligence | |||
Strict Environmental Regulations on Mining and Acid Activation Waste
EPA discharge revisions and EU hazardous waste designation for spent bleaching earth add USD 50–100 per ton to processing costs, prompting facilities to invest in zero-liquid-discharge systems[2]United States Environmental Protection Agency, “Effluent Guidelines for Mineral Mining and Processing,” epa.gov[. Smaller operators struggle to finance such upgrades, leading to capacity rationalization and potential consolidation. Conversely, the push for sustainability accelerates R&D into solvent extraction and pyrolysis routes that recover up to 35% oil from certain clay types, cutting waste volumes and generating secondary products.
Competition from Synthetic Adsorbents (Silica Gels)
Engineered silica offers narrow pore-size distribution and consistent batch quality attractive to pharmaceutical and specialty chemical processors. As clay processors shoulder higher compliance costs, the price gap narrows, increasing substitution risk in high-purity applications. To defend share, leading suppliers develop hybrid systems that anchor silica nanoparticles inside clay matrices, delivering performance parity while retaining a natural product narrative that resonates with brand owners focused on sustainability..
*Our forecasts treat driver/restraint impacts as directional, not additive. The impact forecasts reflect baseline growth, mix effects, and variable interactions.
Segment Analysis
By Type: Fuller's Earth Dominates Through Superior Oil Retention
Fuller's Earth captured 40.68% of bleaching clay market share in 2025 by delivering 15-20% lower oil loss than attapulgite or sepiolite alternatives, a saving that can reach USD 3 million annually for a refinery processing 1 million tons of soybean oil. The segment benefits from abundant global deposits and simple activation requirements, supporting cost leadership. Activated clays, however, are forecast to outpace Fuller's Earth at 5.21% CAGR as producers refine acid activation to raise surface area beyond 250 m²/g, unlocking higher adsorption capacity essential for pharmaceutical and cosmetic oils. Over the forecast period, refiners will balance unit cost with performance, keeping both segments relevant to the bleaching clay market.
Activated bauxite serves a focused subset of petroleum applications where processing temperatures exceed 200 °C. Although supply is limited, its stable lattice earns preference in transformer oil and aviation lubricant purification. Continued R&D shows that optimal bleaching capacity lies in a 50–60 Å average pore radius, encouraging investments in controlled activation technology that narrows performance variance. These advances underpin enduring, if modest, contribution from niche grades to the bleaching clay market size.



By Application: Vegetable Oil Processing Drives Market Leadership
Vegetable oil and animal fats retained an 85.30% share of the bleaching clay market size in 2025 while registering a 5.43% CAGR outlook, underscoring the critical role in global nutrition and biofuel supply chains. Solvent-extracted soybean, palm, and sunflower oils need higher clay dosage than expeller-pressed alternatives, and expanding biodiesel mandates will lift demand further. Industrial oil users, notably metalworking fluids, rely on clays for stabilizing additive packages and extending fluid life, adding incremental volume though at lower tonnage.
Mineral oils and waxes require formulations tuned for hydrocarbon matrices. Blending of renewable diesel with fossil feedstock has created hybrid streams demanding versatile adsorbents that cope with divergent polarity. Spent bleaching earth from vegetable oils is increasingly valorized as feedstock for in-situ biodiesel production at 85% conversion efficiency, aligning purification with circular-economy objectives and adding downstream value for processors.
By End-user Industry: Food Processing Leads While Cosmetics Accelerates
Food and beverage processing held 54.05% share in 2025 because edible oil safety regulations enforce strict limits on chlorophyll, peroxide value, and trace metals. Compliance requires certified food-grade clays free of aflatoxins and heavy metals, supporting premium positioning for top suppliers. Cosmetics and personal care, though smaller in tonnage, is gaining at 5.02% CAGR as brands adopt natural multifunctional ingredients. Clay’s dual role as adsorbent and active skin-care component allows formulators to reduce ingredient lists, dovetailing with minimalist product trends.
The chemicals segment spans catalyst supports, pigment carriers, and specialized adsorbents for petrochemical streams. Rising demand for low-aromatic transformer oils and biobased hydraulic fluids creates cross-selling potential. Other industries, including energy storage and wastewater treatment, experiment with modified clays for ion removal and thermal insulation, hinting at diversified growth avenues for the bleaching clay market.
Geography Analysis
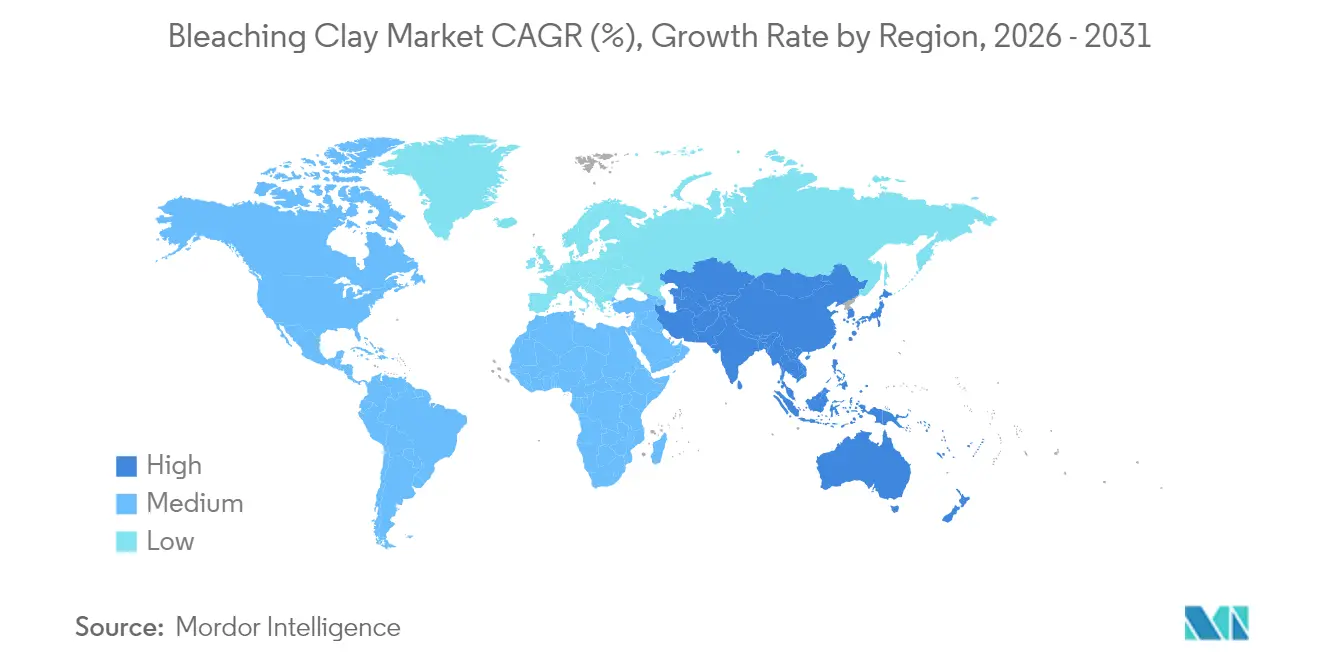
Asia-Pacific’s 47.10% volume share in 2025 stems from vast refining footprints in China, India, Indonesia, and Malaysia, each benefitting from proximity to oilseed production and large consumer markets. The region’s 4.95% CAGR forecast links to OPEC-projected incremental refining capacity of up to 4.9 million barrels per day by 2028. Indonesia alone uses roughly 200,000 tons of bentonite annually in cooking-oil refining, illustrating the scale advantage that supports dedicated clay activation facilities. Local universities collaborate with industry on spent earth recycling methods achieving 85% biodiesel yield, reinforcing supply security and environmental compliance.
North America combines technological leadership with regulatory discipline. Refiners use low-metal clays to protect hydrotreating catalysts in renewable diesel, and lubricant blenders demand grades delivering parts-per-billion sulfur removal. Oil-Dri’s price adjustment of 5–8% in late 2024 shows the region’s ability to pass on cost inflation amid persistent demand. Europe’s stringent waste regulation raises compliance costs yet accelerates investment in closed-loop processing. Recycling techniques that recover 35% oil from sepiolite illustrate the region’s innovation pace. High-precision German and Swiss cosmetic manufacturers source ultra-pure clays under pharmacopeia specifications, adding premium tonnage.
South America benefits from Brazil’s dominance in soybean cultivation, offering synergies between crushing capacity and local clay demand. Middle-East and Africa present emerging potentials, especially where governments push for downstream mineral processing. South Africa’s mining contribution of 8.3% GDP and Nigeria’s sector modernization foster local beneficiation that can reduce import reliance. These developments diversify the bleaching clay market supply chain and add resilience against regional disruptions.

Regulatory Landscape
Regulation for bleaching clays spans food additive and feed-use requirements, industrial effluent controls, and waste-management obligations tied to spent bleaching earth (SBE). In the United States, the FDA provides conditions under which spent bleaching clay may be permitted in animal feed and drinking water applications, while broader environmental compliance is influenced by EPA effluent guidelines for mineral mining and processing that affect clay extraction and activation operations.
In Asia, product and trade compliance is shaped by national standards and customs classification. China maintains GB 25571-2011 as a National Food Safety Standard for activated clay used as a food additive, which reinforces demand for consistent impurity control (for example, heavy metals) in food-grade material. In India, customs classification disputes distinguishing processed activated bleaching earth (for example, under CTH 3802.90) from natural bentonite (under 2508.10) highlight how HS/CTH alignment can affect duty treatment and documentation, influencing sourcing decisions between imported processed grades and locally activated material.
Value Chain Analysis
The bleaching clay value chain starts with mining and beneficiation of raw clay minerals (commonly bentonite and, in some regions, Fuller's earth or other absorbent clays), followed by crushing, drying, and grinding to target particle sizes. The key value-add step is activation, typically acid activation using mineral acids such as sulfuric acid or hydrochloric acid, then washing and neutralization, drying, and milling to produce grades tailored to edible oils, biodiesel feedstocks, lubricants, and specialty applications. Quality control and certification (for food and high-purity uses) are integral midstream activities because refiners and formulators procure to defined performance and contaminant limits.
Downstream, products move via bulk bags, bags, or bulk shipments to vegetable oil refineries, biodiesel and renewable diesel plants, and industrial users, with technical service to support dosage optimization and filtration performance. Post-use handling of spent bleaching earth has become a distinct node in the chain, with recovery routes such as oil extraction and conversion into biodiesel strengthening recycling and waste-compliance capabilities as competitive differentiators. Integrated producers and regional specialists compete on mine-to-market logistics, proximity to refinery hubs (notably in Asia-Pacific), and the ability to manage input volatility (for example, activation acid and freight) while maintaining consistent adsorption performance.
Competitive Landscape
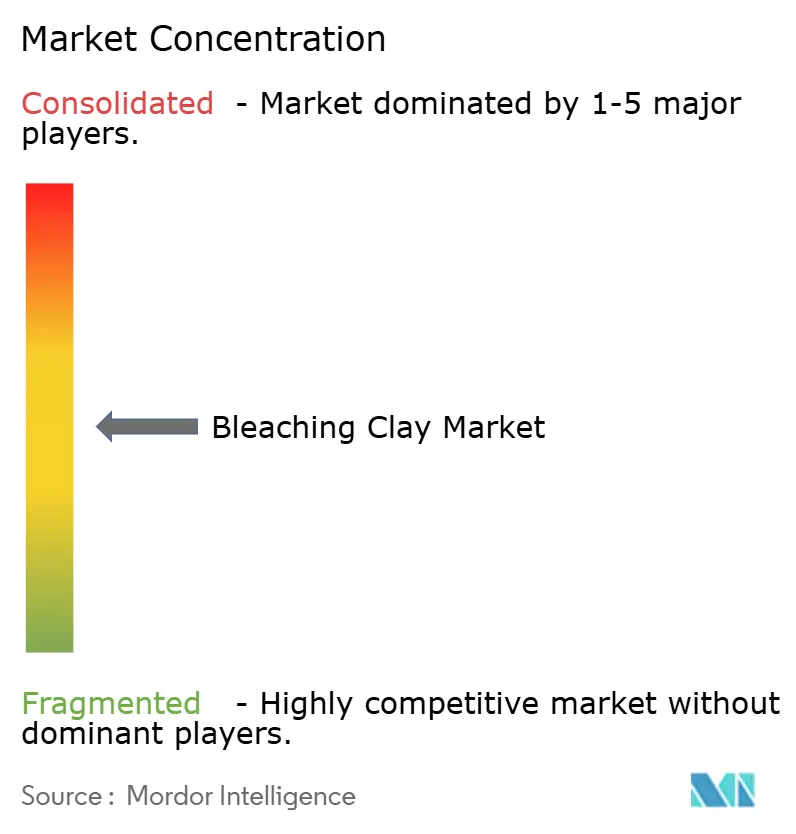
The bleaching clay market remains moderately fragmented. Clariant, Oil-Dri, and Minerals Technologies together hold about 28% global volume, leveraging mine-to-market integration, technical service networks, and proprietary activation processes. Clariant reported a 16.4% EBITDA margin in Q4 2024 thanks to strong Care Chemicals demand, illustrating resilience in specialty niches. Oil-Dri’s November 2024 price increase reflected feedstock inflation but also confidence in product differentiation. Minerals Technologies posted record Q1 2024 earnings driven by Consumer and Specialties, confirming that premium positioning yields margin uplift.
Regional specialists, such as Taiko Clay in Malaysia and Refoil Earth in India, defend share through localized logistics and quick product customization. African entrants aim to undercut landed cost for APAC customers by processing bentonite near the mine mouth. Competitive tactics include hybrid product development, where natural clay carriers host engineered silica, and investment in spent earth recycling plants that convert waste to sellable biodiesel.
Threats arise from synthetic adsorbent innovators offering tighter performance tolerances attractive to pharmaceutical users. In response, incumbents highlight the lower carbon footprint of natural clays and publish lifecycle assessment data to satisfy customer ESG audits. Long-term supply agreements with vegetable-oil majors provide volume stability, allowing continuous R&D funding despite commodity price swings.
Bleaching Clay Industry Leaders
Clariant AG
Taiko Clay Marketing
Oil-Dri Corporation of America
Ashapura Group
U.S. Silica
- *Disclaimer: Major Players sorted in no particular order

Market Opportunities and Future Outlook
Waste and circularity programs around spent bleaching earth (SBE) represent a clear whitespace for suppliers that can pair adsorption performance with compliant end-of-life pathways. The market already shows technical viability for recovery, including routes that recover oil from certain clay types and demonstrated biodiesel yield of up to 85% from recovered oil. This creates room for service-led offerings, such as collection, de-oiling, and valorization, alongside clay supply, particularly in regions where SBE is treated as hazardous waste and disposal costs are material.
A second opportunity is in premium and regulated applications where consistency and impurity control drive procurement decisions over simple unit cost. Food-grade specifications, for example China’s GB 25571-2011 for activated clay used as a food additive, and demand pull from higher-margin uses such as cosmetics and pharmaceutical-grade oils support differentiated activated clays with controlled pore structure and low heavy-metal content. On the supply side, customs classification sensitivity between processed activated bleaching earth and natural bentonite, highlighted by Indian customs treatment of activated bleaching earth versus raw bentonite, favors suppliers that can localize activation near demand centers, tighten documentation, and reduce exposure to cross-border duty and logistics volatility.
Recent Industry Developments
- June 2026: Oil-Dri Corporation of America announced price increases across most of its product portfolio, communicated as taking effect during the first quarter of its fiscal year 2027, to address higher external costs such as freight and resin-based packaging. For bleaching clay and related adsorbents, the update signals continued cost inflation and reinforces the importance of pricing power and product differentiation in maintaining margins.
- May 2026: Ashapura Minechem disclosed that its bleaching clay division performance was pressured by a sharp rise in sulphuric acid prices, a key input for acid activation. The update underscores how activation-chemicals volatility can quickly flow into cost of goods and supports procurement and process optimization as a near-term lever for producers competing in price-sensitive edible-oil supply chains.
- June 2024: Clariant introduced Geko clay, a specialized molding material for the foundry industry, expanding its clay-based portfolio beyond core purification uses. The launch highlights continued product development investment in performance clays and supports cross-industry platform strategies that can enhance scale, R&D leverage, and customer reach for suppliers active in bleaching earth.


Research Methodology Framework and Report Scope
Market Definition and Coverage
This market covers bleaching clays used as adsorbents to remove color bodies and impurities from oils and fats during refining, including natural and activated forms sold into industrial and food processing value chains.
Scope exclusions: Excludes finished edible oils and lubricants, and also excludes non-clay adsorbents such as activated carbon and silica-based media.
Segmentation Overview
- By Type
- Activated Clays
- Fuller's Earth
- Activated Bauxite
- By Application
- Mineral Oil and Waxes
- Industrial Oil
- Vegetable Oil and Animal Fats
- By End-user Industry
- Food and Beverage Processing
- Cosmetics and Personal Care
- Chemicals
- Other End-user Industries (Energy and Power, etc.)
- By Geography
- Asia-Pacific
- China
- Japan
- India
- South Korea
- ASEAN Countries
- Rest of Asia-Pacific
- North America
- United States
- Canada
- Mexico
- Europe
- Germany
- United Kingdom
- France
- Italy
- Spain
- Russia
- NORDIC Countries
- Rest of Europe
- South America
- Brazil
- Argentina
- Rest of South America
- Middle East and Africa
- Saudi Arabia
- South Africa
- Rest of Middle East and Africa
- Asia-Pacific
Data Sources, Market Sizing, and Validation
Desk Research
Desk work starts by building a clean demand map around oil refining activity and clay supply availability. We rely on public sources such as FAOSTAT for oilseed and vegetable oil production, USDA Oilseeds reports for global balances, UN Comtrade for trade flows of clays and related materials, and USGS publications for industrial minerals context.
To make the model usable by region, we also review company annual reports, investor presentations, and technical notes published by industry associations and university journals that discuss bleaching and filtration practices in refining plants. Import and export shipment-level data, plus a news and financials subscription, are used to check price direction and trade timing, specifically to see whether volume growth and value growth move together. Sources listed here are illustrative only, and other public documents were used as well for collection, validation, and clarification.
Primary Interviews and Surveys
Primary work focuses on aligning the demand pool with real usage rates, since clay dosage and replacement cycles vary by crude oil quality and refinery setup. We speak with clay suppliers, edible oil refiners, industrial oil processors, distributors, and process engineers across APAC, EMEA, and the Americas to confirm utilization ranges, typical procurement terms, and how activated grades are priced versus natural grades in refinery operations.
Distribution of primary research fieldwork respondents
| Company type | Respondent position | Region |
|---|---|---|
| Top tier: 33% | CXOs: 19% | APAC: 43% |
| Mid tier: 45% | Functional/Unit leaders: 38% | EMEA: 34% |
| Smaller Players: 22% | Managers: 43% | Americas: 23% |
Market-Sizing & Forecasting
Our core sizing is built through a top-down demand reconstruction where regional edible oil and industrial oil refining volumes are translated into bleaching clay consumption using typical dosage rates and process loss factors. Because the same clay can be used differently across feedstocks, the model is adjusted using inputs such as palm oil and soybean oil output, refinery utilization, share of physically refined versus chemically refined lines, import reliance for activated grades, and observed pricing spreads between standard and high-activity clays.
Results are then pressure-tested with selective bottom-up approximations, including supplier capacity and utilization checks, channel feedback on sales splits, and sampled price per ton ranges tied to grade and application. When local volume signals are weak, gaps are handled through proxy indicators like nearby refining capacity additions and trade inflows, followed by normalization so totals remain consistent with the overall demand pool. Forecasts are developed using scenario analysis supported by short-run trend smoothing, where expected changes in vegetable oil output, industrial lubricant demand, and activation cost drivers are discussed with industry respondents before final assumptions are locked.
Data Validation & Update Cycle
Validation is done in layers so the final numbers stay explainable and repeatable. We cross-check model outputs against independent signals such as refining throughput trends, trade movements, and publicly stated capacity additions, then investigate variances that do not match what the demand indicators imply.
Before sign-off, assumptions are reviewed by another analyst and outliers are challenged using re-contacts with selected interviewees when needed, especially when pricing or dosage ranges move sharply. Reports are refreshed annually, and interim updates are made when material events occur, such as major capacity expansions, policy shifts affecting edible oil imports, or sudden feedstock shocks. Right before publication, a final pass is completed so the delivered view reflects the latest verified data.
Mordor Intelligence's Bleaching Clays Market Size Compared With Other Published Estimates
Published market sizes for bleaching clays can look far apart because the same industry is measured in different units and with different product inclusions. The starting year also affects comparability, especially when edible oil output and clay pricing do not move together.
Activated carbon and silica gel sit outside Mordor Intelligence's scope for this market, which keeps the size tied to clay-only consumption linked back to refining volumes and typical dosage rates. Some other publications include adjacent adsorbents or emphasize revenue with broad price escalation assumptions that are not checked against trade and procurement feedback, which can raise the headline figure quickly.
Benchmark comparison
| Source | Market Size | Gaps in Research Methodology |
|---|---|---|
| Mordor Intelligence | USD 2.49 M (2026) | |
| Global Consultancy A | USD 1.70 B (2025) | Value-first sizing can widen totals when blended pricing is assumed without clear linkage to regional refining throughput, grade mix, and trade-validated volume movement. Coverage is also framed around selected countries, which can change how global rollups are inferred. |
| Industry Publisher B | USD 3.14 B (2024) | Broader inclusion rules and a revenue-only lens can pull in adjacent adsorbents or downstream service components, and the base year can reflect a different currency timing. Long-horizon forecasts may also apply uniform CAGR paths that are not reconciled to edible oil production swings. |
The spread in the table mainly comes from unit choice and what is counted as part of bleaching media, and then how price is carried forward year to year. By anchoring demand to refining activity and sanity-checking with supplier and channel feedback, we keep the final view traceable to a small set of observable inputs.


Key Questions Answered in the Report
What is the current bleaching clay market size and how fast is it growing?
The bleaching clay market size reached 2.49 million tons in 2026 and is projected to rise at a 4.62% CAGR to 3.12 million tons by 2031.
Which region leads the bleaching clay market?
Asia-Pacific holds the leading 47.10% market share thanks to extensive vegetable-oil refining capacity and expanding biodiesel programs.
Why does Fuller's Earth dominate among product types?
Fuller’s Earth offers 15–20% lower oil retention loss than alternative clays, resulting in significant cost savings for edible-oil refineries.
How are environmental regulations shaping the bleaching clay industry?
EU hazardous-waste rules and tighter EPA discharge standards raise compliance costs but stimulate innovations such as spent-earth biodiesel recovery that improve sustainability.
Which end-use sector is growing fastest?
Cosmetics and personal care is expanding at 5.02% CAGR as brands favor natural multifunctional clays for oil control and UV-filter stabilization.
Page last updated on:


 Your data is secure and never sold or shared.


