Biosurfactants Market Size and Share
Market Overview
| Study Period | 2021 - 2031 |
|---|---|
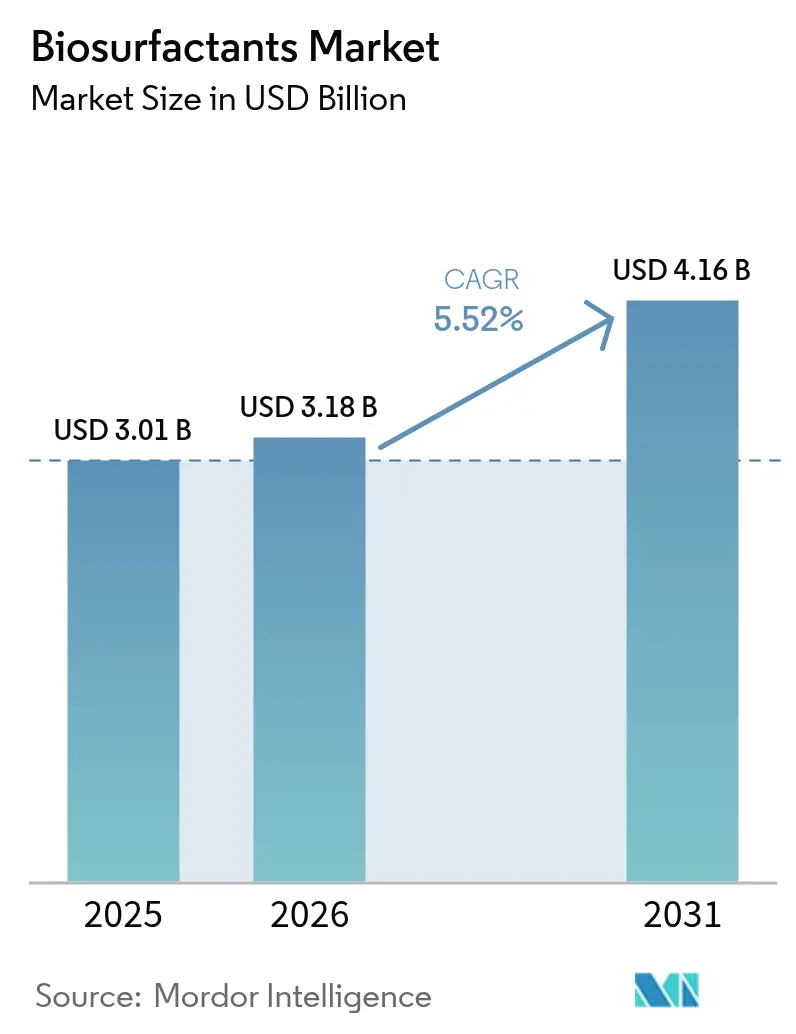
| Market Size (2026) | USD 3.18 Billion |
| Market Size (2031) | USD 4.16 Billion |
| Growth Rate (2026 - 2031) | 5.52% CAGR |
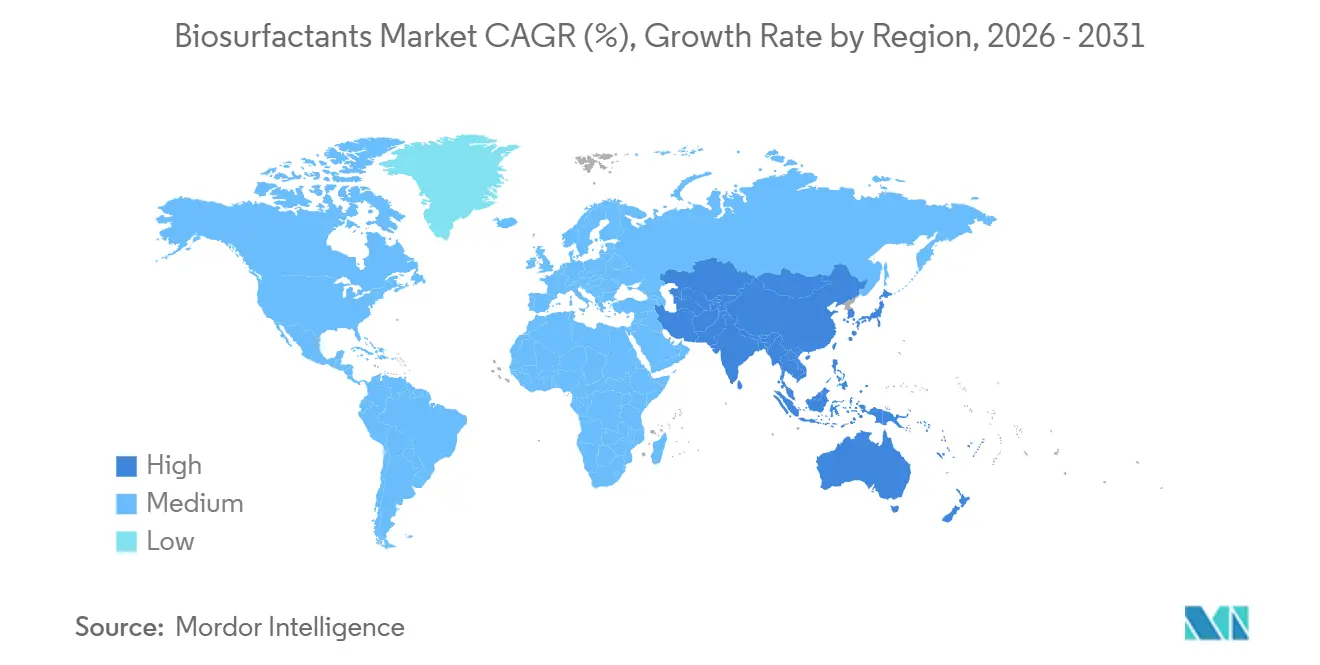
| Fastest Growing Market | Asia Pacific |
| Largest Market | Europe |
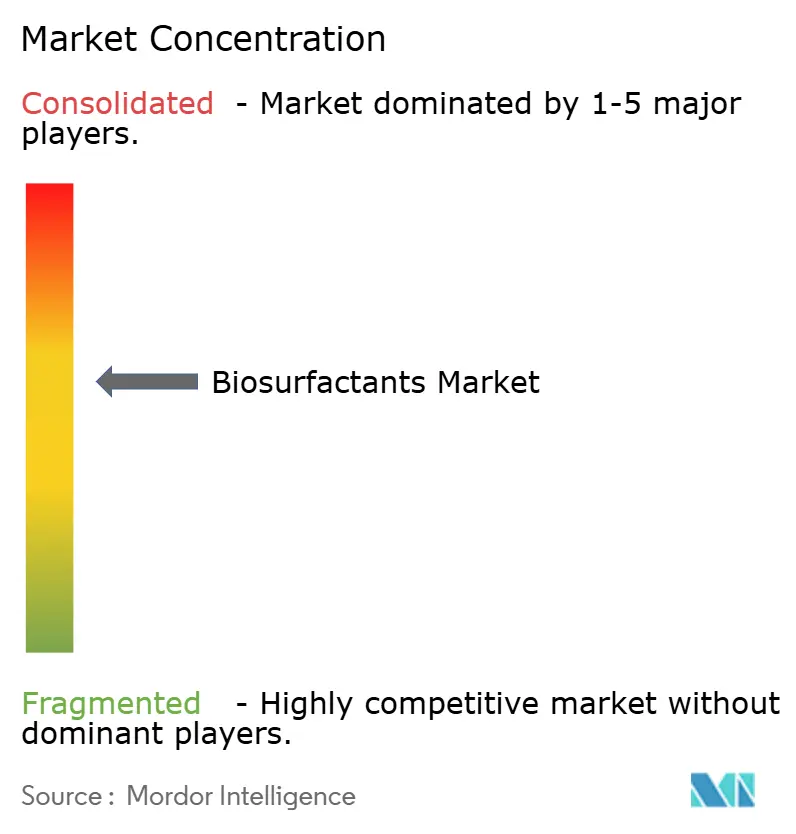
| Market Concentration | Medium |
Major Players *Disclaimer: Major Players sorted in no particular order Image © Mordor Intelligence. Reuse requires attribution under CC BY 4.0. | |
Biosurfactants Market Analysis by Mordor Intelligence
The Biosurfactants Market size is expected to increase from USD 3.01 billion in 2025 to USD 3.18 billion in 2026 and reach USD 4.16 billion by 2031, growing at a CAGR of 5.52% over 2026-2031. Europe accounted for more than half of global sales in 2025 as REACH Annex XVII tightened the rules for poorly biodegradable surfactants, prompting fast substitution. The widening cost parity achieved at Evonik’s Slovenská Ľupča plant cut the historical price premium over petro-surfactants, encouraging detergents and industrial cleaner formulators to scale adoption. FMCG brand commitments, led by Unilever’s pledge to source half of all surfactants from renewables by 2028, underpin long-term offtake contracts. Synthetic-biology strain engineering doubled sophorolipid yields at BASF’s Ludwigshafen site, shortening fermentation cycles and accelerating the move toward designer molecules with tailored hydrophilic–lipophilic balance values. Asia-Pacific’s personal-care boom—particularly in China, India, and fast-growing ASEAN e-commerce channels—sets the pace for volume growth as consumers trade up to “clean beauty” products that depend on mild glycolipids.
Key Report Takeaways
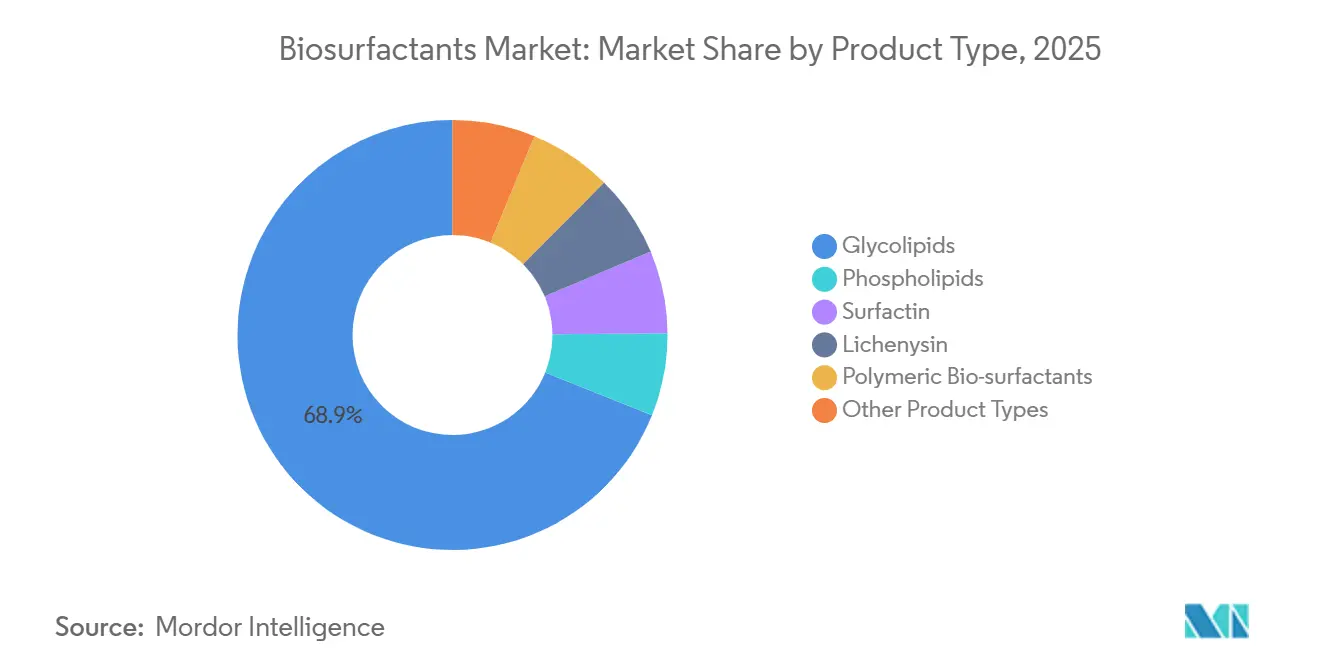
- By product type, glycolipids led with 68.91% revenue share in 2025; the same segment is also advancing at a 5.81% CAGR through 2031.
- By feedstock, vegetable oils accounted for 41.17% of the biosurfactants market share in 2025, while industrial waste glycerol is forecast to expand at a 7.62% CAGR to 2031.
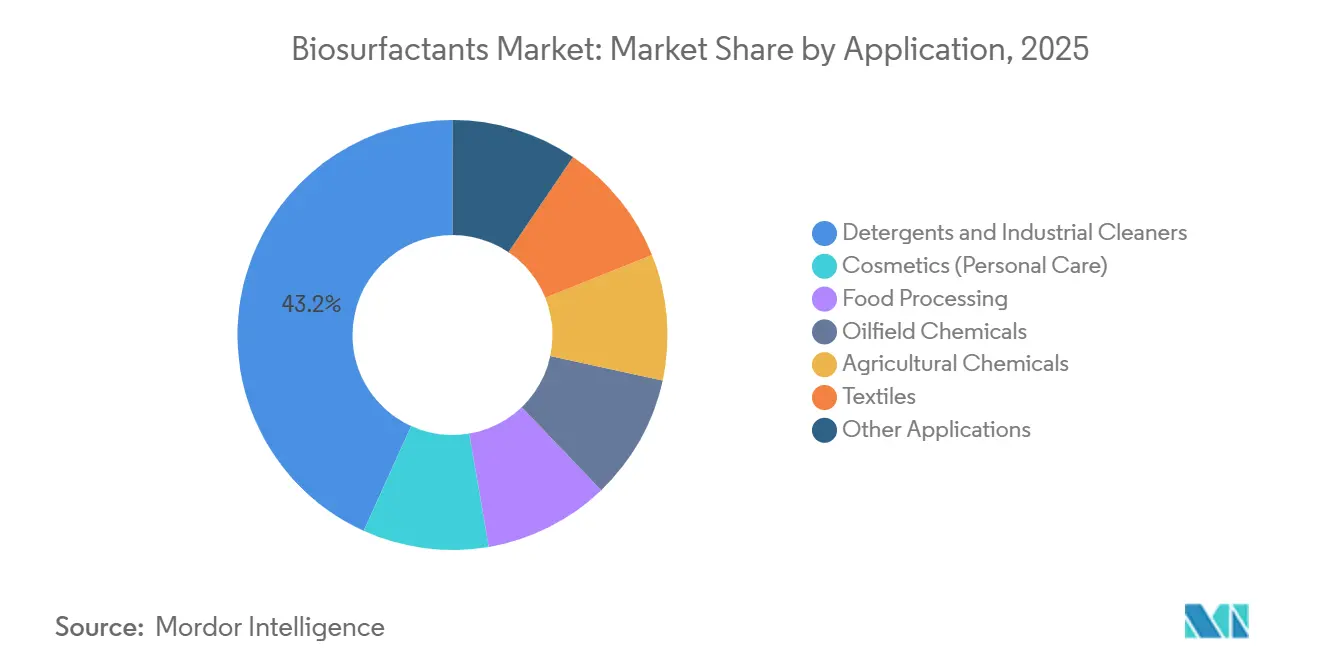
- By application, detergents and industrial cleaners held 43.22% of the biosurfactants market size in 2025; oilfield chemicals are recording the fastest projected CAGR at 5.98% through 2031.
- By geography, Europe commanded 51.75% revenue share in 2025, while Asia-Pacific is projected to grow at 6.04% CAGR to 2031.
Note: Market size and forecast figures in this report are generated using Mordor Intelligence’s proprietary estimation framework, updated with the latest available data and insights as of 2026.
Global Biosurfactants Market Trends and Insights
Drivers Impact Analysis*
| Drivers | (~) % Impact on CAGR Forecast | Geographic Relevance | Impact Timeline |
|---|---|---|---|
| Expansion of Personal-Care and Cosmetics Demand in Asia-Pacific | +1.2% | Asia-Pacific core, spillover to Middle-East | Medium term (2-4 years) |
| Regulatory Push for Biodegradable Surfactants (EU, US) | +1.4% | Europe and North America, adoption spreading to ASEAN | Long term (≥ 4 years) |
| Brand-Level Sustainability Commitments by FMCG Majors | +1.1% | Global, led by Europe and North America | Medium term (2-4 years) |
| Fermentation Scale-Up Lowering Cost Curves | +0.9% | Global, early gains in Europe and North America | Short term (≤ 2 years) |
| Synthetic-Biology-Enabled "Designer" Biosurfactants | +0.7% | North America and Europe, research and development hubs in Boston, Basel | Long term (≥ 4 years) |
| Source: Mordor Intelligence | |||
Expansion of Personal-Care and Cosmetics Demand in Asia-Pacific
In 2025, China's cosmetics expenditure surged, reaching significant levels. Domestic brands, keen on meeting "clean beauty" standards, began reformulating their cleansers with sophorolipids. Meanwhile, in India, personal-care sales saw an uptick, bolstered by Hindustan Unilever's glycolipid handwash, which gained market share just 90 days post its October 2025 launch. South Korea's regulatory body greenlit rhamnolipids for leave-on cosmetics in February 2025. This move paved the way for premium K-beauty serums, which boast high margins. Japanese exporters capitalized on rising demand from ASEAN, dispatching biosurfactant-infused products. This boost in exports propelled regional toiletries sales in 2025. In a strategic move, Croda inaugurated a joint venture in Shanghai in November 2025, establishing a glycolipid capacity to cater to this burgeoning consumer market.
Regulatory Push for Biodegradable Surfactants (EU, US)
Household products must now achieve 60% biodegradation within 28 days, as mandated by REACH Annex XVII. While rhamnolipids meet this requirement, many ethoxylates do not. In March 2025, the U.S. EPA included rhamnolipids and sophorolipids in its Safer Choice ingredient list[1]U.S. Environmental Protection Agency, “Safer Choice Program: Approved Ingredients List Update,” epa.gov. This endorsement provides detergents with a shelf-labeling advantage, which can boost purchase intent. Starting January 2025, California’s Cleaning Product Right to Know Act will require brands to fully disclose ingredients, nudging them towards clearer, plant-based names. Meanwhile, European proposals to phase out PFAS are steering formulators more towards bio-based surfactants. Together, these initiatives bolster demand, even during economic downturns.
Brand-Level Sustainability Commitments by FMCG Majors
Procter & Gamble increased its use of renewable surfactants and aims to further enhance this by 2030. This move translates to an annual demand for glycolipids and rhamnolipids. Meanwhile, Henkel committed to phasing out fossil-carbon surfactants from its European laundry products by 2029, bolstering its strategy with multi-year offtake agreements with industry giants. Unilever, under its Clean Future initiative, invested in pilot fermenters, marking a significant step in expanding capacities in Europe and India. Colgate-Palmolive reformulated its Palmolive dish soap in North America, incorporating sophorolipids. This change, assessed under ISO 14040, achieved a reduction in carbon emissions from cradle to shelf. Stepan observed a rise in inquiries for bio-based products, underscoring a shift in procurement strategies aligning with board-level ESG objectives.
Synthetic-Biology-Enabled Designer Biosurfactants
CRISPR-edited Pseudomonas strains now direct carbon flux into rhamnolipids, enhancing titres and shortening fermentation time. Ginkgo Bioworks and Stepan aim for cost reduction through the automation of Yarrowia engineering. Cell-free enzymatic methods promise a reduction in capital expenditure upon commercialization. New surfactin analogs, boasting HLB values between 8 and 14, offer formulators greater flexibility, minimizing the necessity to blend multiple surfactants.
Restraints Impact Analysis*
| Restraints | (~) % Impact on CAGR Forecast | Geographic Relevance | Impact Timeline |
|---|---|---|---|
| High Production Cost vs. Petro-Surfactants | -0.8% | Global, most acute in price-sensitive markets (South America, MEA) | Short term (≤ 2 years) |
| Tight Purity Specs for Food and Pharma Grades | -0.5% | Global, regulatory intensity highest in North America and Europe | Medium term (2-4 years) |
| Patent Thickets around Production Strains | -0.4% | Global, litigation concentrated in US and Europe | Long term (≥ 4 years) |
| Source: Mordor Intelligence | |||
High Production Cost vs. Petro-Surfactants
Rhamnolipids still carry a surcharge over LAS. Downstream purification consumes a significant portion of the cash cost, with chromatography and spray-drying adding to the expenses. Margins face pressure from feedstock spikes, especially when glycerol or residues are in short supply. Despite the potential, achieving economies of scale proves challenging; the largest biosurfactant plants trail petrochemical units by a considerable factor.
Tight Purity Specs for Food and Pharma Grades
FDA's GRAS guidelines impose a cap on endotoxins. This mandate necessitates an additional depyrogenation pass, inflating costs[2]U.S. Food and Drug Administration, “Guidance on GRAS Status for Biosurfactants,” fda.gov. Meanwhile, EFSA enforces residual-solvent limits, a stipulation that demands the incorporation of vacuum stages. Pharmaceutical monographs set a stringent threshold on heavy metals, capping lead at under 2 ppm. This requirement further complicates processes, necessitating additional chromatography steps. Consistency challenges arise as one-third of batches fall outside the ±5% CMC specification, leading to either rework or scrap.
*Our forecasts treat driver/restraint impacts as directional, not additive. The impact forecasts reflect baseline growth, mix effects, and variable interactions.
Segment Analysis
By Product Type: Glycolipids Extend Leadership on Performance and Mildness
In 2025, glycolipids accounted for 68.91% of the revenue and are also advancing at a 5.81% CAGR through 2031. Their share of the biosurfactants market is poised to increase, thanks to rhamnolipids achieving critical micelle concentrations. Sophorolipids, bolstered by laundry liquids in Europe, commanded a notable portion of the glycolipid segment. Meanwhile, surfactin, capitalizing on its thermal stability, secured a share for oilfield and drilling fluid applications.
Regulatory approvals are driving increased adoption: In March 2025, Japan’s PMDA approved sophorolipids for over-the-counter skincare, and the ECHA expedited the registration process for rhamnolipids following their pre-registration in 2024. Kaneka introduced high-purity grades for cosmetic serums, which command significant price premiums, underscoring a trend towards premiumization.


By Feedstock: Waste Glycerol Accelerates on Circular-Economy Credentials
Vegetable oils still owned 41.17% share in 2025, but the biosurfactants market is tilting toward industrial waste glycerol, expected to log a 7.62% CAGR to 2031. By substituting refined oil with crude glycerol, fermentation feed costs were significantly reduced, resulting in a decrease in biosurfactant ex-factory prices. Thanks to the EU Renewable Energy Directive III, glycerol-based products have been designated as advanced bio-based chemicals, leading to the unlocking of carbon credits. Meanwhile, seasonal limitations on molasses and whey permeate introduce logistical challenges, stabilizing their market share at a notable level.
By Application: Oilfield Chemicals Register Highest Growth Momentum
Detergents and industrial cleaners led with 43.22% of 2025 sales, yet enhanced oil recovery projects will generate the quickest demand, giving the oilfield slice a 5.98% CAGR to 2031. Stepan’s rhamnolipid blend lifted Permian Basin recovery, highlighting superior interfacial-tension reduction. Sophorolipids’ skin compatibility underpins their rising usage in shampoos and facial cleansers across Asia. Food and pharma remain niche until purity hurdles are cleared, though Syensqo’s GRAS-affirmed phospholipid blend opens new bakery and dairy opportunities.
Geography Analysis
Europe held 51.75% revenue in 2025 as REACH, driven by the convergence of REACH regulations, proposals for phasing out PFAS, and a growing consumer preference for ecolabeled detergents. Germany, the United Kingdom, and France collectively accounted for the region's consumption, primarily sourcing from the multi-modal hubs of Evonik and BASF. Additionally, carbon-intensity disclosures mandated by the Corporate Sustainability Reporting Directive are pushing retailers to increasingly stock private labels based on biosurfactants.
North America, contributing significantly to the turnover, benefited from EPA's Safer Choice designations, which facilitate prominent shelf-edge callouts. Procter & Gamble's swift expansion into renewable surfactants, coupled with Colgate-Palmolive's introduction of sophorolipids in the U.S. and Mexico, heightened the demand for sourcing. Furthermore, Canada's EcoLogo endorsement has carved out niche contracts within the institutional cleaning supplies sector.
Asia-Pacific will post the fastest 6.04% run-rate to 2031. This surge is fueled by China's staggering appetite for cosmetics and India's robust growth in personal care. Japan's endorsement of rhamnolipids for premium leave-on products, alongside Korea's flourishing export channel to ASEAN markets, bolsters regional consumption. Addressing supply security, a Croda-Shanghai joint venture is poised to commence operations in 2027, boasting a significant capacity.
South America and the combined regions of the Middle East and Africa hold a modest share. Their growth is tempered by price sensitivity, yet they are gaining traction, especially in areas abundant with crude glycerol and where oilfield applications are prevalent. Brazil's biodiesel initiative churns out an impressive amount of glycerol annually. This bounty serves as an economical fermentation feed for domestic producers. Meanwhile, in alignment with its Vision 2030 objectives, Saudi Aramco is experimenting with biosurfactant drilling fluids.
Mordor Intelligence provides coverage of the biosurfactants market across other key regional markets, including Asia, each with their regulatory frameworks and demand patterns.

Regulatory Landscape
In Europe, biosurfactants fall under the EU chemicals framework, with REACH (Registration, Evaluation, Authorisation and Restriction of Chemicals) governing substance registration and restrictions for surfactant chemistries placed on the market. The sector is also being shaped by detergents rules, with Regulation (EU) 2026/405 published in March 2026 to replace Regulation (EC) 648/2004, bringing detergents and surfactants (including those involving microbial ingredients) into an updated compliance framework that reinforces biodegradability and information requirements.
In the United States, the regulatory pathway depends on end use. For household cleaning positioning, the U.S. EPA Safer Choice program has listed rhamnolipids and sophorolipids (March 2025), supporting on-pack and retail communication of safer-chemistry formulations. Certain biosurfactant uses can also fall under U.S. EPA pesticide registrations with tolerance-exemption constructs where applicable. For food-contact and ingestion-adjacent uses, biosurfactants continue to be assessed within existing food additive and safety evaluation approaches rather than under a dedicated biosurfactant-specific statute, with EFSA evaluating substances for food applications on a case-by-case basis in the EU.
Value Chain Analysis
The biosurfactants value chain starts with renewable feedstocks (vegetable oils, sugars, molasses, whey permeate, and increasingly industrial waste glycerol and other agri-food side streams), followed by microbial strain development and fermentation. Downstream recovery and purification, which are often the main cost and yield bottleneck, then lead into formulation into application-ready blends for detergents, personal care, coatings, and oilfield systems. Scale economics hinge on securing consistent low-cost substrates through long-term sourcing arrangements and on raising fermentation titres and shortening cycles, while chromatography, depyrogenation, and spray-drying requirements can increase costs for higher-purity grades used in food and pharma-adjacent applications.
Downstream distribution and market access are often mediated by ingredient suppliers and formulators that convert base biosurfactants into performance-specific systems. Qualification is driven by customer testing, LCA documentation, and ecolabel or program compatibility, including EPA Safer Choice in North America. Recent chain-shaping moves include platform-led molecule catalogs and waste-based feedstock positioning, such as AmphiStar unveiling the AmphiNova biosurfactant platform (April 2026) and Kensing introducing palm-free, upcycled biosurfactant offerings in North America in partnership with AmphiStar (April 2026), reinforcing how partnerships move biotech inputs into spec-controlled supply.
Competitive Landscape
The biosurfactants market is moderately consolidated. Emerging players carve value niches with tailored congener blends optimized for enhanced oil recovery. Cell-free biosynthesis research, funded by the U.S. Department of Energy, could redraw cost curves by halving capex, though commercialization lies beyond the forecast window. Certification—EPA Safer Choice, ISO 14024 ecolabels—has become routine.
Biosurfactants Industry Leaders
BASF
Evonik Industries AG
Croda International Plc
Syensqo
Saraya.Co.Ltd
- *Disclaimer: Major Players sorted in no particular order

Market Opportunities and Future Outlook
Compliance-led substitution remains a central opportunity, especially in Europe where REACH-linked biodegradability expectations and updated detergents governance raise the bar for surfactant portfolios. The publication of Regulation (EU) 2026/405 in March 2026, replacing Regulation (EC) 648/2004, gives detergent and surfactant suppliers a fresh compliance trigger to reassess test data, ingredient documentation, and formulation architectures. This creates room for biosurfactants that meet performance needs while simplifying biodegradability and disclosure narratives.
A second opportunity is the shift toward circular and palm-free feedstocks, which can reduce cost and Scope 3 burden while improving acceptance with FMCG and private-label buyers. Visible market activity includes the AmphiStar and Kensing partnership (announced June 2025) focused on commercializing upcycled microbial biosurfactants, and the April 2026 launch of Kensing Regenyl and Revolis for personal care and HI&I applications in North America, signaling a move toward regionally sourced side streams and shorter supply lines. On the technology side, platform-driven design and higher titres, such as synthetic-biology-enabled yield gains highlighted in large-scale European production footprints, support biosurfactants in applications that require tailored HLB and mildness, including premium personal care and performance-demanding industrial cleaning systems.
Recent Industry Developments
- April 2026: Kensing introduced the Regenyl and Revolis biosurfactant platform positioned as fully upcycled and palm-free for personal care and HI&I applications in North America. The move broadens commercial access to waste-based biosurfactant inputs through an established ingredient supplier, tightening the link between circular feedstocks and mainstream formulation pipelines.
- July 2025: AmphiStar received EUR 12.5 million from the European Innovation Council to scale biosurfactant production from bio-based waste, including a grant component and an equity investment. This funding supports scale-up and de-risking of waste-to-biosurfactant routes that can improve cost positions versus petro-surfactants.
- May 2024: Evonik officially inaugurated its commercial-scale rhamnolipid biosurfactant plant in Slovakia. Commissioning and ramp-up at this facility strengthened European supply availability for glycolipid biosurfactants and supported broader adoption in detergents and industrial cleaning formulations.


Research Methodology Framework and Report Scope
Market Definition and Coverage
For this methodology, the biosurfactants market is defined as the revenues generated from bio-based surfactant ingredients produced through biological processes and sold for use in formulated products across major end-use industries worldwide.
Scope exclusions: We exclude conventional petrochemical surfactants, internal captive transfer pricing that is not market priced, and downstream formulated product revenues that already include multiple inputs.
Segmentation Overview
- By Product Type
- Glycolipids
- Phospholipids
- Surfactin
- Lichenysin
- Polymeric Bio-surfactants
- Other Product Types
- By Feedstock
- Vegetable Oils (soy, palm, rapeseed)
- Industrial Waste Glycerol
- Agricultural Residues (molasses, whey)
- Others (Animal Fat, Synthesised Sugars)
- By Application
- Detergents and Industrial Cleaners
- Cosmetics (Personal Care)
- Food Processing
- Oilfield Chemicals
- Agricultural Chemicals
- Textiles
- Other Applications
- By Geography
- Asia-Pacific
- China
- India
- Japan
- South Korea
- ASEAN
- Rest of Asia-Pacific
- North America
- United States
- Canada
- Mexico
- Europe
- Germany
- United Kingdom
- France
- Italy
- Spain
- Russia
- Rest of Europe
- South America
- Brazil
- Argentina
- Rest of South America
- Middle-East and Africa
- Saudi Arabia
- South Africa
- Rest of Middle-East and Africa
- Asia-Pacific
Data Sources, Market Sizing, and Validation
Desk Research
Desk research was used to set the market boundaries, identify demand centers, and draft the first set of assumptions for later testing. We relied on public sources such as the US EPA, the European Chemicals Agency, the US International Trade Commission, the FAO, and peer-reviewed journals discussing biosurfactant performance and production routes.
Along with these, we reviewed company annual reports, investor presentations, and credible press coverage to understand capacity moves, application adoption, and pricing direction. Where needed, a paid subscription for company financials and a patent database were used to track investment focus and confirm technology activity around specific biosurfactant families. These desk research sources are illustrative only, and additional public and proprietary references were used during data collection and cross-checking.
Primary Interviews and Surveys
Primary work focused on validating how biosurfactants are actually sold and consumed, since product labels and contract structures can differ by region and application. We interviewed and surveyed a mix of raw material suppliers, formulators, distributors, and large end users across APAC, EMEA, and the Americas, then reconciled inputs to close gaps on utilization, import reliance, and realized pricing.
When an assumption moved the model materially, follow-up calls were triggered so the final totals stayed tied to what practitioners report in day-to-day procurement and sales discussions.
Distribution of primary research fieldwork respondents
| Company type | Respondent position | Region |
|---|---|---|
| Top tier: 38% | CXOs: 14% | APAC: 41% |
| Mid tier: 47% | Functional/Unit leaders: 38% | EMEA: 36% |
| Smaller Players: 15% | Managers: 48% | Americas: 23% |
Market-Sizing & Forecasting
The core sizing starts with a top-down build that reconstructs demand using application-level consumption indicators, penetration of bio-based surfactants in key formulations, and the usable supply picture implied by capacity and output signals. Once that structure is in place, we corroborate it with selective bottom-up approximations, such as sampled supplier revenue ranges, distributor channel checks, and an ASP times volume sense-check for a few high-volume use cases.
Inputs that meaningfully influence the model include installed and announced biosurfactant capacity, typical utilization ranges, feedstock availability and cost direction, application adoption in detergents and personal care, regulatory and brand-driven sustainability commitments, and the premium (or narrowing premium) versus synthetic surfactants. Forecasts are produced using scenario analysis, where each region gets a base case and sensitivity ranges aligned to what interviewees expect for capacity ramp-ups, substitution speed, and pricing.
Where bottom-up signals are incomplete, gaps are handled through conservative ranges anchored to import-export direction, capacity timing, and application mix, and then adjusted only when multiple independent checks point the same way.
Data Validation & Update Cycle
Several checks are run before sign-off, so the totals do not depend on a single data series or one strong interview. Model outputs are compared against independent signals such as capacity additions, trade direction, and demand movement in key end-use industries, and any large variance is traced back to the specific assumption driving it.
A second analyst review is completed for math accuracy, scope consistency, and year-on-year movement reasonableness, followed by targeted re-contacts when a datapoint looks abnormal. Reports are refreshed annually, and interim updates are made when material events occur, such as major plant start-ups, regulatory shifts, or sharp feedstock price moves. Before delivery, a fresh analyst pass is completed so clients receive the latest updated view.
Mordor Intelligence's Biosurfactants Market Size Measured Against Other Published Estimates
Published numbers for biosurfactants do not always match because the market can be counted from different angles, such as ingredient revenues versus formulated product values, and because the base year and currency timing are not always aligned. Differences also come from how each publisher treats adjacent categories, how pricing is trended, and how much primary validation is used to filter desk assumptions.
Capacity ramp timelines, realized pricing from buyer conversations, and the application mix split are usually the largest gap drivers in this industry, since these three items determine how quickly supply can translate into sellable volumes and at what value. Some external figures appear to use earlier base years or broader surfactant-related scope, and they may apply a uniform growth rate that does not reflect near-term plant utilization limits and region-specific adoption speed.
Benchmark comparison
| Source | Market Size | Gaps in Research Methodology |
|---|---|---|
| Mordor Intelligence | USD 3.18 B (2026) | |
| Global Consultancy A | USD 3.31 B (2024) | Uses a different base year and shorter horizon, and the sizing appears to lean more on historical segmentation splits without explicitly tying near-term totals to capacity utilization and ramp timing. |
| Industry Publisher B | USD 4.61 B (2024) | Likely applies a broader value capture or higher assumed ASP level in the base year, with limited clarity on whether formulated product value or adjacent bio-based surfactant blends are being counted alongside biosurfactant ingredients. |
Capacity additions and utilization checks, followed by application-level adoption validation, are the evidence points that keep Mordor Intelligence aligned to ingredient-level revenues instead of drifting into broader surfactant value pools. Taken together, the spread in the table is mainly explained by base-year choice and what is included around blends and downstream value, not by a disagreement that demand is rising.


Key Questions Answered in the Report
How big will global demand for biosurfactants be by 2031?
The biosurfactants market is forecast to reach USD 4.16 billion by 2031, expanding at a 5.52% CAGR, from USD 3.18 billion in 2026.
Which product type leads commercial adoption?
Glycolipids held 68.91% revenue in 2025, fueled by rhamnolipids in detergents and sophorolipids in personal care.
How do regulations influence uptake?
REACH Annex XVII biodegradability rules and the U.S. EPA Safer Choice label together spur formulators to switch away from petro-surfactants.
Which region will grow fastest?
Asia-Pacific, led by China and India, is projected to post a 6.04% CAGR thanks to booming personal-care consumption.
Page last updated on:


