
Big Data In Oil And Gas Exploration And Production Market Size and Share
Market Overview
| Study Period | 2021 - 2031 |
|---|---|
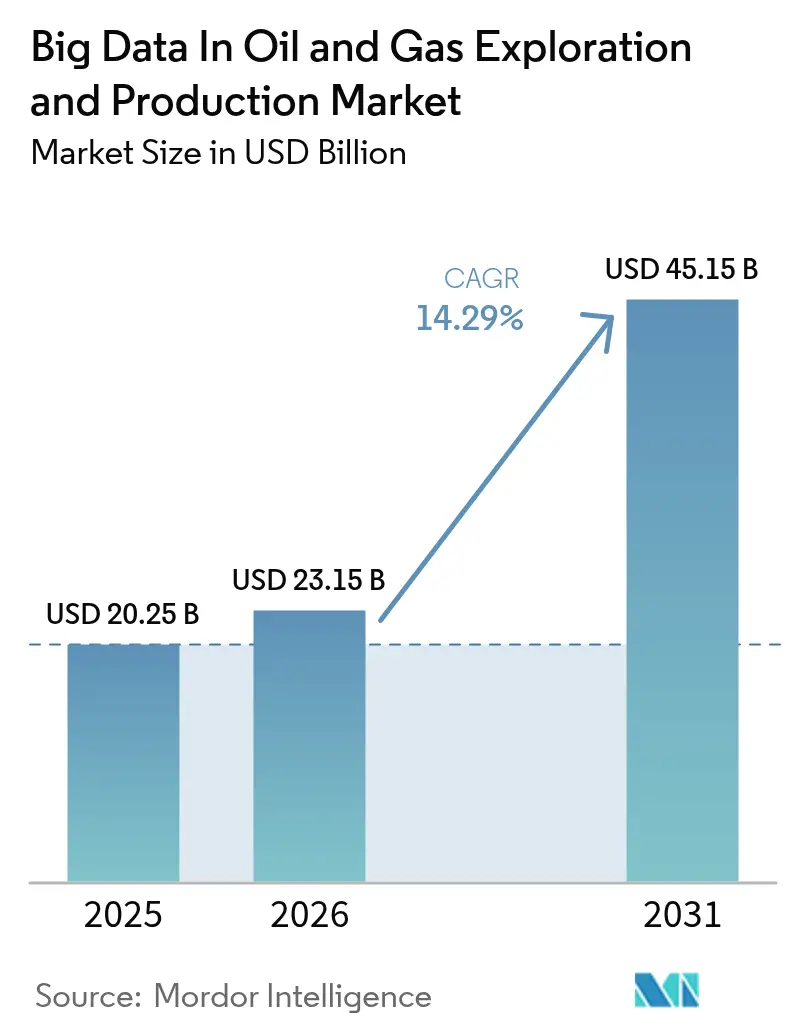
| Market Size (2026) | USD 23.15 Billion |
| Market Size (2031) | USD 45.15 Billion |
| Growth Rate (2026 - 2031) | 14.29 % |
| Fastest Growing Market | Asia Pacific |
| Largest Market | North America |
| Market Concentration | Medium |
Major Players *Disclaimer: Major Players sorted in no particular order Image © Mordor Intelligence. Reuse requires attribution under CC BY 4.0. | |
Big Data In Oil And Gas Exploration And Production Market Analysis by Mordor Intelligence
Big Data In Oil And Gas Exploration And Production Market size market size in 2026 is estimated at USD 23.15 billion, growing from 2025 value of USD 20.25 billion with 2031 projections showing USD 45.15 billion, growing at 14.3% CAGR over 2026-2031.
Operators have raised their digital ambitions to capture value from seismic imaging, real-time sensor networks, and edge analytics, which cut decision cycles from hours to minutes. Standardization around the OSDU framework now removes vendor lock-in while supporting seamless cloud migration. Edge processing at remote wellheads already enables continuous methane-leak monitoring that satisfies tightening ESG mandates. Competitive dynamics favour firms that marry domain expertise with data science skills, allowing smaller analytics specialists to secure niche wins in predictive maintenance and emissions tracking.
Key Report Takeaways
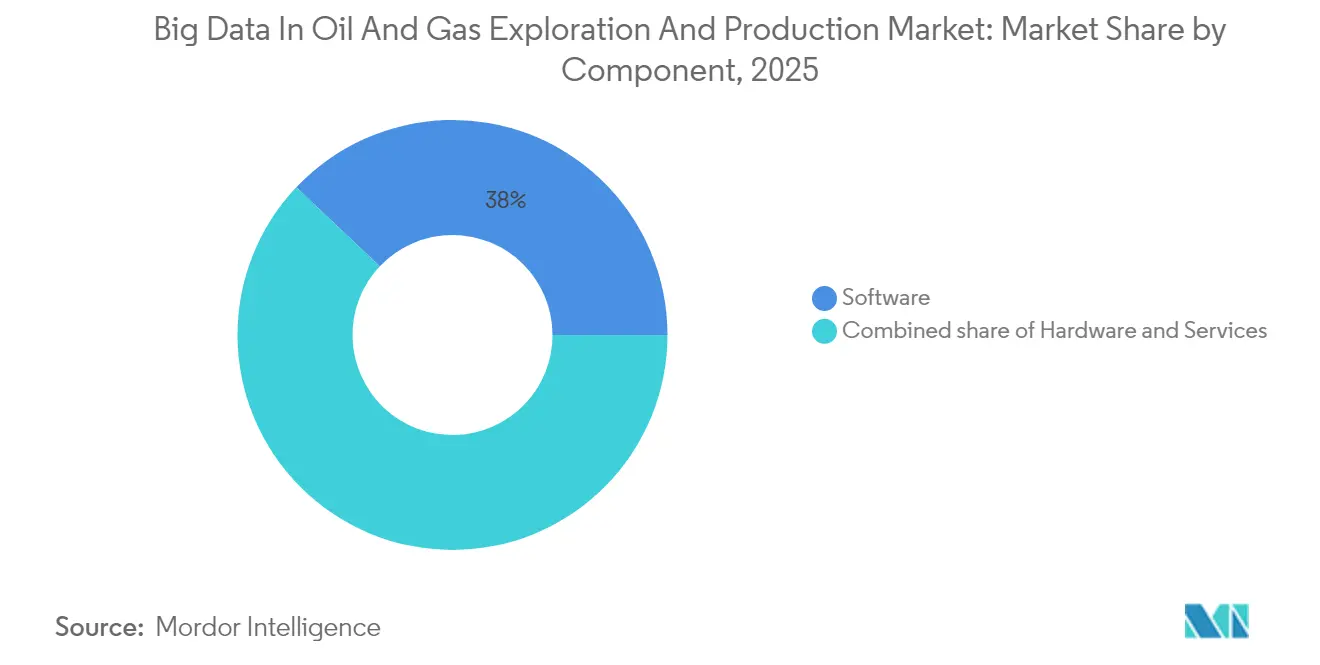
- By component, software accounted for 37.95% of 2025 revenue; the same segment is projected to grow at a 15.62% CAGR through 2031.
- By deployment mode, on-premise installations held 41.90% of the Big Data in oil and gas exploration & production market share in 2025, whereas cloud deployments are advancing at an 18.15% CAGR through 2031.
- By data type, structured data retained a 39.35% share of the Big Data in oil and gas exploration & production market size in 2025, while streaming analytics is expanding at a 18.90% CAGR.
- By application, reservoir management led with a 20.85% share in 2025, whereas drilling and well planning are rising at a 17.35% CAGR.
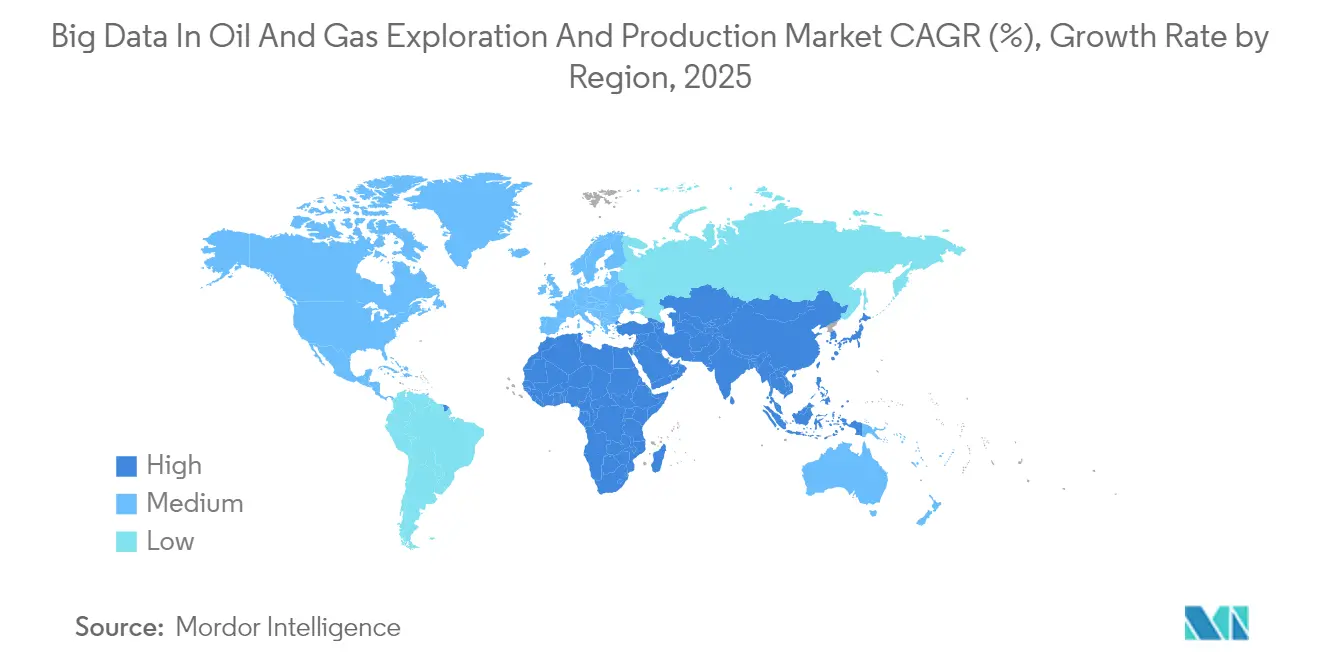
- By geography, North America accounted for 37.25% of the revenue in 2025; the Asia-Pacific region is forecast to post an 18.42% CAGR from 2025 to 2031.
Note: Market size and forecast figures in this report are generated using Mordor Intelligence’s proprietary estimation framework, updated with the latest available data and insights as of 2026.
Global Big Data In Oil And Gas Exploration And Production Market Trends and Insights
Drivers Impact Analysis*
| Driver | (~) % Impact on CAGR Forecast | Geographic Relevance | Impact Timeline |
|---|---|---|---|
| Explosion of high-frequency E&P sensor data | +2.8% | Global, with concentration in North America & APAC | Medium term (2-4 years) |
| Cost-pressure led demand for production optimization | +2.1% | Global, particularly in mature fields across North America & Europe | Short term (≤ 2 years) |
| Cloud migration of subsurface data workloads | +1.9% | North America & EU leading, APAC following | Medium term (2-4 years) |
| Industry adoption of OSDU open data standard | +1.6% | Global, with early adoption in North America & Middle East | Long term (≥ 4 years) |
| Edge / fog analytics at remote wellheads | +1.2% | Global, with emphasis on remote operations in North America & Middle East | Medium term (2-4 years) |
| ESG-driven methane-leak analytics mandates | +0.8% | North America & EU regulatory focus, expanding globally | Long term (≥ 4 years) |
| Source: Mordor Intelligence | |||
Explosion of High-Frequency E&P Sensor Data
Modern rigs now carry more than 40,000 sensors that stream over 2 TB per well each day. Edge devices filter this torrent locally and then relay curated sets to cloud clusters for further processing. Real-time optimisation cuts non-productive time by up to 15% while raising wellbore placement accuracy. The International Energy Agency expects AI-linked industrial electricity demand to reach 1,500 TWh by 2030, underscoring the compute load behind these analytics [1]International Energy Agency, “Electricity 2024 – Analysis and Forecasts to 2030,” iea.org. Operators already use multi-sensor correlation to predict equipment faults 72 hours ahead, lowering unplanned downtime by 25%.
Cost-Pressure Led Demand for Production Optimization
Low-margin environments prompt producers to extract every last drop from existing wells. ExxonMobil’s automated gas-lift system delivered a 2.2% production uplift across 1,300 wells and trimmed USD 50 million in yearly costs [2]ExxonMobil, “Advancing Production with Automated Gas Lift,” exxonmobil.com. Machine-learning models review historical production, reservoir pressure, and ESP performance to identify underperforming assets. Vital Energy reported 2-4% lift-pump gains by continuously adjusting motor speed against downhole conditions. Baker Hughes’ InjectRT software predicts chemical-injection needs with 90% accuracy, preventing overdosing and scale build-up.
Cloud Migration of Subsurface Data Workloads
Moving seismic reprocessing and reservoir simulation to cloud platforms unlocks elastic GPU pools, reducing runtimes from weeks to days. Microsoft Azure Data Manager for Energy already hosts more than 500 PB of operator data in OSDU-compliant form [3]Microsoft, “Azure Data Manager for Energy Overview,” microsoft.com. Small independents can obtain supercomputer-level horsepower without capital expenditure, narrowing the technology gap with major companies. Hybrid strategies keep sensitive datasets on-premise while bursting compute to encrypted cloud zones. This flexibility accelerates the adoption of machine learning across drilling and production workflows.
Industry Adoption of OSDU Open Data Standard
OSDU supplies a common schema that enables tools to exchange logs, production histories, and seismic cubes without manual reformatting. Early adopters such as Saudi Aramco, Shell, and TotalEnergies now spin up analytics pilots in weeks rather than months. Open APIs encourage a marketplace of third-party applications, widening operator choice and diluting vendor lock-in. Cloud-native design enables automatic scaling as workloads surge during frontier exploration or mega-field redevelopment programs.
Restraints Impact Analysis*
| Restraint | (~) % Impact on CAGR Forecast | Geographic Relevance | Impact Timeline |
|---|---|---|---|
| Cyber-security & IP-protection concerns | -1.5% | Global, with heightened concerns in North America & Europe | Short term (≤ 2 years) |
| Legacy IT & data-silo complexity | -1.1% | Global, particularly affecting established operators in North America & Europe | Medium term (2-4 years) |
| Shortage of domain data-science talent | -0.9% | Global, with acute shortages in North America & Europe, emerging in APAC | Medium term (2-4 years) |
| Regulatory-driven investment uncertainty | -0.7% | North America & Europe regulatory focus, with spillover to global operations | Long term (≥ 4 years) |
| Source: Mordor Intelligence | |||
Cyber-security & IP-Protection Concerns
More than half of the top oil and gas firms reported data breaches in 2024, with 69% scoring D or below on external security ratings. The blending of OT and IT networks opens fresh attack surfaces. Operators hesitate to move proprietary subsurface data—often worth billions—to public clouds despite the use of its strong encryption. Regulatory mosaics add extra hurdles; some jurisdictions insist seismic data stay within national borders. Together these issues slow universal adoption of shared analytics platforms.
Legacy IT & Data-Silo Complexity
Years of bolt-on systems have produced a patchwork of proprietary databases and incompatible file formats. Valuable logs often sit inside aging applications with no API access. Integration projects often require custom middleware and lengthy data-cleansing cycles that can strain budgets. Cultural factors also matter: engineers steeped in traditional workflows may be skeptical of algorithmic recommendations. These hurdles extend deployment timeframes and defer returns on analytics investment.
*Our forecasts treat driver/restraint impacts as directional, not additive. The impact forecasts reflect baseline growth, mix effects, and variable interactions.
Segment Analysis
By Component: Software Catalyses Advanced Analytics
Software contributed the largest 37.95% share of 2025 revenue, and it is forecast to grow at a 15.62% CAGR, underscoring that algorithm sophistication, not hardware count, drives the competitive edge in the Big Data market for oil and gas exploration & production. Providers bundle seismic interpretation, reservoir modelling, and predictive maintenance within cohesive suites that shorten time-to-value. Managed-service providers complement these offerings by deploying data scientists into field teams to operationalise models quickly.
Hardware retains relevance for high-performance computing and ruggedized edge gateways, yet cloud elasticity removes the need for constant capital expenditure (capex) refresh. Services—ranging from data integration to change-management training—help operators overcome legacy IT friction. As software matures, value migrates toward packaged use cases, such as automated gas-lift tuning or ESP failure prediction, that deliver measurable production gains within weeks.



By Deployment Mode: Cloud Momentum Builds
On-premise estates still held a 41.90% share in 2025, reflecting perceived security benefits and regulatory mandates for local data storage. Even so, cloud workloads are growing at an 18.15% CAGR, the fastest of any deployment category within the big data market in oil and gas exploration & production. Hybrid architectures dominate: sensitive data sits inside operator firewalls while heavyweight simulations burst to cloud GPU clusters.
Edge computing provides the final layer, executing AI at the wellhead where milliseconds matter. This tiered model trims latency, controls bandwidth costs, and supports autonomous operations in remote basins. Vendors now offer pre-validated blueprints that streamline hybrid deployment, making the transition easier for conservative operators.
By Data Type: Streaming Analytics Gains Traction
Structured datasets—such as production reports and financial ledgers—still account for 39.35% of the Big Data in the oil and gas exploration & production market size. Yet streaming feeds from downhole tools and surface sensors are expanding at a 18.90% CAGR as operators demand real-time optimisation. Edge preprocessors compress and label microsecond readings before cloud ingestion, keeping transport costs viable.
Semi-structured formats, such as WITSML logs, bridge the structured and streaming realms, enabling cross-domain correlations. Unstructured files—including seismic images and maintenance manuals—are finally mined using computer vision and NLP to surface hidden insights. Integrated platforms that handle all four data shapes win favour for reducing hand-offs and governance headaches.

By Application: Reservoir Focus Meets Drilling Innovation
Reservoir management led with a 20.85% share in 2025, as engineers leveraged simulation engines and data-driven EOR programs to enhance recovery factors. The segment captures nearly one-fifth of the Big Data in oil and gas exploration & production market share, reflecting its central role in value creation. Drilling and well planning, however, hold the fastest 17.35% CAGR, driven by AI-guided geosteering that reduces slide time and improves borehole placement.
Production and lift optimisation remains a high-ROI arena where incremental gains compound across thousands of wells. Predictive maintenance utilizes vibration and pressure signatures to anticipate pump or compressor failures days in advance. HSE and emissions monitoring benefits from satellite and drone imagery stitched with ground readings to give continuous asset visibility. Together, these advances extend the value of analytics beyond subsurface teams into every workflow.
Geography Analysis
North America generated 37.25% of 2025 revenue, powered by shale players that pioneered horizontal drilling and data-rich completions. The region continues to scale automated gas-lift control and ESP analytics that deliver tangible cost savings. Government support for data-sharing consortia further expands the accessibility of subsurface libraries.
The Asia-Pacific region is the fastest-growing geography, projected to grow at an 18.42% CAGR through 2031. National oil companies in China and India are investing capital in AI-enabled exploration to enhance domestic supply security. Joint research programs between academia and industry accelerate the localization of algorithms for complex geology found in the South China Sea and Indian basins.
The Middle East leverages massive field datasets—Saudi Aramco alone stores 1,500 PB—to run AI models that optimise injection patterns across giant reservoirs. Europe focuses on emissions analytics to meet strict ESG rules, while South America adopts cloud platforms to overcome limited in-house computing capabilities. Collectively, these trends ensure the Big Data in oil and gas exploration & production market remains global in scope, yet locally nuanced in execution.

Regulatory Landscape
Regulation increasingly specifies how upstream data is captured, retained, and exchanged, which raises demand for interoperable data platforms and governed analytics. In the United Kingdom, the North Sea Transition Authority (NSTA) requires digital submission of geophysical datasets and related reporting to the National Data Repository (NDR) using defined forms and manners that support standardized, machine-readable delivery.
Data retention, disclosure, and measurement compliance also expand the scope of auditable digital workflows across E&P operations. The United States Bureau of Safety and Environmental Enforcement (BSEE) issued a final rule (effective August 10, 2026) that incorporates updated industry standards for oil, gas, and sulfur production measurement on the Outer Continental Shelf, tightening requirements for accurate production accounting and associated data handling. Separately, government-led data governance programs such as the US Department of Energy (DOE) Data Management and Sharing Plan requirements (FAL 2026-01, issued in December 2025) and national open-data-format mandates (for example, Brunei Darussalam data submission guidelines) reinforce long-term preservation, traceability, and portability of technical datasets used in exploration and production.
Competitive Landscape
Market concentration is moderate. Schlumberger leads with 256 digital patents, targeting subsurface analysis and drilling optimisation. Halliburton follows with 136 patents focused on production uplift technologies. Cloud hyperscalers—Microsoft, AWS, Google Cloud—add muscle through scalable infrastructure and AI frameworks, partnering with service majors rather than displacing them.
Strategic alliances shape competition. SLB and Nvidia co-develop GPU-accelerated subsurface workflows, while Baker Hughes teams with Repsol to roll out the Leucipa™ platform for predictive maintenance. These collaborations mix domain insights with AI expertise, shortening adoption cycles.
Niche vendors thrive by solving specific pain points such as methane detection or supply-chain optimisation. Their agility appeals to operators looking for quick wins. Over time, successful start-ups often become acquisition targets for larger service firms seeking to round out digital portfolios.
Big Data In Oil And Gas Exploration And Production Industry Leaders
Schlumberger
Halliburton
IBM
Baker Hughes
Microsoft
- *Disclaimer: Major Players sorted in no particular order


Market Opportunities and Future Outlook
Operational-scale deployments that connect subsurface interpretation, drilling, and production optimization on a common data foundation continue to create whitespace for OSDU-aligned platforms, MLOps tooling, and workflow automation. Evidence of enterprise rollouts includes Microsoft Azure Data Manager for Energy hosting more than 500 PB of operator data in OSDU-compliant form, which supports multi-vendor application ecosystems and shortens time-to-onboard for analytics use cases. This creates room for vendors that package repeatable applications (reservoir management, drilling and well planning, predictive maintenance, and emissions monitoring) and also provide integration services that reduce legacy data-silo friction.
Compute-intensive seismic imaging and reservoir simulation remain a high-value area for cloud and accelerated computing stacks, particularly where turnaround time affects drilling and development decisions. TotalEnergies announced the Pangea 5 supercomputer in June 2026 to increase computing power sixfold for data and AI workloads across subsurface and broader energy applications, highlighting the infrastructure being deployed to industrialize upstream analytics. Equinor also reported USD 130 million in AI-driven savings for 2025 and described AI-assisted interpretation across 2 million square kilometers of seismic data (January 2026), reinforcing demand for governed data pipelines, scalable model deployment, and domain-ready AI assistants that shorten cycle time from interpretation to development planning.
Recent Industry Developments
- June 2026: Halliburton acquired Norway-based software company InformatiQ AS to expand cloud-native digital capabilities in its Landmark portfolio. The deal adds applications that unify subsurface, drilling, well, and logistics data, which improves end-to-end asset data connectivity. This accelerates adoption of integrated analytics across planning and operations where fragmented datasets have slowed time-to-value.
- June 2025: Baker Hughes and Repsol agreed to implement advanced digital capabilities through the Leucipa automated field production system, including a generative AI-driven virtual assistant. The collaboration focuses on production operational workflows, where continuous data ingestion and automated decision support can scale across multi-asset portfolios. It also reinforces the shift toward platform-based deployments rather than isolated point solutions.
- September 2024: SLB expanded its collaboration with NVIDIA to shorten seismic-processing turnaround and refine velocity models. The initiative targets GPU-accelerated subsurface workflows that compress processing timelines for exploration and field development decisions. It also reinforces the competitive position of vendors combining domain software with accelerated computing to handle high-volume seismic and sensor datasets.


Research Methodology Framework and Report Scope
Market Definition and Coverage
This market covers spending on big data hardware, software, and services used by upstream oil and gas teams to capture, store, process, and analyze exploration and production data to improve technical and operating decisions.
Scope exclusions: Midstream and downstream analytics, along with general enterprise IT that is not tied to E&P use cases, are not counted.
Segmentation Overview
- By Component
- Hardware
- Software
- Services
- By Deployment Mode
- On-premise
- Cloud
- Hybrid/Edge-Enabled
- By Data Type
- Structured
- Unstructured
- Semi-structured/Streaming
- By Application
- Exploration and Seismic Imaging
- Drilling and Well Planning
- Production and Lift Optimization
- Reservoir Management and EOR
- Predictive Maintenance
- HSE and Emissions Monitoring
- Supply-Chain and Logistics
- Geography
- North America
- United States
- Canada
- Mexico
- Europe
- Germany
- United Kingdom
- France
- Italy
- NORDIC Countries
- Russia
- Rest of Europe
- Asia-Pacific
- China
- India
- Japan
- South Korea
- ASEAN Countries
- Rest of Asia-Pacific
- South America
- Brazil
- Argentina
- Colombia
- Rest of South America
- Middle East and Africa
- Saudi Arabia
- United Arab Emirates
- Qatar
- Nigeria
- South Africa
- Egypt
- Rest of Middle East and Africa
- North America
Data Sources, Market Sizing, and Validation
Desk Research
Desk research was used to set the fact base for upstream activity and the digital spend context behind E&P analytics adoption. We referenced public sources such as U.S. EIA datasets, U.S. Bureau of Labor Statistics price series, Eurostat energy statistics, IEA publications, and OPEC annual statistical releases to map production trends, drilling activity direction, and regional operating cycles.
To link activity to technology demand, we also reviewed company annual reports, earnings decks, association websites, and reputable press coverage on digital transformation programs and cloud migrations in upstream assets. In addition, we used paid subscriptions for company financials and intelligence, patent databases, and news and financials to cross-check revenue exposure, product focus, and the timing of investment cycles. These desk research sources are illustrative only, and additional references were used for data collection, validation, and research clarification.
Primary Interviews and Surveys
Primary discussions were run with upstream operators, oilfield service providers, and technology-focused teams to validate what is actually being deployed in the field and what budgets are being approved. Respondent input was used to test adoption by use case (for example, seismic imaging analytics, drilling and well planning, and predictive maintenance) and to sanity-check assumptions on cloud versus on-premise mixes and typical implementation timing across regions.
Distribution of primary research fieldwork respondents
| Company type | Respondent position | Region |
|---|---|---|
| Top tier: 31% | CXOs: 16% | APAC: 48% |
| Mid tier: 51% | Functional/Unit leaders: 33% | EMEA: 29% |
| Smaller Players: 18% | Managers: 51% | Americas: 23% |
Market-Sizing & Forecasting
Sizing starts from a top-down build where upstream activity and digital enablement levels are converted into an addressable demand pool, then split into E&P analytics and data platform spending by application and deployment. In practice, drilling and completion intensity, producing well counts and workover patterns, seismic and subsurface interpretation workloads, and the share of assets using connected sensors were treated as practical indicators for explaining how data volumes and analytics usage rise or fall.
Those totals are then corroborated with selective bottom-up approximations using sampled vendor revenue exposure to upstream analytics, channel checks on project scale, and a volume-times-ASP approach for common elements such as data storage, compute, and implementation services effort. When bottom-up visibility is limited, gaps are handled by applying adoption ranges validated in interviews, followed by rebalancing to match the top-down activity-derived envelope. For forecasting, we used scenario analysis supported by a light multivariate regression view, with main drivers including expected upstream capex direction, commodity price sensitivity, cloud migration pace, and regulatory push around HSE and emissions monitoring. Scenarios are reviewed with expert feedback before finalizing.
Data Validation & Update Cycle
Model outputs are checked against independent signals such as regional upstream investment direction, digital program announcements, and observed changes in deployment mix, and then variances are reviewed before sign-off. When numbers move outside a reasonable band, assumptions are rechecked and respondents are re-contacted to confirm what changed, including pricing, project timing, or a shift in scope.
A multi-step analyst review is followed so calculations, currency handling, and segment allocations stay consistent across years. Reports are refreshed annually, with interim updates when a material event occurs that can change demand, such as a sudden swing in upstream spending or a major shift in cloud adoption. Before delivery, we run a final pass to ensure clients receive the latest updated view.
Mordor Intelligence's Oil and Gas Exploration and Production Big Data Market Size Compared With Other Published Estimates
Published market sizes for this topic often do not match because studies draw the line around different upstream activities and they also treat spending categories in different ways. Differences also show up when one estimate uses a broader oil and gas digital scope, while another limits to a narrower set of E&P analytics use cases.
Key gap drivers come down to whether the estimate counts only E&P applications such as seismic imaging, drilling and well planning, and reservoir management, or whether it also folds in midstream and downstream analytics and wider enterprise data platforms. The year used for currency conversion, how cloud consumption is recognized, and whether the model is refreshed after changes in upstream capex guidance can also shift the reported value, even when the headline label appears similar.
Benchmark comparison
| Source | Market Size | Gaps in Research Methodology |
|---|---|---|
| Mordor Intelligence | USD 23.15 B (2026) | |
| Industry Research Group A | USD 16.74 B (2025) | Uses an earlier base year and includes a wider end-user frame that can extend beyond upstream E&P into adjacent oil and gas operations, which changes the spend boundary and the pace assumptions. |
| Industry Publisher B | USD 2.72 B (2026) | Represents a broader oil and gas big data view but with a much narrower counted spend set, where only selected software oriented analytics revenues are captured and hardware and services are less consistently treated. |
The spread mainly comes down to what is counted as E&P big data spend and how cloud and services are treated within the value chain. By keeping the scope anchored to upstream applications and counting hardware, software, and services linked to those deployments, the resulting total is kept more traceable to field adoption signals, which is the choice applied by Mordor Intelligence.


Key Questions Answered in the Report
What is the projected growth rate for the Big Data in oil and gas exploration & production market?
The market is forecast to expand at a 14.29% CAGR from 2026 to 2031.
Which component segment leads revenue contribution?
Software holds the top position with a 37.95% 2025 share and is forecast to grow at 15.62% CAGR.
Why are operators adopting cloud platforms for subsurface data?
Cloud offers elastic GPU resources that cut seismic re-processing times from weeks to days while lowering capex, driving an 18.15% CAGR in cloud deployments.
Which region shows the fastest market growth?
Asia-Pacific is advancing at an 18.42% CAGR due to large investments by national oil companies in China and India.
How are companies addressing methane-leak regulations?
Operators deploy continuous sensor monitoring and edge analytics that pinpoint leaks in near real time, enabling faster repairs and compliance reporting.
Page last updated on:





