BFSI Security Market Size and Share
Market Overview
| Study Period | 2020 - 2031 |
|---|---|
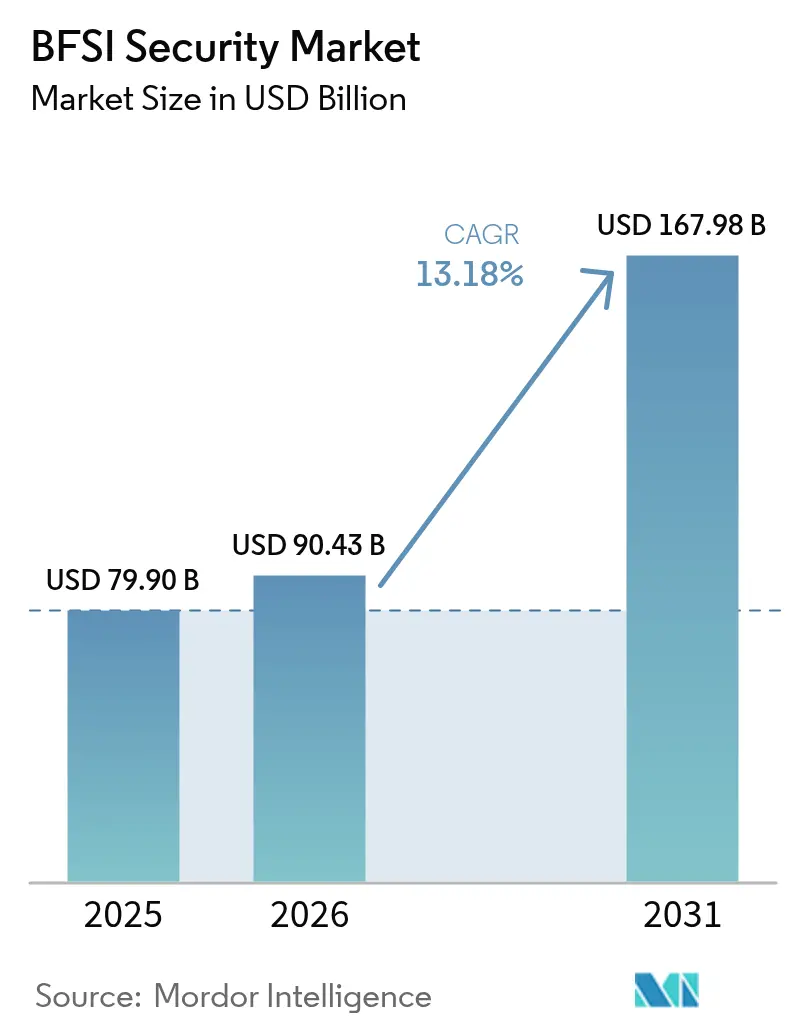
| Market Size (2026) | USD 90.43 Billion |
| Market Size (2031) | USD 167.98 Billion |
| Growth Rate (2026 - 2031) | 13.18% CAGR |
| Fastest Growing Market | Asia Pacific |
| Largest Market | North America |
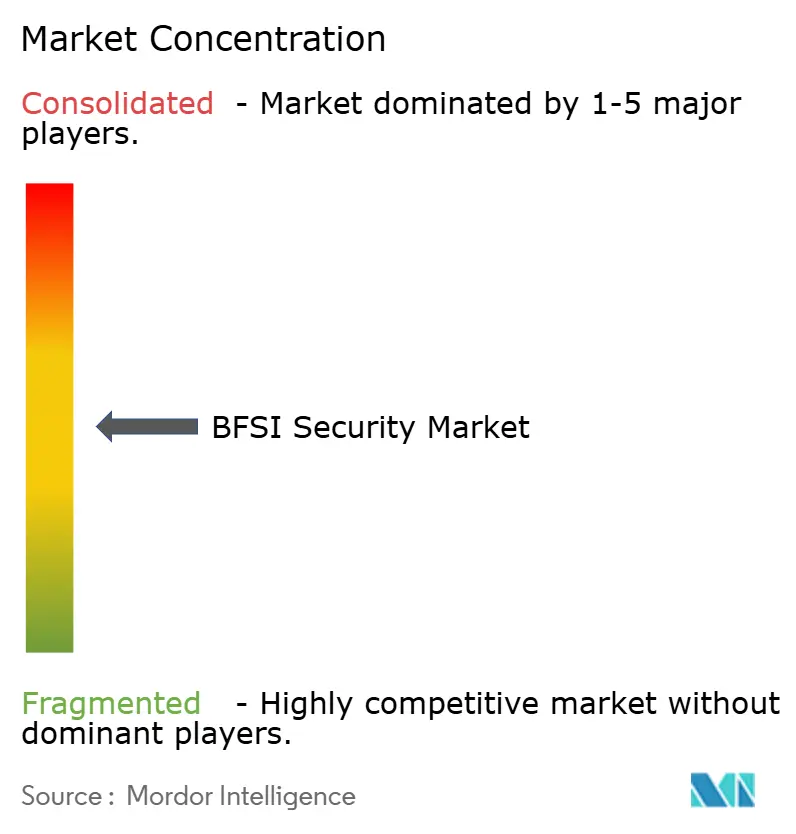
| Market Concentration | Medium |
Major Players*Disclaimer: Major Players sorted in no particular order Image © Mordor Intelligence. Reuse requires attribution under CC BY 4.0. | |
BFSI Security Market Analysis by Mordor Intelligence
The BFSI security market size was valued at USD 79.9 billion in 2025 and estimated to grow from USD 90.43 billion in 2026 to reach USD 167.98 billion by 2031, at a CAGR of 13.18% during the forecast period (2026-2031). This trajectory underscores how regulators, banks and insurers are reacting to an unrelenting spike in sophisticated breaches, typified by the February 2025 email compromise at the Office of the Comptroller of the Currency that exposed more than 100 senior officials’ messages. Rising third-party risk came into sharper focus after the April 2025 ransomware strike on Toppan Next Tech that affected customer records from DBS Bank and Bank of China’s Singapore branch.[1]Monetary Authority of Singapore, “Ransomware Attack on Toppan Next Tech,” mas.gov.sg At the same time, the European Union’s Digital Operational Resilience Act (DORA) and parallel rules in India and New York are compelling financial firms to replace periodic audits with real-time controls. The result is a steady redirection of budgets toward zero-trust architectures, cloud-native defenses and quantum-safe cryptography pilots, all of which continue to expand the BFSI security market.
Key Report Takeaways
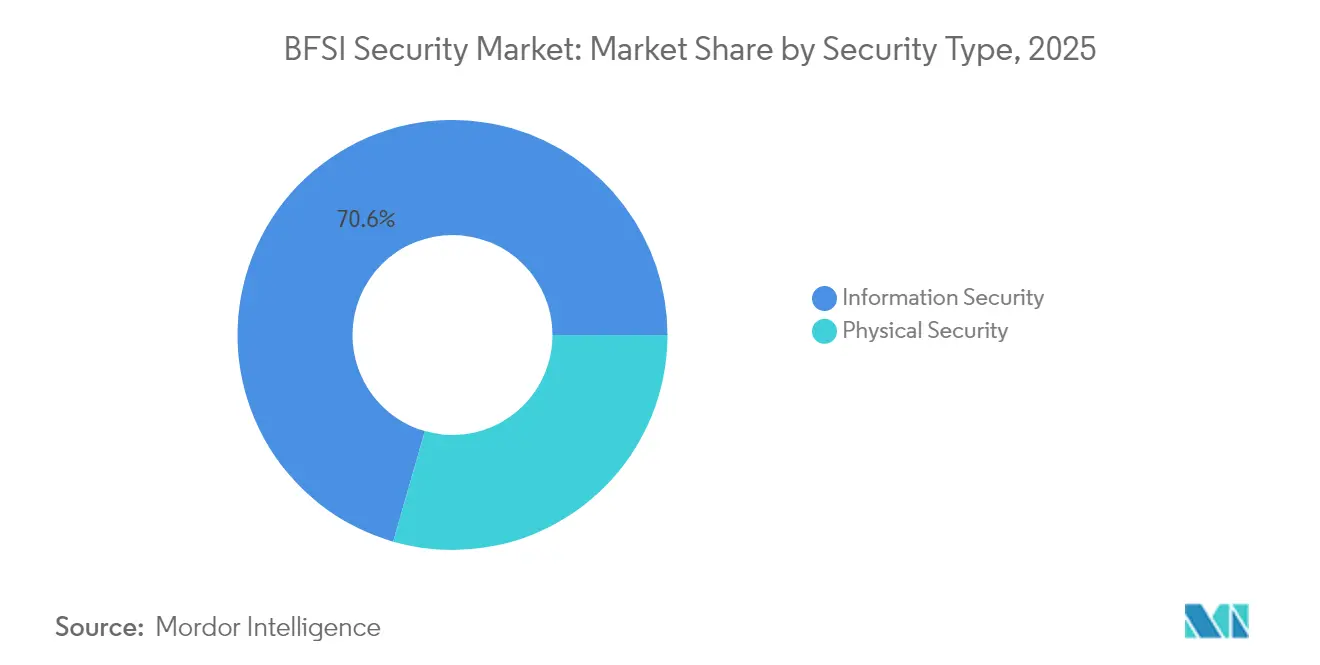
- By security type, Information Security led with 70.55% revenue share in 2025; cloud-based sub-solutions are advancing at a 16.15% CAGR through 2031.
- By deployment model, on-premises retained 62.85% of the BFSI security market share in 2025, while cloud models are growing quickest at 19.25% CAGR.
- By vertical, banking institutions held 60.95% of the BFSI security market size in 2025; the insurance segment is expanding at a 15.12% CAGR to 2031.
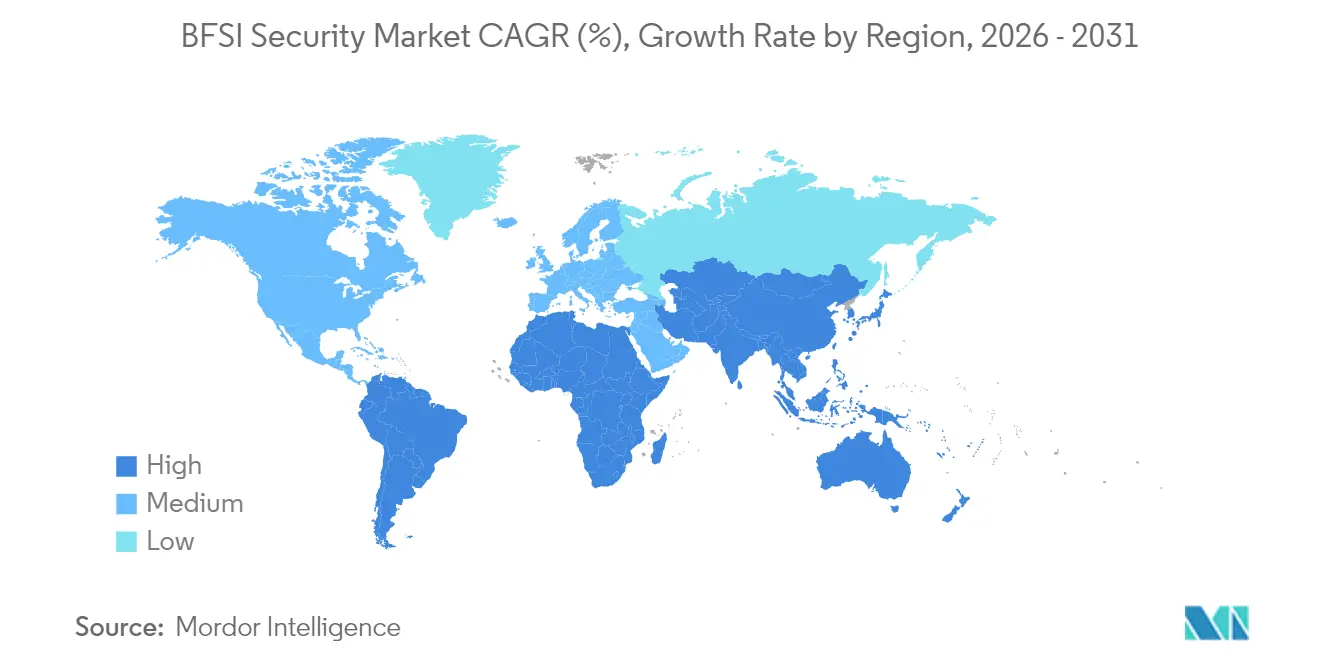
- By geography, North America accounted for 36.10% revenue in 2025, whereas Asia-Pacific is the fastest-growing region at 14.72% CAGR.
- Palo Alto Networks, Fortinet, Check Point, Cisco and IBM collectively supplied integrated platforms that served more than half of the top 200 global banks in 2024.
Note: Market size and forecast figures in this report are generated using Mordor Intelligence’s proprietary estimation framework, updated with the latest available data and insights as of 2026.
Market Trends and Insights
Drivers Impact Analysis of BFSI Security Market*
| Driver | (~) % Impact on CAGR Forecast | Geographic Relevance | Impact Timeline |
|---|---|---|---|
| Surge in digital banking transactions | +3.2% | Global, highest in Asia-Pacific and Europe | Medium term (2-4 years) |
| Escalating sophistication of cyber-attacks | +2.8% | Global, especially North America and Europe | Short term (≤ 2 years) |
| Stringent data-protection regulations | +2.1% | Europe and North America, expanding to Asia-Pacific | Medium term (2-4 years) |
| Cloud migration of core-banking platforms | +1.9% | Global, led by North America and Europe | Long term (≥ 4 years) |
| AI-driven fraud-prevention adoption | +1.4% | North America and Asia-Pacific | Medium term (2-4 years) |
| Open-banking APIs expanding attack surface | +1.1% | Europe and North America | Short term (≤ 2 years) |
| Source: Mordor Intelligence | |||
Surge in Digital Banking Transactions
Electronic payments continue to cannibalize cheques, driving volumes that legacy fraud-detection stacks cannot analyze in real time. Singapore’s Monetary Authority has set mid-2025 for nationwide Electronic Deferred Payment roll-out, while India now obliges banks to deploy AI-powered behavioural analytics for fraud spotting.[2]Grant Thornton Bharat, “RBI Regulatory Banking Insights: August 2024,” grantthornton.in These mandates are funnelling spending toward cloud-native transaction monitoring and low-latency core-banking APIs. As the BFSI security market broadens, vendors that can inspect payloads at millisecond speed without performance drag secure a first-mover advantage. Institutions are also overhauling authentication flows to support risk-based step-up verification for high-value transfers, further accelerating platform rip-and-replace activity.
Escalating Sophistication of Cyber-Attacks
The LockBit assault on Evolve Bank and Trust laid bare the dual-threat model of encryption plus data theft, while the Minja memory injection exploit reached a 95% success rate against AI chatbots in lab tests.[3]Jack Naglieri, “The Evolve Bank and Trust Breach,” jacknaglieri.substack.com Attackers now weaponize large language models to refine phishing scripts in seconds, leaving signature-based controls obsolete. Financial firms therefore prioritize behavioural analytics, adversary emulation and automated response orchestration. The BFSI security market responds by bundling extended detection and response (XDR) with threat-intelligence enrichment so analysts can triage novel tactics in minutes rather than hours. Proof-of-concept quantum decryption techniques also loom, nudging boards to allocate seed budgets for quantum-resistant encryption roll-outs.
Stringent Data-Protection Regulations
New rules tighten timelines for breach disclosure and mandate threat-led penetration testing. DORA fines can reach 2% of annual turnover, creating a cost-of-non-compliance higher than many attack losses. In India, SEBI’s Cybersecurity and Cyber-Resilience Framework imposes near-real-time risk dashboards for capital-markets entities. Meanwhile, the United States’ CFPB Section 1033 standardizes open-banking APIs, forcing unified security layers across data aggregators.[4]Ozone API Marketing, “Technical Guide to CFPB Section 1033,” ozoneapi.com These statutes are expanding the addressable BFSI security market as institutions swap periodic audits for continuous-compliance automation platforms and micro-segmentation.
Cloud Migration of Core-Banking Platforms
Almost every financial institution now runs at least one regulated workload in a public or hybrid cloud, according to the Cloud Security Alliance’s 2025 survey. The FFIEC’s new guidance clarifies shared-responsibility models, reducing board-level hesitation. Yet migration lifts the threat surface from well-defined data centers to distributed multi-cloud topologies. Vendors that embed policy-as-code, container runtime defense and cloud security posture management into unified consoles gain traction within the BFSI security market. Banks increasingly replace virtual appliances with agentless scanning that baselines workloads in seconds and auto-remediates misconfigurations before auditors flag them.
Restraints Impact Analysis of BFSI Security Market*
| Restraint | (~) % Impact on CAGR Forecast | Geographic Relevance | Impact Timeline |
|---|---|---|---|
| High total cost of ownership | -1.8% | Global, hardest on mid-tier institutions | Medium term (2-4 years) |
| Legacy-system integration complexity | -1.5% | North America and Europe, rising in Asia-Pacific | Long term (≥ 4 years) |
| Cyber-security talent shortage | -1.2% | Global, most acute in mature markets | Long term (≥ 4 years) |
| Cross-border data-residency ambiguity | -0.9% | Multinational institutions worldwide | Medium term (2-4 years) |
| Source: Mordor Intelligence | |||
High Total Cost of Ownership
Globally, budget growth for cyber programs decelerated to 8% in 2024, down from 16% in 2021, as economic headwinds and unclear ROI stall spending. Mid-tier institutions earmark 13.2% of IT outlays for security yet still report readiness gaps, reflecting fragmentation across dozens of overlapping tools. Tool sprawl inflates licensing, integration and SOC staffing costs, suppressing net new investment and placing a drag on the BFSI security market. Consolidated platforms that automate triage and incident response can lower per-alert costs by 40%, but migration budgets often exceed in-year savings, prolonging payback windows and delaying purchase approvals.
Legacy-System Integration Complexity
Many core-banking engines still rely on COBOL code, limiting compatibility with API-driven zero-trust controls. Post-quantum encryption initiatives risk breaking older message formats outright, requiring wholesale system replacement rather than patching. Integration projects stretch across multiple fiscal years and consume scarce engineering bandwidth, slowing rollout of advanced defenses and tempering expansion of the BFSI security market. Institutions therefore triage modernization roadmaps, leaving non-internet-facing workloads on legacy stacks and restricting system scopes for new tooling to avoid business disruption.
*Our forecasts treat driver/restraint impacts as directional, not additive. The impact forecasts reflect baseline growth, mix effects, and variable interactions.
BFSI Security Market Segment Analysis
By Security Type:
Information Security Dominates Digital TransformationInformation Security captured 70.55% of the BFSI security market share in 2025, far outpacing physical controls as customer engagement shifts to digital channels. Demand concentrates on data-loss prevention, endpoint detection and response, and identity governance platforms that satisfy DORA’s prescriptive testing clauses. The BFSI security market size for Information Security will expand at 16.15% CAGR through 2031, powered by mandatory threat-led penetration testing and AI infusion into fraud analytics.
Convergence of physical and logical safeguards is nonetheless advancing. Branch and data-center operators integrate biometric access logs with SIEM dashboards, enabling unified risk scoring. Zero-trust blueprints treat door readers and API gateways alike, requiring continuous verification before granting privileges. Vendors that supply interoperable credential management vaults therefore secure a growing slice of the BFSI security market. Institutions also pilot deception grids and autonomous threat-containment to reduce mean-time-to-respond below the regulatory 24-hour disclosure threshold.


By Service Type:
Integration Services Lead Market TransformationSystem-integration specialists accounted for 40.05% of 2025 revenue as banks wrestled with patch-work architectures and regulatory deadlines. Every DORA or NYDFS requirement triggers mapping of control libraries, API hooks and audit workflows into heterogeneous tech stacks, solidifying integration services’ place at the center of the BFSI security market. Managed Security Services follow closely, forecast to climb 18.55% CAGR on the back of 24/7 monitoring mandates that smaller lenders cannot staff internally.
The financial services cybersecurity industry increasingly favors outcome-based contracts over time-and-materials engagements. Cisco’s HyperShield release bundles autonomous segmentation with professional services, offering guaranteed vulnerability remediation windows. In response, mid-market banks outsource alert triage to specialised SOCs, cutting incident dwell times by up to 60%. Ecosystem partners embed compliance dashboards that align with auditors’ report formats, reinforcing integration services’ pivotal role in capitalization of the BFSI security market.
By Deployment Model:
Cloud Adoption Accelerates Despite Compliance ConcernsOn-premises solutions still held 62.85% of spending in 2025 as risk-averse boards favored direct control and granular data-residency assurance. That said, cloud deployments are on a 19.25% CAGR curve, underpinned by elastic compute and native AI acceleration that on-premises hardware struggles to match. Hybrid blueprints dominate large-bank strategies, blending private clouds for regulated workloads with public IaaS/SaaS for analytics.
Asia-Pacific regulators now issue explicit guidance on shared responsibility, dissipating residual hesitation and unlocking further growth in the BFSI security market. The BFSI security market size tied to cloud-native workloads is expected to more than double by 2031. Vendors that deliver agentless posture management, serverless runtime defense and near-real-time compliance evidence find receptive audiences, particularly among digital-only banks that bypassed legacy data centers altogether.

By Vertical:
Banking Institutions Drive Market GrowthBanking institutions constituted 60.95% of 2025 revenue and remain the BFSI security market’s anchor clientele. High-value account data, real-time payment rails and stringent supervisory audits fuel sustained investment. The insurance segment, though smaller, is projected to post a 15.12% CAGR as NAIC’s Model Law and NYDFS Part 500 enforcement expand.
Within the segment, insurers deploy quantitative risk engines that link control maturity to underwriting capital, tying cybersecurity investments directly to premium pricing. Credit unions and payment processors follow suit, adapting bank-grade controls to lighter budget envelopes. Insurance providers’ embrace of threat-led red-team exercises broadens the BFSI security market, rewarding solution vendors that demonstrate measurable risk reduction in actuarial models. Overall, the vertical mix is diversifying, with non-bank entities accounting for a growing minority of total spend.
Geography Analysis
North America BFSI Security Market
North America commanded 36.10% of revenue in 2025 thanks to early adoption of NYDFS Part 500, CISA sector directives and a mature breach-notification regime that fines non-compliance within days. Competitive pressure among Tier-1 banks spurred multiyear platform refreshes that now trickle down to regional lenders and fintechs, solidifying the region’s leadership in the BFSI security market.
APAC BFSI Security Market
Asia-Pacific is expanding at a 14.72% CAGR, propelled by Singapore’s Shared Responsibility Framework and India’s AI-based fraud monitoring mandates. The BFSI security market size for Asia-Pacific grew past USD 26.4 billion in 2026, spurred by 31% of global cyber incidents targeting the region commonwealth.int. Local banks accelerate cloud adoption under regulatory sandbox regimes, while Japan and Australia push quantum-safe pilots, further widening growth differentials versus mature markets.
Europe BFSI Security Market
Europe holds significant weight via DORA, GDPR and the NIS 2 Directive. Harmonized supervisory expectations drive cross-border platform consolidation, giving rise to pan-European managed SOC hubs. The BFSI security market in Europe increasingly demands vendor evidence of full supply-chain resilience, including continuous third-party risk scoring and in-region key custody, keeping spending momentum steady through the decade.

Regulatory Landscape
BFSI security spending is increasingly shaped by operational-resilience and cyber-governance rules that require continuous control evidence, not periodic audits. In the European Union, the Digital Operational Resilience Act (DORA), Regulation (EU) 2022/2554, sets a harmonized ICT-risk baseline across financial entities, covering ICT risk management, incident handling, resilience testing, and third-party ICT oversight. Its Level-2 detail has been clarified through Commission Delegated Regulation (EU) 2024/1774, effective March 2024, including security policies and vulnerability management.
In the United States, federal banking expectations reinforce the need for a written information security program with administrative, technical, and physical safeguards (for example, under 12 CFR Part 208 and Part 225), alongside supervisory guidance from agencies such as the FDIC on IT and cybersecurity. At the state level, NYDFS 23 NYCRR Part 500 (Second Amendment) raises prescriptive obligations around cybersecurity policy governance, incident response, and business continuity, increasing the compliance pull-through for identity controls, monitoring, and response orchestration across banks and insurers operating in New York.
Competitive Landscape
Market consolidation intensified in 2024–2025 as boards insisted on platform rationalization to tame alert fatigue and redundancy. Palo Alto Networks’ USD 500 million purchase of IBM’s QRadar SaaS portfolio created a unified Cortex-centric stack spanning SIEM, XDR and compliance reporting. Cisco’s HyperShield integrates Splunk telemetry with autonomous segmentation, reflecting a shift toward AI-assisted remediation that slashes patch windows from weeks to minutes.
Quantum-safe encryption emerges as a battleground. Fitch Ratings notes that JPMorgan Chase and HSBC have piloted quantum key distribution, nudging incumbents to embed post-quantum algorithms across TLS, VPN and hardware security modules. Niche vendors offering lattice-based cryptography APIs attract venture funding as banks brace for Crypto-Agile transformation roadmaps.
Meanwhile, verticalized compliance solutions gain traction. Start-ups tailor dashboards for DORA or PCI DSS 4.0, integrating evidence collection and narrative-ready reporting. Larger vendors respond with modular packaging, allowing customers to subscribe to specific compliance regimes as plug-ins. Strategic alliances with global system integrators ensure turnkey delivery, while managed-service overlays help mid-tier banks circumvent talent shortages.
BFSI Security Industry Leaders
Symantec Corporation
Sophos Group Plc.
McAfee Inc.
IBM Corporation
Honeywell International Inc.
- *Disclaimer: Major Players sorted in no particular order
BFSI Security Market Companies Covered in this Report
- International Business Machines Corporation
- Cisco Systems, Inc.
- Symantec
- Sophos Group plc
- McAfee LLC
- Honeywell International Inc.
- Dell Technologies Inc. (EMC)
- DXC Technology Company
- Trend Micro Incorporated
- Booz Allen Hamilton Holding Corporation
- Palo Alto Networks, Inc.
- Fortinet, Inc.
- Check Point Software Technologies Ltd.
- Mandiant Corporation (Orange Cyberdefense)
- Okta, Inc.
- Darktrace plc
- Rapid7, Inc.
- Proofpoint, Inc.
- Splunk Inc.
- Imperva, Inc.

Market Opportunities and Future Outlook
Regulators and supervisors are turning AI-era cyber readiness into explicit deliverables, creating room for products that link identity assurance, attack-surface reduction, and continuous controls. In July 2026, the European Central Bank instructed supervised banks to submit formal defense plans against AI-powered cyberattacks by October 31, 2026, including steps to reduce internet-facing exposure and replace unsupported legacy systems. That requirement increases demand for asset discovery, vulnerability and patch orchestration, configuration hardening, and compensating controls that can generate audit-ready evidence across hybrid environments.
Platform-led security adoption through core technology providers is also becoming a pragmatic route for mid-tier institutions facing talent constraints and tool sprawl. In June 2026, Jack Henry announced a proprietary AI security platform built with Google Cloud capabilities and Mandiant incident-response consulting, reflecting a deeper embed of AI-enabled security controls within core banking ecosystems used by thousands of institutions. Payments modernization continues to pressure authentication, API security, and fraud controls, and the publication of the final agreed texts of PSD3 and the PSR on April 23, 2026 creates a new compliance and implementation window for secure open-banking access, strong customer authentication, and monitoring layers that extend to third-party providers.
Recent Industry Developments in BFSI Security Market
- July 2026: Coforge launched SecureEdge2Cloud, an AI-powered Zero Trust security platform built on the Zscaler Zero Trust Exchange architecture, targeting regulated industries including BFSI. The release supports consolidation around policy-driven access, inspection, and segmentation across users, branches, and cloud workloads, aligning with bank efforts to modernize controls while maintaining compliance.
- June 2026: Jack Henry announced a proprietary AI security platform built with Google Cloud and supported by Mandiant incident-response consulting. By packaging advanced security into a core technology provider stack used across many financial institutions, the move accelerates adoption of AI-assisted defense and standardizes security baselines for resource-constrained banks and credit unions.
- February 2026: IBM published its 2026 X-Force Threat Intelligence Index, highlighting vulnerability exploitation as the leading cause of attacks in 2025 (40%) and reporting a year-over-year surge in active ransomware groups (49%). The findings reinforce prioritization of vulnerability management, identity hardening, and automated detection and response programs within BFSI security roadmaps.


BFSI Security Market Report Scope and Research Methodology
Market Definition and Coverage
For this study, the BFSI security market is the spending by banks, financial institutions, and insurers on commercially available security solutions and services that protect people, branches, ATMs, networks, applications, identities, endpoints, and sensitive customer or transaction data.
Scope exclusions: We exclude purely in-house built tools that are not sold commercially, and cash handling or replenishment logistics that sit outside security technology and services.
Segments Covered in This Report
- By Security Type
- Information Security
- Physical Security
- By Service Type
- System Integration
- Maintenance
- Support
- By Deployment Model
- On-premises
- Cloud-based
- By Vertical
- Banking
- Insurance
- Other Financial Institutions
- By Geography
- North America
- United States
- Canada
- Mexico
- South America
- Brazil
- Argentina
- Rest of South America
- Europe
- Germany
- United Kingdom
- France
- Spain
- Italy
- Rest of Europe
- Asia-Pacific
- China
- Japan
- South Korea
- India
- Australia and New Zealand
- Rest of Asia-Pacific
- Middle East
- Israel
- Saudi Arabia
- United Arab Emirates
- Turkey
- Rest of Middle East
- Africa
- South Africa
- Egypt
- Nigeria
- Rest of Africa
- North America
Data Sources, Market Sizing, and Validation
Desk Research
Desk research was used to set the basic market boundaries and anchor the demand context, before interview led checks. We relied on public sources such as central bank and financial regulator publications, cybersecurity advisories from government agencies, law enforcement or CERT bulletins, and standards bodies that define security control expectations.
We also reviewed company filings, earnings decks, and product documentation to understand how security is packaged and priced across solutions and services. To supplement incident and compliance timing, we used reputable press and association websites. For cross-checking a few supplier and contract signals, we also used paid subscriptions for company financials and intelligence, news and financials, patents, and selected global tenders. These examples are not exhaustive, and we used additional public and paid sources to collect, validate, and clarify the final assumptions.
Primary Interviews and Surveys
Primary work focused on validating what gets purchased in BFSI security budgets, and how buying mix shifts between physical protection, identity, cloud, and managed services. We spoke with solution owners, security operations leaders, integration partners, and procurement stakeholders across key geographies. This helped close gaps from desk research and pressure test assumptions in areas like managed security adoption and how budgets are allocated between on-premises tools and externally delivered services.
Distribution of primary research fieldwork respondents
| Company type | Respondent position | Region |
|---|---|---|
| Top tier: 25% | CXOs: 13% | APAC: 45% |
| Mid tier: 58% | Functional/Unit leaders: 36% | EMEA: 34% |
| Smaller Players: 17% | Managers: 51% | Americas: 21% |
Market-Sizing & Forecasting
Sizing starts with a top-down build where overall BFSI technology and security spend signals are reconstructed using published regulatory and industry indicators. We then allocate those totals across major security domains based on adoption patterns and compliance intensity.
The totals are corroborated with selective bottom-up approximations, including sampling vendor revenue exposure to BFSI, channel checks on managed security penetration, and price per user or per device assumptions applied to addressable volumes.
Key inputs used in the model include digital banking and mobile transaction growth, cloud migration pace in financial institutions, identity and access management rollout coverage, branch and ATM footprint trends that influence physical security needs, and the frequency and severity pattern of reported cyber incidents. When data is missing at a country level, we use proxy ratios from similar markets and then correct them using interview feedback on local regulatory pressure and maturity. For forecasting, scenario analysis is used with a base case shaped by expert expectations on security budget growth, outsourcing rates, and product mix shifts between on-premises and cloud delivered controls.
Data Validation & Update Cycle
Outputs are checked against independent signals, including budget commentary, incident trends, and observable shifts in managed security uptake. We also review for unusual jumps across regions or solution buckets.
When a variance is found, assumptions are reworked, and targeted re-contacts are triggered to confirm whether the change reflects real market movement or a modeling artifact.
Before sign-off, the model goes through multi-step analyst reviews so math consistency, currency handling, and year-over-year logic are aligned. Reports are refreshed annually, and interim updates are made when major regulation changes, large breach waves, or material pricing shifts affect the demand outlook. Right before delivery, a final pass is completed so clients receive the most current view.
Mordor Intelligence's Bfsi Security Market Size Compared Against Other Published Estimates
Published BFSI security market numbers often differ because each study defines the market boundary in its own way, and then applies different assumptions for pricing, cloud adoption timing, and what counts as a BFSI-only security purchase.
By tracking solution and service coverage, currency timing, and refresh cadence, Mordor Intelligence keeps the estimate tied to commercial security spending by BFSI institutions, rather than blending adjacent IT categories or non-technology security activities.
Benchmark comparison
| Source | Market Size | Gaps in Research Methodology |
|---|---|---|
| Mordor Intelligence | USD 90.43 B (2026) | |
| Industry Publisher A | USD 74.22 B (2025) | Uses an earlier base year and a longer forecast window, and the scope framing leans on broad type buckets, which can compress current-year totals when cloud security and managed services are not fully captured at commercial spend levels. |
| Industry Publisher B | USD 71.90 B (2025) | Applies a different service split and regional mapping, and the treatment of integration, maintenance, and support can shift value between BFSI security and wider IT services, which changes the starting point for the forecast. |
The spread in values mainly comes from timing and boundary choices, especially how services are counted and how closely the estimate follows actual BFSI procurement versus wider IT spend. Using clear inclusion rules and repeatable checks on adoption and pricing keeps the final number easier to trace back to real demand drivers, and easier to update when market conditions change.


Key Questions Answered in the Report
What is the current size of the BFSI security market?
The BFSI security market size reached USD 90.43 billion in 2026 and is projected to hit USD 167.98 billion by 2031 at a 13.18% CAGR.
Which segment holds the largest share within the market?
Information Security dominated with 70.55% of BFSI security market share in 2025, reflecting regulatory focus on data and threat protection.
Which deployment model is expanding fastest?
Cloud-based solutions are the fastest-growing, expected to advance at 19.25% CAGR through 2031 as banks migrate workloads to scalable, AI-ready platforms.
How are quantum computing risks influencing spending?
Early pilots by major banks and Project Leap’s findings are prompting investment in quantum-safe cryptography, opening a new sub-segment within the market.
What drives the shift toward managed security services?
Talent shortages and 24/7 monitoring demands are motivating mid-tier institutions to outsource to managed SOC providers, fueling a 18.55% CAGR in this service line.
Page last updated on:


