Beer Packaging Market Size and Share
Market Overview
| Study Period | 2020 - 2031 |
|---|---|
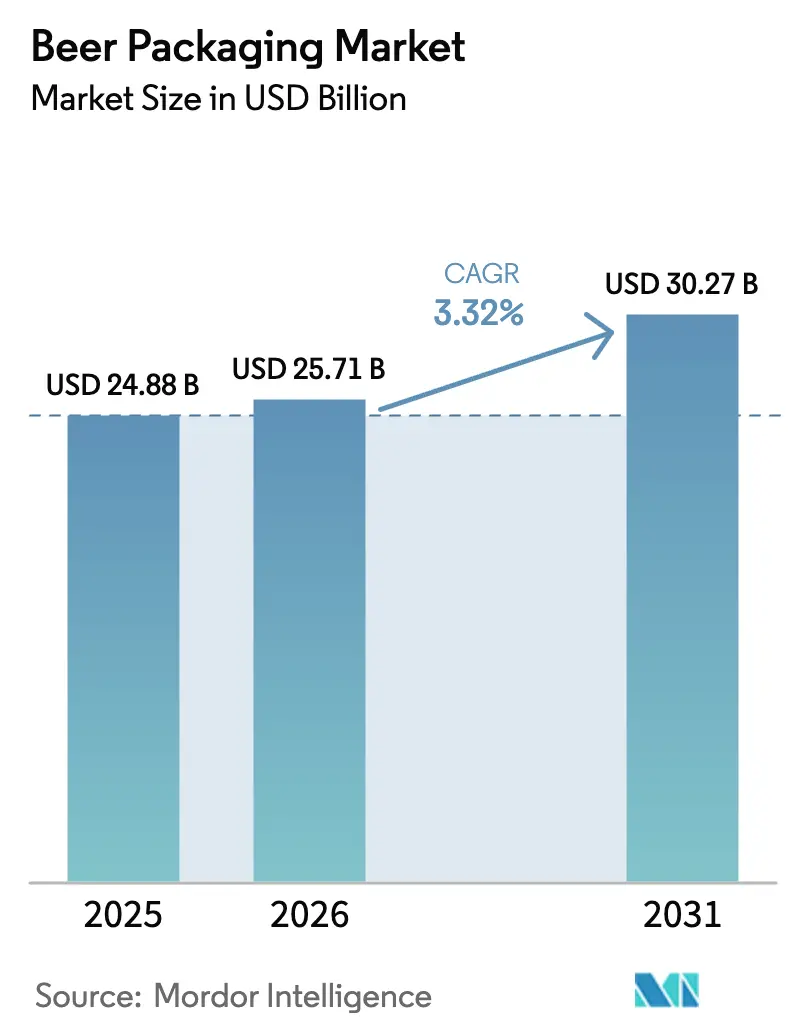
| Market Size (2026) | USD 25.71 Billion |
| Market Size (2031) | USD 30.27 Billion |
| Growth Rate (2026 - 2031) | 3.32% CAGR |
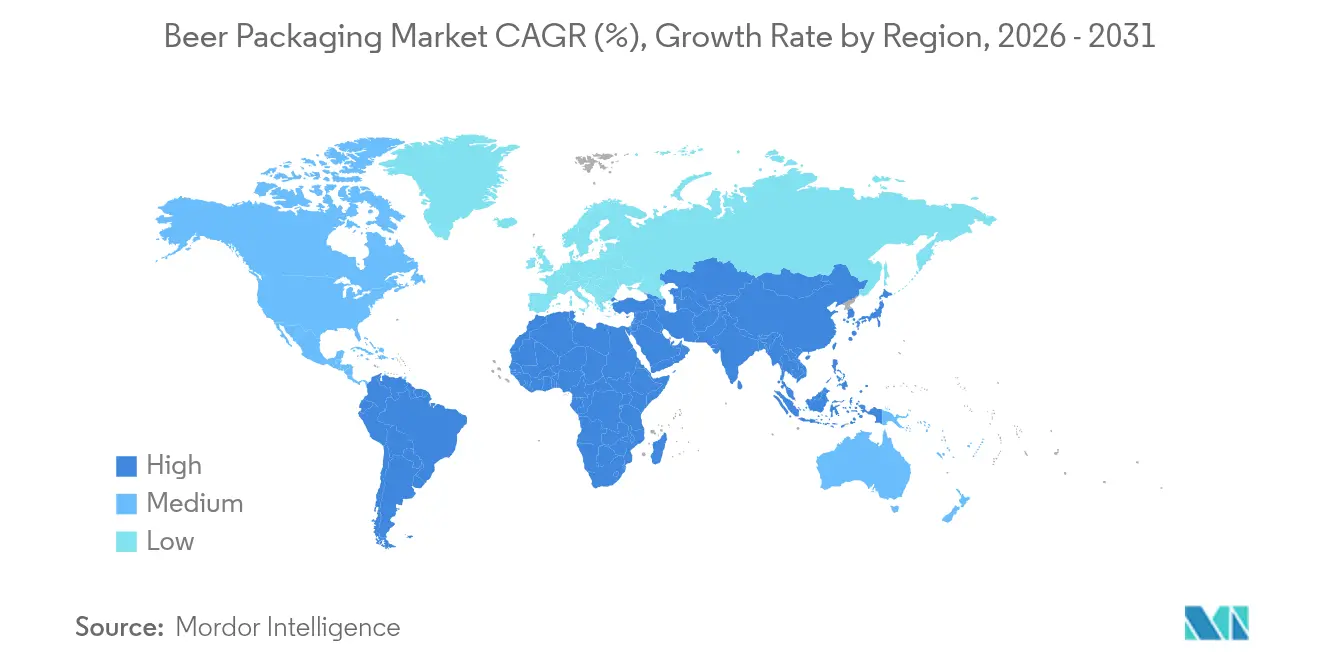
| Fastest Growing Market | North America |
| Largest Market | Asia Pacific |
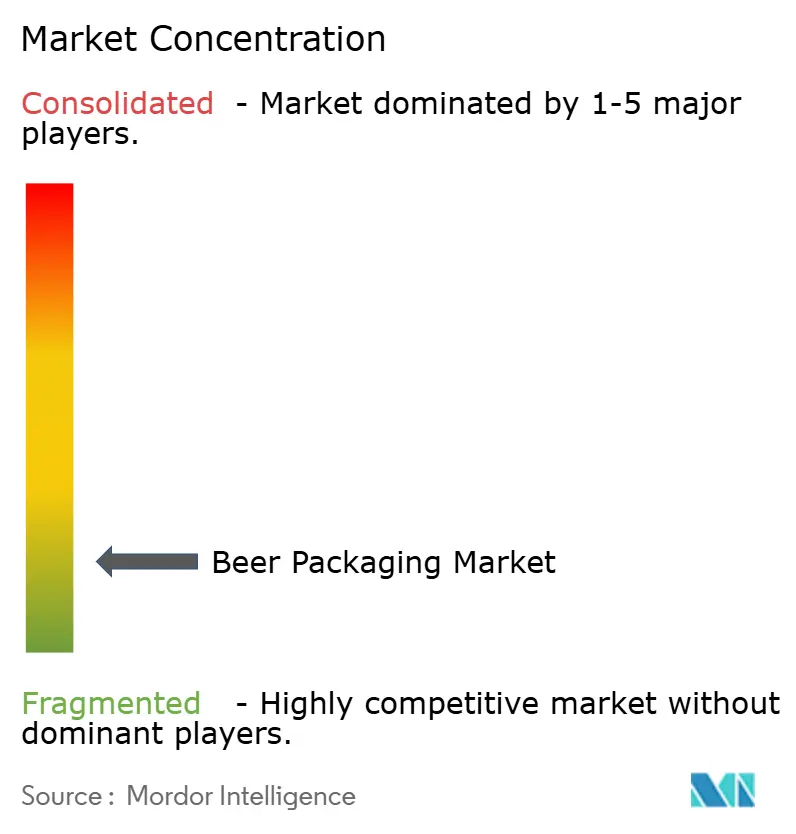
| Market Concentration | Low |
Major Players *Disclaimer: Major Players sorted in no particular order Image © Mordor Intelligence. Reuse requires attribution under CC BY 4.0. | |
Beer Packaging Market Analysis by Mordor Intelligence
Beer packaging market size in 2026 is estimated at USD 25.71 billion, growing from 2025 value of USD 24.88 billion with 2031 projections showing USD 30.27 billion, growing at 3.32% CAGR over 2026-2031. This growth reflects rising demand for sustainable materials, the acceleration of premium formats, and ongoing shifts in consumption channels. Aluminum’s share continues to expand as recyclability and logistics efficiency attract large and small brewers alike, while PET gains traction where cold-chain quality assurance is improving. Glass holds a clear lead in volume but now contends with cost pressures from energy-intensive production and heavier freight loads. Regional opportunities cluster in Asia-Pacific, where urbanization lifts packaged beer sales, and in North America, where craft breweries seek differentiated, eco-friendly formats that match retail shelf dynamics. Supply-side investments by leading can makers, glass producers, and flexible-pack specialists underline an industry pivot toward high-speed, low-waste technologies that cut material inputs and boost brand agility.
Key Report Takeaways
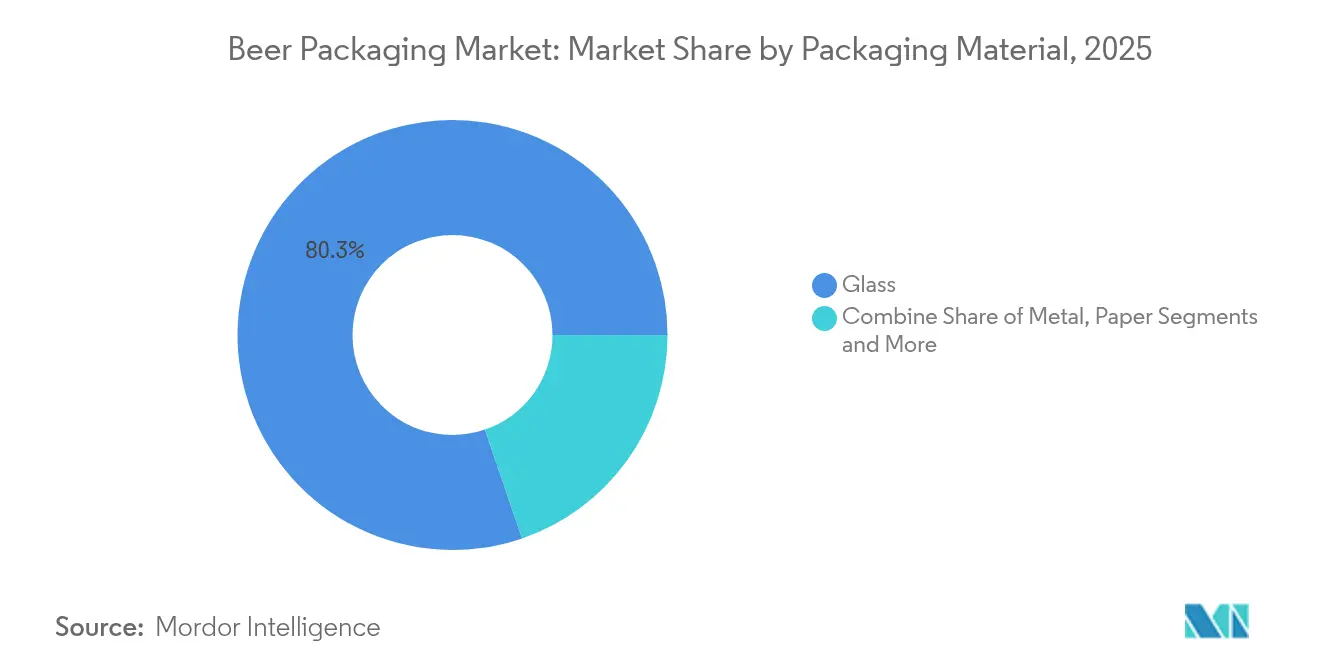
- By packaging material, glass commanded 80.25% of Beer packaging market share in 2025, while PET is projected to expand at a 5.52% CAGR through 2031.
- By packaging type, bottles led with a 74.64% share in 2025; cans are the fastest-growing at a 6.38% CAGR to 2031.
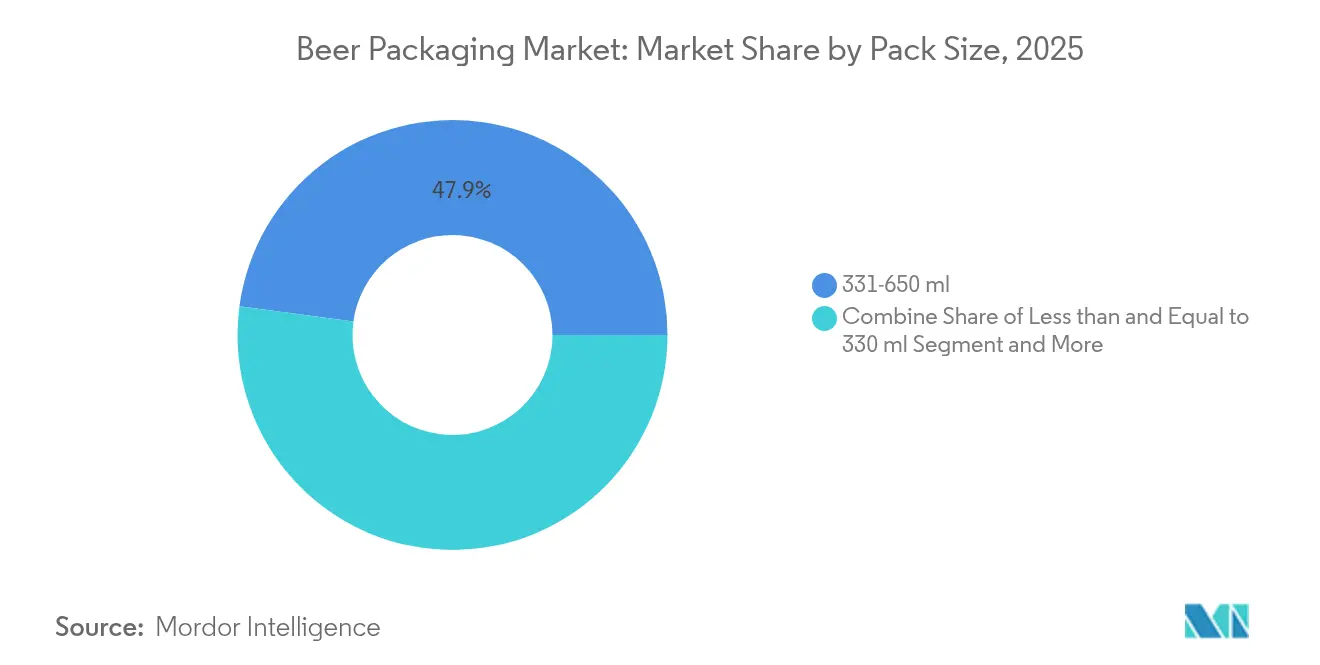
- By pack size, the 331–650 ml range accounted for 47.86% of Beer packaging market size in 2025, whereas formats above 650 ml are forecast to rise at a 4.89% CAGR.
- By distribution channel, direct sales captured 56.21% share in 2025, but indirect channels are advancing at a 4.31% CAGR.
- By geography, Asia-Pacific held 38.05% share in 2025; North America posts the strongest CAGR at 6.08% through 2031.
Note: Market size and forecast figures in this report are generated using Mordor Intelligence’s proprietary estimation framework, updated with the latest available data and insights as of 2026.
Global Beer Packaging Market Trends and Insights
Drivers Impact Analysis*
| Driver | (~) % Impact on CAGR Forecast | Geographic Relevance | Impact Timeline |
|---|---|---|---|
| Surge in craft breweries driving short-run can designs in North America | +0.8% | North America, expansion to Europe | Medium term (2–4 years) |
| Rising adoption of lightweight returnable glass bottles backed by EU deposit-return schemes | +0.6% | Europe, notably Germany and France | Long term (≥ 4 years) |
| Rapid cold-chain expansion enabling PET penetration in Asian beer | +0.5% | Asia-Pacific, Southeast Asia focus | Medium term (2–4 years) |
| Brand premiumization fueling embossed specialty bottles among German breweries | +0.4% | Europe, premium segments | Long term (≥ 4 years) |
| Aluminum tariff cuts triggering can conversions in South America | +0.3% | South America, Brazil and Argentina | Short term (≤ 2 years) |
| E-commerce multipacks accelerating corrugated secondary packaging demand in the UK | +0.2% | Global, early adoption in the UK and North America | Medium term (2–4 years) |
| Source: Mordor Intelligence | |||
Surge in Craft Breweries Driving Short-Run Can Designs in North America
Craft brewery growth reshapes packaging economics as digital printing such as Ball’s Dynamark Advanced Pro lets multiple graphics run on one pallet, eliminating historic minimum-order barriers. [1]Ball Corporation, “Ball Introduces New Era of its Dynamark Printing Technology in EMEA,” ball.comFlexible can lines help brewers manage inventory, pilot new SKUs, and execute seasonal launches without excess glass bottle purchases. Though digital print premiums approach 300% over offset, the cost is offset by faster sell-through rates and stronger shelf appeal at more than 9,000 breweries across the region.
Rising Adoption of Lightweight Returnable Glass Bottles Backed by EU Deposit-Return Schemes
Mandated deposit systems achieve 98% return rates in Germany, prompting innovations like Vetropack’s Echovai tempered bottle that is 30% lighter yet rugged across multiple cycles.[2]Vetropack, “Echovai,” vetropack.com France’s rollout adds centralized washing hubs capable of 60 million bottles per year, shifting cost structures from one-way disposal toward circular asset management.
Rapid Cold-Chain Expansion Enabling PET Penetration in Asian Beer
Plasma-assisted chemical vapor deposition boosts oxygen-barrier performance by over 1,000-fold, letting PET maintain carbonation for extended shipping. Vietnam’s domestic converters scale capacity as island supply routes and urban on-the-go demand favor lighter bottles that cut freight costs by 70% versus glass.
Brand Premiumization Fueling Embossed Specialty Bottles Among German Breweries
Krombacher’s USD 107 million bottling revamp installs smart sorters and variable molds supporting artisanal embossing, while Veltins’ new lines hit 130,000 bottles per hour. Embossed glass pairs tactile cues with heritage designs to justify higher price points during premiumization.
Restraints Impact Analysis*
| Restraint | (~) % Impact on CAGR Forecast | Geographic Relevance | Impact Timeline |
|---|---|---|---|
| Legislative bans on single-use plastics curtailing PET in Europe | -0.9% | Europe, potential wider adoption | Medium term (2–4 years) |
| Tight U.S. aluminum slab supply elevating can costs for craft brewers | -0.7% | North America, global aluminum effects | Short term (≤ 2 years) |
| Consumer shift to hard seltzers reducing glass volumes in Australia | -0.4% | Australia, regional spillover | Medium term (2–4 years) |
| High cap-ex for keg refurbishment limiting returnability in emerging markets | -0.3% | Emerging markets, infrastructure gap | Long term (≥ 4 years) |
| Source: Mordor Intelligence | |||
Legislative Bans on Single-Use Plastics Curtailing PET in Europe
The EU Packaging and Packaging Waste Regulation enforces 30% recycled content by 2030 and phases out targeted formats from 2025. [3]European Parliament, “New EU rules to reduce, reuse and recycle packaging,” europarl.europa.euExtended Producer Responsibility fees raise PET costs relative to infinitely recyclable aluminum, prompting portfolio shifts toward metal and lightweight returnable glass.
Tight U.S. Aluminum Slab Supply Elevating Can Costs for Craft Brewers
Only five domestic smelters remain, and a 25% tariff imposed in 2025 worsens input shortages. Craft brewers, buying via distributors, pay mark-ups that threaten seasonal release timing and force reconsideration of glass despite higher freight expenses.
*Our forecasts treat driver/restraint impacts as directional, not additive. The impact forecasts reflect baseline growth, mix effects, and variable interactions.
Segment Analysis
By Packaging Material: Aluminum and PET Erode Long-Held Glass Advantage
Glass preserved an 80.25% share in 2025 due to sensory neutrality and entrenched consumer associations. Yet aluminum’s recyclability edge and transportation savings peel away volume, aided by policy targets for 100% recyclable packaging by 2030. PET, advancing at 5.52% CAGR, draws on barrier-coated bottles that now satisfy beer’s carbonation needs, while paper remains confined to secondary packs.
Rising energy costs and carbon levies widen aluminum’s total-cost edge over furnace-fired glass. Meanwhile, innovations like bio-paraxylene PET from used cooking oil improve brand credentials and foreshadow broader polymer adoption. Brewers keep niche glass SKUs for premium variants, but the Beer packaging market increasingly redirects new capacity toward lighter substrates.


By Packaging Type: Bottle Legacy Versus Can Momentum
Bottles supplied 74.64% of global volume in 2025. Still, cans are accelerating at a 6.38% CAGR as dynamism in craft beer, convenience shopping, and outdoor consumption tips formats in favor of metal. Keg growth remains muted by cleaning-system cap-ex in emerging regions, and pouches stay marginal.
Digital printing lets small brewers match multinational packaging quality, increasing SKU churn without wasteful overruns. Investment in regional can lines, as seen in Brazil, further scales economies that shrink per-unit costs and enhance availability.
Glass manufacturers counter with embossing and tapered profiles that lift perceived value on-premise.
By Pack Size: Mid-Range Stability with Upsized Premium Plays
The 331–650 ml range represented 47.86% of Beer packaging market size in 2025, offering price-per-sip balance across mainstream retail. Larger bottles above 650 ml rise at 4.89% CAGR, leveraged by craft brewers who position 750 ml formats as shareable, gift-ready experiences. Small cans and stubbies retain a role in regulated portion markets but face cost-of-goods pressure where packaging weight represents a bigger cost share.
Capacity upgrades that hit six-figure bottle-per-hour rates allow simultaneous runs of multiple sizes, reducing changeover time and supporting seasonal mixed-pack strategies. Logistics efficiencies favor bigger units for export corridors, while convenience stores prioritize mid-sizes that fit limited shelf footprints.
By Distribution Channel: Direct Dominates Yet Omnichannel Gains
Direct brewery-to-retail pathways held 56.21% share in 2025, driven by on-premise keg and bottle return loops. However, indirect channels grow faster at 4.31% CAGR as supermarkets, convenience stores, and e-commerce enlarge their beer aisles. Corrugated shippers designed for doorstep delivery reshape secondary packaging, embedding QR codes that guide consumers to brand content.
Contract brewing agreements, like Pabst’s 2025 switch to Anheuser-Busch InBev plants, demonstrate hybrid models that blend scale efficiency with brand autonomy. Breweries diversify route-to-market choices to buffer against demand shocks and tariff-driven margin swings.
Geography Analysis
Asia-Pacific led with 38.05% share in 2025, underpinned by population scale, climbing incomes, and rapid urbanization that favor packaged formats. Cold-chain expansion in Vietnam and Indonesia supports PET penetration, while China’s craft segment grew to CNY 33.1 billion in 2024, fostering boutique can designs and gift-oriented glass bottles alike.
North America posts the fastest 6.08% CAGR through 2031. More than 9,000 craft breweries generate steady demand for short-run cans, though tariff and slab shortages inflate costs. Investments such as Ball’s Florida acquisition streamline supply networks and add sustainable capacity, reinforcing aluminum’s role as the region’s growth engine.
Europe remains a premium stronghold but confronts flat per-capita beer intake. The EU’s recyclability mandate triggers capital shifts into tempered, returnable glass and high-recycled-content cans. German breweries showcase premium packaging by installing embossed lines that hit industrial speeds while meeting circular-economy KPIs.

Competitive Landscape
The Beer packaging market is fragmented, with strategic moves centered on sustainability, scale, and digital workflow. Crown Holdings operates 195 plants across 39 nations, deriving 67% of revenue from beverage cans and expanding high-speed South American lines. Ball ships roughly 48 billion aluminum containers annually in North America, owns 34% regional share, and has set a 55% greenhouse-gas cut target for 2030.
M&A furthers material science reach: Ball bought Spain-based Alucan in 2024 to broaden extruded packaging, while Amcor’s USD 8.43 billion union with Berry Global aims for USD 650 million synergies and stronger bio-based polymer R&D. Glass suppliers answer with tempered, light-weight tech and high-speed digital decoration that preserve heritage aesthetics while lowering carbon.
Digital print, barrier coatings, and smart QR labels form the next battleground. Dynamark’s pallet-level art variation democratizes limited-edition releases, while PET coatings extend shelf life to unlock regions where cold storage was once a constraint. Leading suppliers channel R&D toward these value-added areas to defend share against agile newcomers.
Beer Packaging Industry Leaders
Amcor Limited
Crown Holdings Incorporated
Ball Corporation
Tetra Laval International SA
O-I Glass Inc.
- *Disclaimer: Major Players sorted in no particular order

Recent Industry Developments
- April 2025: Amcor completed an all-stock combination with Berry Global, projecting USD 3 billion annual cash flow and USD 650 million synergies.
- February 2025: Crown Holdings expanded its Ponta Grossa beverage-can plant in Brazil with new high-speed lines to serve alcoholic and non-alcoholic customers.
- February 2025: Ball Corporation acquired Florida Can Manufacturing to optimize its North American can network and bolster sustainable capacity.
- January 2025: Pabst Brewing Company signed a contract-brewing deal with Anheuser-Busch InBev to replace its prior Molson Coors partnership.


Global Beer Packaging Market Report Scope
Beer packaging is an extremely important process in the production, transport, and sale of this beverage. Beverages can be bottled in glass bottles, PET bottles, and cans.
The market is segmented by packaging material, packaging type, and geography. By packaging material, the market is segmented into glass, metal, and PET. By packaging type, the market is segmented into bottles, pegs, and cans. By geography, the market is divided into North America, Europe, Asia-Pacific, Latin America, and Middle East and Africa.
| Glass |
| Metal |
| PET |
| Paper |
| Bottle |
| Can |
| Keg |
| Pouches |
| Less than 330 ml |
| 331-650 ml |
| More than 650 ml |
| Direct Sales |
| Indirect Sales |
| North America | United States | |
| Canada | ||
| Mexico | ||
| Europe | Germany | |
| United Kingdom | ||
| France | ||
| Italy | ||
| Spain | ||
| Russia | ||
| Rest of Europe | ||
| Asia-Pacific | China | |
| India | ||
| Japan | ||
| South Korea | ||
| Australia and New Zealand | ||
| Rest of Asia-Pacific | ||
| Middle East and Africa | Middle East | United Arab Emirates |
| Saudi Arabia | ||
| Turkey | ||
| Rest of Middle East | ||
| Africa | South Africa | |
| Nigeria | ||
| Egypt | ||
| Rest of Africa | ||
| South America | Brazil | |
| Argentina | ||
| Rest of South America | ||
| By Packaging Material | Glass | ||
| Metal | |||
| PET | |||
| Paper | |||
| By Packaging Type | Bottle | ||
| Can | |||
| Keg | |||
| Pouches | |||
| By Pack Size | Less than 330 ml | ||
| 331-650 ml | |||
| More than 650 ml | |||
| By Distribution Channel | Direct Sales | ||
| Indirect Sales | |||
| By Geography | North America | United States | |
| Canada | |||
| Mexico | |||
| Europe | Germany | ||
| United Kingdom | |||
| France | |||
| Italy | |||
| Spain | |||
| Russia | |||
| Rest of Europe | |||
| Asia-Pacific | China | ||
| India | |||
| Japan | |||
| South Korea | |||
| Australia and New Zealand | |||
| Rest of Asia-Pacific | |||
| Middle East and Africa | Middle East | United Arab Emirates | |
| Saudi Arabia | |||
| Turkey | |||
| Rest of Middle East | |||
| Africa | South Africa | ||
| Nigeria | |||
| Egypt | |||
| Rest of Africa | |||
| South America | Brazil | ||
| Argentina | |||
| Rest of South America | |||


Key Questions Answered in the Report
What is the projected CAGR for the Beer packaging market from 2026 to 2031?
The market is forecast to expand at a 3.32% CAGR over the period.
Which packaging material is growing fastest in the Beer packaging industry?
PET shows the highest growth, advancing at a 5.52% CAGR through 2031 after recent barrier-coating breakthroughs.
Why are aluminum cans gaining share against glass bottles?
Aluminum offers lighter weight, infinite recyclability, and now benefits from digital printing that lowers minimum runs, helping breweries meet sustainability and convenience demands.
Which region will post the quickest Beer packaging market growth?
North America leads growth with a 6.08% CAGR, driven by craft brewery expansion and preference for recyclable cans.
How are EU regulations affecting packaging choices?
New rules require 100% recyclable formats by 2030 and higher recycled content, pushing brewers toward aluminum and lightweight returnable glass while restricting certain single-use plastics.
What role does e-commerce play in Beer packaging trends?
Online sales stimulate demand for robust corrugated secondary packs that protect products in transit and deliver a branded unboxing experience aligned with sustainability targets.
Page last updated on:


