Barrier Systems Market Size and Share
Market Overview
| Study Period | 2020 - 2031 |
|---|---|
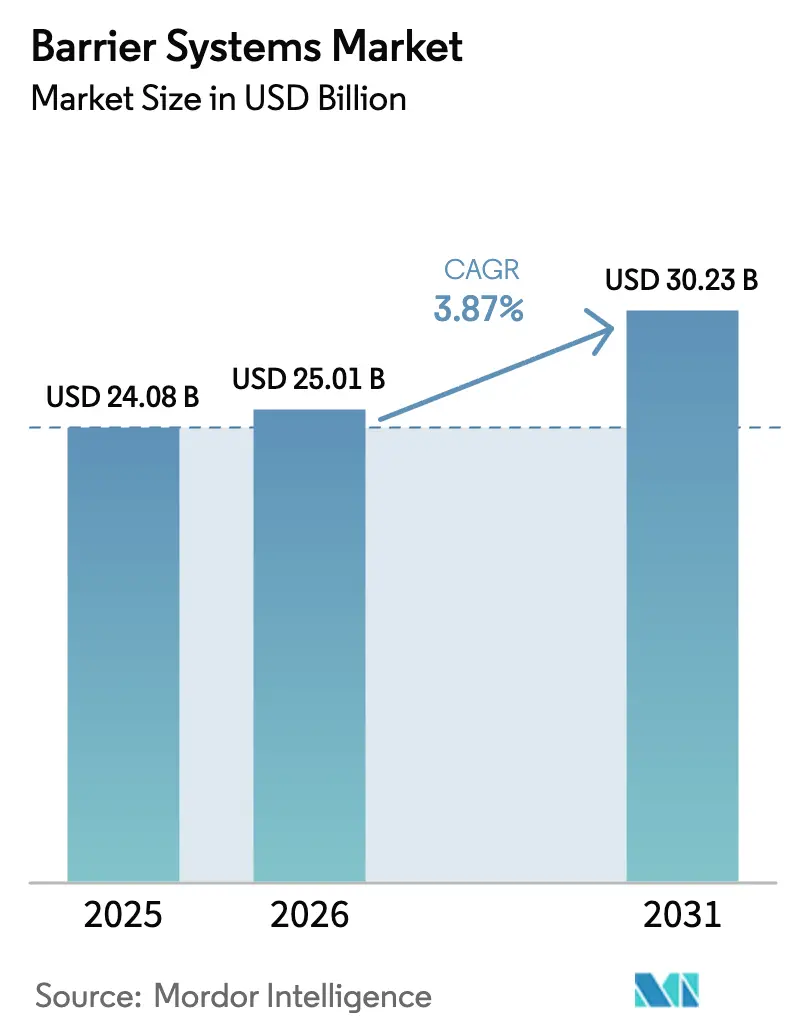
| Market Size (2026) | USD 25.01 Billion |
| Market Size (2031) | USD 30.23 Billion |
| Growth Rate (2026 - 2031) | 3.87% CAGR |
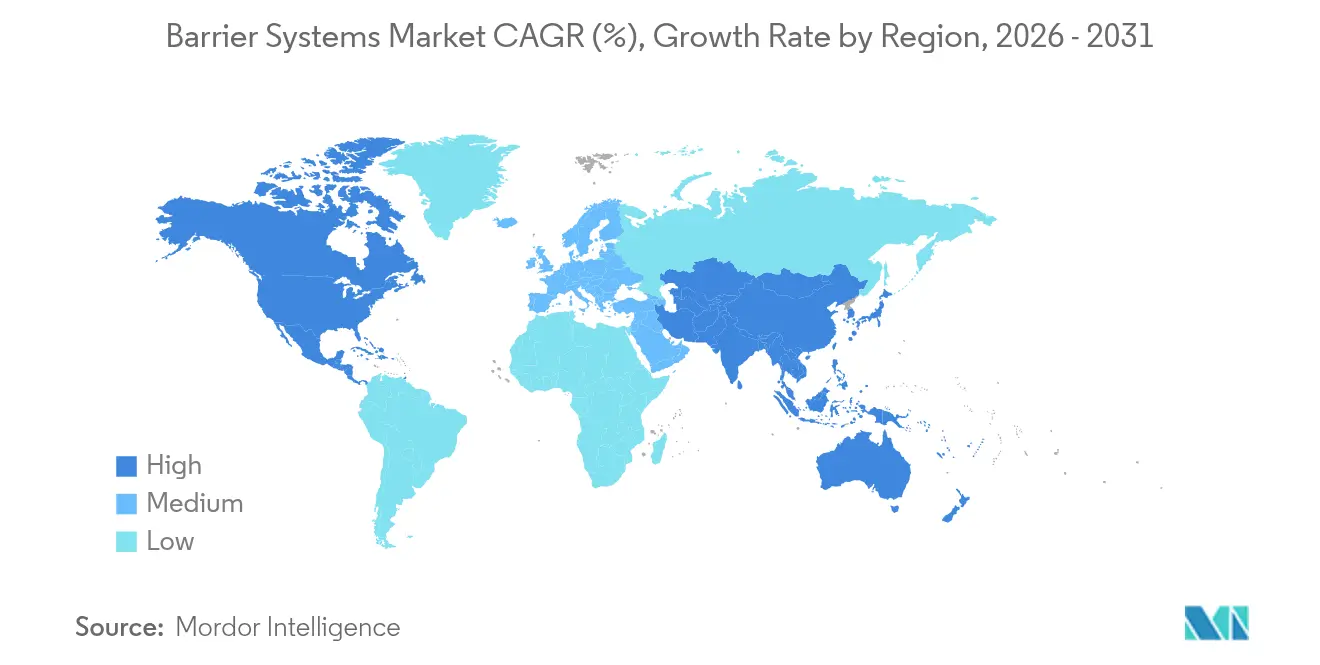
| Fastest Growing Market | Asia Pacific |
| Largest Market | North America |
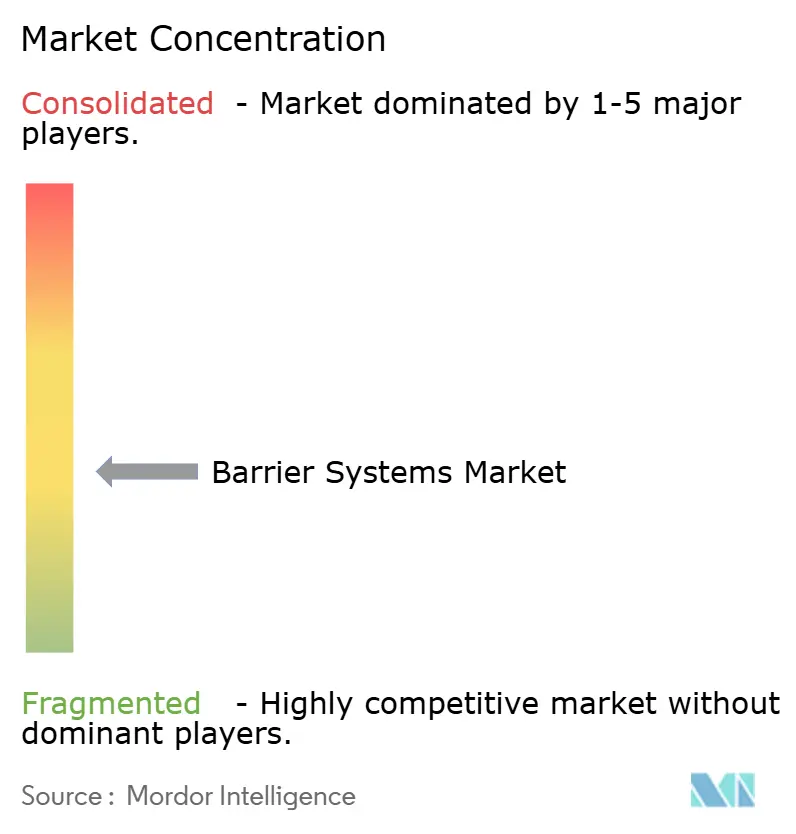
| Market Concentration | Medium |
Major Players *Disclaimer: Major Players sorted in no particular order Image © Mordor Intelligence. Reuse requires attribution under CC BY 4.0. | |
Barrier Systems Market Analysis by Mordor Intelligence
barrier systems market size in 2026 is estimated at USD 25.01 billion, growing from 2025 value of USD 24.08 billion with 2031 projections showing USD 30.23 billion, growing at 3.87% CAGR over 2026-2031. Growing integration of connected sensors, edge analytics and autonomous-vehicle guidance is shifting demand away from purely passive highway products toward smart perimeter and traffic-management solutions that command premium prices. Governments in both developed and emerging economies are funding longer-lived, climate-resilient infrastructure, which favours composite and modular barriers over traditional fixed steel systems. As a result, the barrier systems market is expanding beyond its historical dependence on crash-restraint applications to serve urban security, logistics hubs and border control installations. Vendors able to combine advanced materials, embedded electronics and lifecycle service contracts continue to gain share, while those tied to commodities struggle with volatile steel and polymer prices that erode margins.
Key Report Takeaways
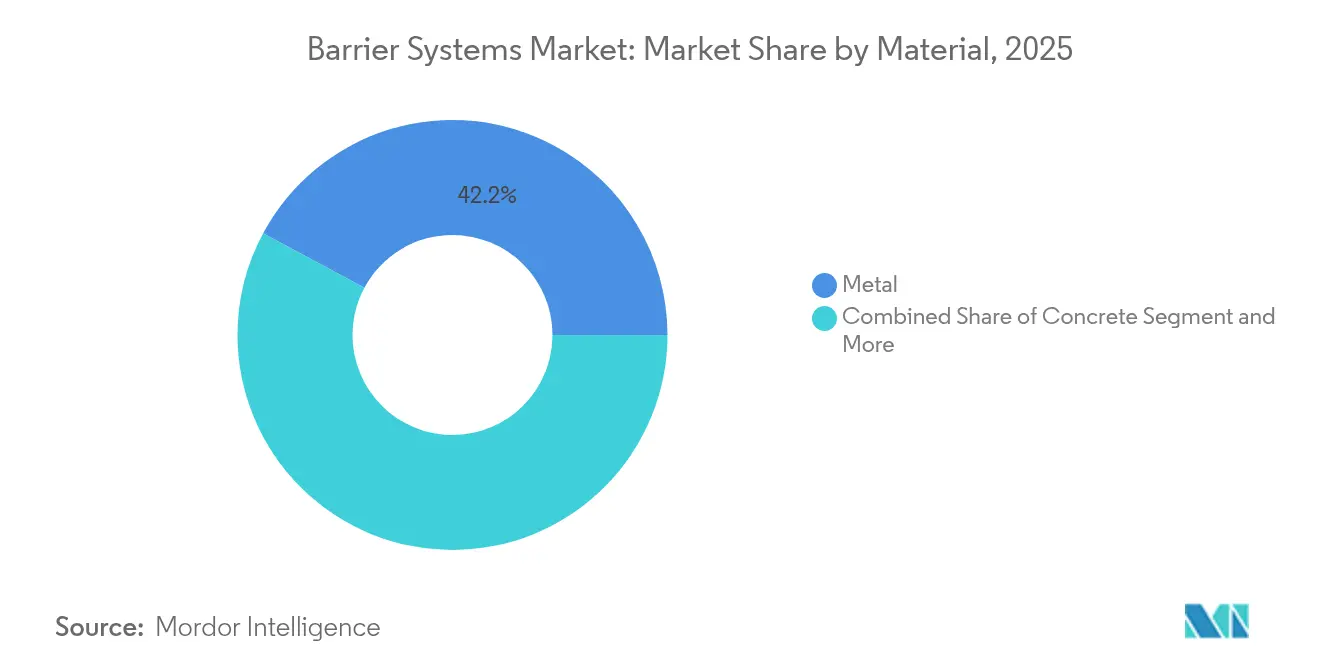
- By material, metal barriers captured 42.15% of barrier systems market share in 2025, whereas plastic and composite designs are forecast to grow 12.10% CAGR through 2031.
- By type, Crash barrier systems captured 34.20% of barrier systems market share in 2025, whereas Bollards designs are forecast to grow 11.10% CAGR through 2031
- By End-user, the roadways segment held 52.90% of barrier systems market share in 2025; commercial installations are projected to expand at 12.70% CAGR through 2031.
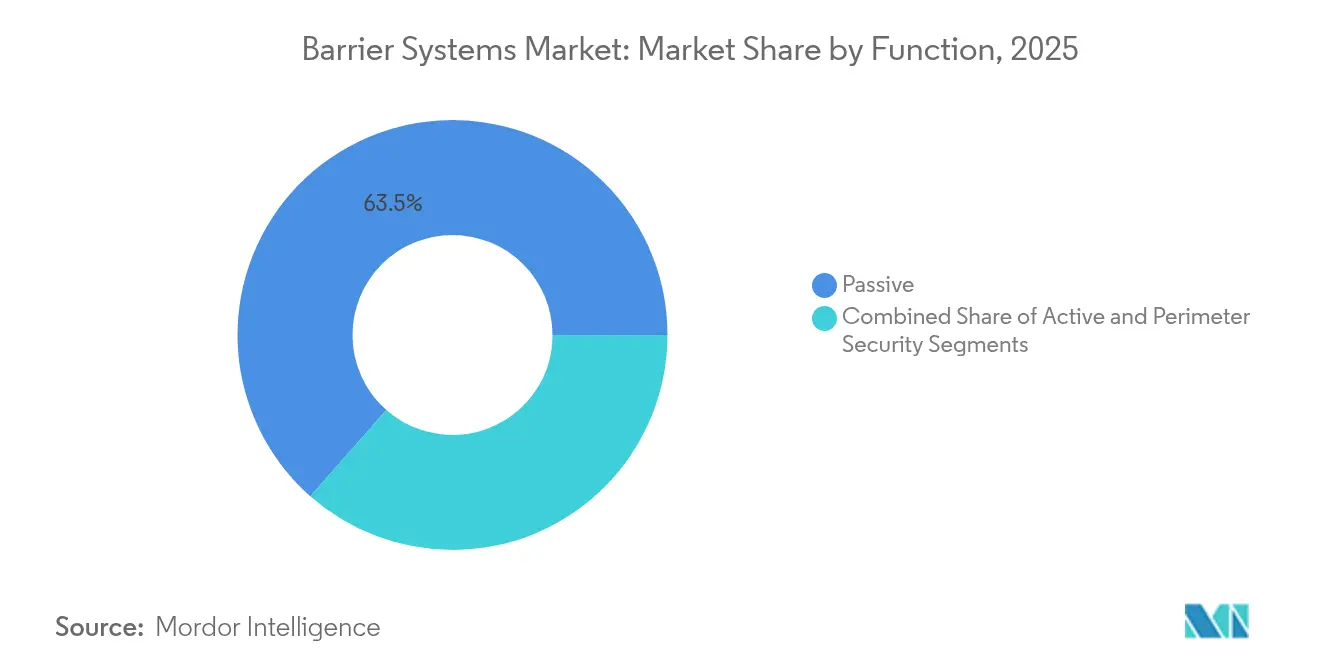
- By function, passive fixed products retained 63.50% revenue in 2025, yet active automated solutions are rising at 13.00% CAGR to 2031.
- By technology, semi-rigid designs contributed 45.10% revenue in 2025; flexible systems are poised for 14.00% CAGR growth through 2031.
- By geography, North America led with 32.40% revenue share in 2025, while Asia-Pacific is advancing at a 9.10% CAGR, the fastest worldwide.
Note: Market size and forecast figures in this report are generated using Mordor Intelligence’s proprietary estimation framework, updated with the latest available data and insights as of 2026.
Global Barrier Systems Market Trends and Insights
Drivers Impact Analysis*
| Driver | (~) % Impact on CAGR Forecast | Geographic Relevance | Impact Timeline |
|---|---|---|---|
| Surge in global transport infrastructure spend | +1.2% | Global, concentrated in Asia-Pacific and MEA | Medium term (2-4 years) |
| Heightened road-safety regulations | +0.8% | North America and EU, expanding to Asia-Pacific | Long term (≥ 4 years) |
| Urban security and perimeter protection demand | +0.9% | Global urban centers, critical infrastructure zones | Short term (≤ 2 years) |
| IoT-enabled "smart" barrier deployments | +0.6% | North America, EU, advanced Asia-Pacific markets | Medium term (2-4 years) |
| Use of recycled polymer composites | +0.4% | EU leading, North America following | Long term (≥ 4 years) |
| Climate-resilient modular barriers for disaster zones | +0.3% | Coastal regions globally, flood-prone areas | Medium term (2-4 years) |
| Source: Mordor Intelligence | |||
Surge in Global Transport Infrastructure Spend
Public spending bills are funding thousands of highway and street upgrades, with the U.S. Infrastructure Investment and Jobs Act alone underwriting more than 40,000 active projects. Mega-schemes such as Thailand’s Landbridge corridor illustrate how new ports, roadways, and logistics districts demand multipurpose barriers that combine vehicle restraint, automated traffic redirection, and remote health monitoring. Procurement teams increasingly judge bids on lifetime value, thus favoring modular assets that shorten installation windows, cut maintenance callouts, and feed real-time condition data to asset-management dashboards. These preferences support steady expansion in the barrier systems market by rewarding suppliers offering sensor-ready composites and predictive-maintenance software rather than commodity hardware alone.
Heightened Road-Safety Regulations
The latest Manual for Assessing Safety Hardware has tightened crash-test criteria, prompting agencies to specify designs that absorb more kinetic energy without letting vehicles vault over roadside obstacles[1]U.S. Federal Highway Administration, “Manual for Assessing Safety Hardware,” fhwa.dot.gov. Parallel European standards now require products to protect pedestrians and cyclists as rigorously as vehicle occupants, pushing demand for multi-functional parapets and non-gating terminals. R&D spending is therefore migrating toward energy-absorbing geometries and hybrid materials that deliver lighter weight and easier upkeep. Larger manufacturers with in-house test tracks can comply faster, while smaller firms must partner or exit, reinforcing consolidation trends already visible in the barrier systems market.
Urban Security and Perimeter Protection Demand
Commercial landlords and municipal planners seek unobtrusive hostile-vehicle mitigation that doubles as public furniture. Certified retractable bollards, crash-rated planters, and sculptural barriers satisfy both security and aesthetic codes, carving out premium niches the barrier systems market has only recently addressed. Airports, stadiums, and embassies now integrate barriers with video analytics and access-control platforms so that threats can be stopped, verified and logged in one workflow. Vendors able to harmonize structural, electronic, and architectural requirements win contracts at healthy margins, while legacy highway suppliers risk relegation to low-growth projects.
IoT-enabled "Smart" Barrier Deployments
Edge-computing pilots demonstrate that connected barriers can relay stress loads, impact events, and traffic intensity in real time to maintenance teams. The USD 2.5 billion Illinois Tollway smart-road upgrade is retrofitting lanes with sensors that talk to automated lane-control and connected-vehicle systems. Such projects push the barrier systems market toward service-oriented revenue because operators sign multi-year data and software contracts, beside physical equipment orders. Competitors rooted in steel fabrication must therefore build electronics partnerships or acquire integration talent to stay relevant.
Restraint Impact Analysis*
| Restraint | (~) % Impact on CAGR Forecast | Geographic Relevance | Impact Timeline |
|---|---|---|---|
| High installation and life-cycle costs | -0.7% | Global, intensifying in price-sensitive regions | Short term (≤ 2 years) |
| Volatile steel & polymer prices | -0.5% | All major manufacturing hubs | Short term (≤ 2 years) |
| Public opposition over aesthetics & noise | -0.3% | Urban districts in developed markets | Medium term (2-4 years) |
| Integration issues with autonomous vehicles | -0.2% | North America, EU, Japan | Long term (≥ 4 years) |
| Source: Mordor Intelligence | |||
High Installation and Life-Cycle Costs
Advanced barriers require specialist lifting equipment, precision surveys and extensive cabling, which can inflate project budgets by double-digit percentages in developing economies. Maintenance becomes costlier once electronics enter the mix, as field crews need diagnostic tools and replacement sensor kits that seldom are covered in original bids. Operators, therefore, run detailed total-cost-of-ownership models before issuing tenders. Solutions that prove lower downtime through modular electronics or self-diagnostic firmware see better uptake, while experimental designs without extensive track records struggle to pass economic scrutiny within the barrier systems market.
Volatile Steel and Polymer Prices
Sharp swings in benchmark steel pricing—Nucor’s spot sheet averaged USD 930 per ton in early 2025—force suppliers to hedge raw-material exposure, sometimes trimming margins to honour long-term public contracts. Polymer resins also track energy markets, adding unpredictability to composite cost structures. Smaller producers that lack diversified sourcing or flexible formulations find it hard to finalize quotations six to nine months ahead, leading to order deferrals and tender cancellations. The need for price-stable alternatives elevates recycled composites and hybrid systems, which partly decouple material cost from petroleum or iron ore indices, yet buyers remain cautious until durability data emerges.
*Our forecasts treat driver/restraint impacts as directional, not additive. The impact forecasts reflect baseline growth, mix effects, and variable interactions.
Segment Analysis
By Material: Sustainable Composites Challenge Steel Dominance
Metal barriers remain the backbone of highway safety, accounting for 42.15% of the barrier systems market share in 2025. Composite and recycled-plastic variants, however, are climbing at a 12.10% CAGR as regulators push for lower carbon footprints and corrosion resistance. The barrier systems market size for composite products is therefore expanding faster than any other material class, supported by supply chains that capture post-consumer plastics and industrial scrap for circular production. Concrete units keep relevance where maximum mass is non-negotiable, such as median separations in high-speed corridors. Wood retains niche value in scenic or protected landscapes, yet its limited weather tolerance curbs wide adoption.
Manufacturers with extrusion or pultrusion expertise gain strategic advantage because composite modules can be prefabricated and installed in fewer shifts, reducing lane-closure penalties. Life-cycle savings help asset owners recoup higher upfront costs, especially when embedded sensor slots eliminate the need for on-site drilling. Conversely, steel-centric firms face margin pressure unless they pivot toward galvanized or low-alloy alternatives that stretch maintenance intervals. This material transition underscores how sustainability policies are reshaping technical road-maps across the barrier systems market.


By Type: Bollards Emerge as Fastest-Growing Category
Crash-tested roadside barriers delivered 34.20% revenue in 2025, but bollards are on track for 11.10% CAGR because dense urban zones prioritise selective vehicle denial over continuous fencing. Airports, pedestrian malls and corporate campuses favour retractable bollards that integrate with badge readers and emergency override panels, giving security teams dynamic control without obstructing daily logistics. Fences and gates still dominate border and industrial perimeter briefs where cost per linear metre matters most.
Crash-cushion devices and temporary portable barriers are gaining share in work-zone safety and event management thanks to lightweight energy-absorbing cartridges that crews can deploy within minutes. Technological overlap between bollards and automated access systems is encouraging partnerships between civil-works companies and building-automation vendors. This convergence illustrates how rising urban security needs are diversifying revenue pools within the barrier systems market.
By End User: Commercial Sector Drives Market Evolution
Roadway authorities purchased 52.90% of 2025 shipments, yet corporate campuses, data centers and retail districts are fueling a 12.70% CAGR in commercial spending. These customers view high-spec perimeter security as mandatory for liability management and business continuity, not discretionary décor. The barrier systems market size for commercial installations is forecast to climb steadily through 2031 as insurance premiums fall for properties equipped with certified hostile-vehicle mitigation.
Rail, defence and airport operators maintain stable requisitions because their missions hinge on regulated protection standards. Residential demand is steady but opportunistic, activated when municipalities introduce traffic-calming subsidies or when gated communities upgrade amenities. Vendors that understand private-sector procurement cycles and can document return-on-investment through lower vandalism and downtime costs secure long-term framework agreements in the barrier systems market.
By Function: Active Systems Gain Traction Despite Passive Dominance
Passive fixed products still manage 63.50% revenue because they remain the simplest way to meet baseline safety codes. Active barriers—hydraulic bollards, movable crash gates and automated rising beams—are advancing at 13.00% CAGR because facility operators need assets that reconfigure lanes in seconds. The barrier systems market size for active products will climb each year as smart-city budgets earmark funds for real-time traffic diversion and emergency route clearing.
Suppliers of programmable controllers, cloud analytics and wireless diagnostics command higher margins than hardware alone, turning active-barrier projects into ongoing subscription models. Integration complexity creates openings for specialist systems integrators who coordinate legacy traffic-lights, CCTV and SCADA feeds with new actuators. This hybrid value chain challenges firms reliant on passive steel rails and places software fluency at the centre of tender evaluations throughout the barrier systems market.
By Technology: Flexible Systems Lead Innovation Wave
Semi-rigid guardrails accounted for 45.10% income in 2025 because agencies view them as the sweet spot between impact absorption and deflection limits. Flexible rope and cable solutions are rising at 14.00% CAGR, buoyed by crash data showing up to 33% lower occupant acceleration compared with concrete walls. Rigid concrete parapets remain indispensable where median footprints are minimal or where maintenance access is hazardous.
Advances in elastomer cartridges and high-modulus fibers allow flexible systems to self-restore after minor strikes, preserving containment without urgent crew dispatch. Field telematics now log force vectors on impact, giving engineers evidence to calibrate maintenance schedules. Patent filings for composite-shell anchors and continuous energy-dissipation cores illustrate the knowledge race underway in the barrier systems market. Suppliers that combine material science with data science are well placed to set new safety benchmarks.
Geography Analysis
North America controlled 32.40% revenue in 2025 thanks to rigorous crash-test mandates and a mature interstate network that is cycling into renewal funding. Ongoing spending from federal infrastructure acts underwrites predictable demand, while Canada and Mexico add incremental volumes through provincial toll-road expansions and industrial corridor upgrades. Asset managers increasingly favor smart barriers with embedded diagnostics to offset labor shortages, sustaining technology adoption momentum within the region’s portion of the barrier systems market.
Europe prioritizes carbon reduction, visual harmony and noise mitigation, prompting agencies to specify recycled composites and vegetated impact walls that blend with built heritage. Although standards vary by country, EU research programs finance cross-border pilots that validate new materials, accelerating pan-European approval cycles. Suppliers with multilingual certification teams and modular design portfolios navigate this complexity most effectively. The barrier systems market size for European flexible solutions is also growing as urban planners champion rope systems that spare cyclists from rigid collision surfaces.
Asia-Pacific is outpacing every other region at 9.10% CAGR. China’s Belt and Road corridors, India’s frontier highways and Indonesia’s USD 80 billion seawall all require extensive barrier deployments that address both security and climate resilience. High population density compels engineers to integrate flood, seismic and hostile-vehicle requirements into single modular assemblies. Domestic manufacturers scale quickly, yet high-spec smart features still favour imports or joint ventures with European and North American technology firms. This interplay of local capacity and imported innovation is reshaping supplier footprints across the barrier systems market.

Competitive Landscape
The barrier systems industry remains moderately fragmented because no single technology dominates every use case. The largest five vendors together account for an estimated 35-40% revenue, leaving room for regional specialists and start-ups that focus on composites, sensor integration or architectural design. Steel-centric conglomerates are hedging raw-material risks by acquiring polymer formulators and licensing sensor patents, while niche players chase high-margin urban security projects with bespoke aesthetics.
Vertical integration is re-emerging as a hedge against price volatility. Companies owning steel mills, galvanizing lines and modular-fabrication shops can smooth input costs and delivery times when global supply chains tighten. At the same time, software-driven entrants capture value by offering predictive-maintenance dashboards and pay-per-opening models that transform barriers into service platforms. Intellectual-property filings reveal heightened activity around energy-absorbing couplers, retractable mechanisms and AI-assisted threat recognition, signaling technology as the primary battleground for differentiation in the barrier systems market.
Collaboration is increasingly cross-sector. Automotive safety firms license crash-sensor algorithms to barrier OEMs, while telecom tower fabricators adapt roll-forming lines to produce light-gauge guardrails. Public–private pilot corridors, such as Japan’s connected-vehicle test beds, invite joint bids from civil contractors and cloud providers. The competitive narrative is therefore shifting from lowest-price bidding toward ecosystems of partners that can deliver hardware, software and lifecycle analytics in one package, reinforcing service-oriented business models across the barrier systems market.
Barrier Systems Industry Leaders
Tata Steel
Trinity Industries, Inc.
Lindsay Corporation
Betafence Limited
Hill & Smith PLC
- *Disclaimer: Major Players sorted in no particular order

Recent Industry Developments
- June 2025: Indonesia launched a USD 80 billion seawall project to protect coastal zones, opening large tenders for climate-resilient barriers.
- May 2025: Nucor Corp. posted USD 156 million Q1 earnings on USD 7.83 billion sales, signaling robust steel availability for infrastructure suppliers.
- April 2025: Valmont Industries booked USD 969.3 million Q1 sales, with infrastructure units offsetting agriculture weakness.
- February 2025: Valmont merged its irrigation platforms into AgSense 365, hinting at future remote-monitoring extensions to barrier portfolios.


Research Methodology Framework and Report Scope
Market Definitions and Key Coverage
Our study defines the barrier systems market as all permanent or semi-permanent physical structures, such as crash barriers, bollards, safety fences, and automated gates, installed to control or stop the movement of vehicles, people, or debris across roadways, rail corridors, industrial sites, and perimeter zones.
Scope exclusion: temporary crowd-control barricades used for short-duration events are excluded.
Segmentation Overview
- By Material
- Metal
- Concrete
- Plastic/Composite
- Wood
- By Type
- Fences
- Crash Barrier Systems
- Crash Barrier Devices
- Bollards
- By End User
- Roadways
- Railways and Defense
- Commercial
- Residential
- Transportation Hubs
- Government
- By Function
- Passive (Fixed)
- Active (Automated)
- Perimeter Security
- By Technology
- Rigid
- Semi-Rigid
- Flexible
- By Geography
- North America
- United States
- Canada
- Mexico
- South America
- Brazil
- Argentina
- Rest of South America
- Europe
- United Kingdom
- Germany
- France
- Italy
- Spain
- Nordics
- Rest of Europe
- Middle East and Africa
- Middle East
- Saudi Arabia
- United Arab Emirates
- Turkey
- Rest of Middle East
- Africa
- South Africa
- Egypt
- Nigeria
- Rest of Africa
- Middle East
- Asia-Pacific
- China
- India
- Japan
- South Korea
- ASEAN
- Australia
- New Zealand
- Rest of Asia-Pacific
- North America
Detailed Research Methodology and Data Validation
Primary Research
Mordor analysts interviewed barrier manufacturers, roadway concessionaires, and traffic-engineering consultants across North America, Europe, and Asia Pacific. These conversations tested pricing spreads, replacement cycles, and automation adoption rates, filling data gaps that public sources leave open.
Desk Research
We began with transport-safety datasets from agencies such as the US Federal Highway Administration, Eurostat road infrastructure files, and the International Road Federation. Trade volumes for steel guardrails were tracked through UN Comtrade, while regional accident statistics were reviewed from WHO Global Road Safety reports. Company financials mined from D&B Hoovers and patent clusters accessed through Questel helped us trace revenue potential and design shifts. Additional insights were gathered from national construction ministries, leading trade associations, and reputable press releases that detail project pipelines and regulatory updates. This list is illustrative; many other public and subscription sources aided validation.
Market-Sizing & Forecasting
A top-down and bottom-up hybrid model was applied. Global paved-road length, rail-track expansion, and industrial floor-area additions created the demand pool, which was then verified through sampled supplier shipments and average selling prices. Key variables like crash frequency per 100 km, mandated safety-barrier density, average refurbishment interval, raw-material cost curves, and urbanization growth feed a multivariate regression that projects revenue through 2030. Where supplier roll-ups under-reported volumes, interpolation using regional construction-spend ratios bridged gaps.
Data Validation & Update Cycle
Outputs pass a two-step peer review and variance check against independent safety-equipment import data before sign-off. Reports refresh each year, with interim updates triggered by material regulatory or price shocks. An analyst completes a last-minute sweep prior to client release.
Why Mordor's Barrier Systems Baseline Stands Firm
Published estimates differ widely; scope choices, base years, and pricing ladders vary, so figures understandably diverge. Recent open reports show 2023 values of USD 20.6 billion and USD 21.1 billion, while another source pegs 2024 at USD 23.0 billion.
Key gap drivers are often narrower material scopes, omission of developing-country retrofit demand, or projections built on static unit prices without currency re-baselining. Our annual refresh and price-indexed model minimize those skews.
Benchmark comparison
| Market Size | Anonymized source | Primary gap driver |
|---|---|---|
| USD 24.08 B (2025) | Mordor Intelligence | - |
| USD 20.59 B (2023) | Global Consultancy A | Uses 2022 ASPs, excludes automated bollards |
| USD 21.10 B (2023) | Market Intelligence Firm B | Roadway focus only, no industrial barriers |
| USD 22.99 B (2024) | Research Group C | Applies uniform 10% retrofit rate worldwide |
The comparison shows that when scope breadth, inflation-linked pricing, and refresh cadence differ, totals shift appreciably. Mordor Intelligence anchors its baseline on clearly stated inclusions, transparent variables, and an update rhythm clients can trust for planning.


Key Questions Answered in the Report
What is the current size of the barrier systems market?
The barrier systems market size is USD 25.01 billion in 2026 and is set to reach USD 30.23 billion by 2031 at a 3.87% CAGR.
Which material segment dominates global revenue?
Metal guardrails lead with 42.15% market share, though composites are the fastest-growing material class at 12.10% CAGR.
Why are active barriers gaining popularity?
Active hydraulic bollards and crash gates allow operators to change traffic flows instantly and integrate with access-control software, supporting a 13.00% CAGR for the segment.
Which region shows the highest growth potential?
Asia-Pacific is expanding at 9.10% CAGR, fueled by large-scale transport and border-security projects across China, India and Southeast Asia.
How are IoT technologies influencing barrier procurement?
Asset owners increasingly specify sensor-ready barriers that transmit structural health and impact data, turning hardware projects into long-term service contracts with predictive maintenance benefits.
What risks can slow market expansion?
High installation costs and volatile raw-material prices can delay projects, especially in emerging markets where funding cycles are shorter and budgets are tighter.
Page last updated on:


