Barium Carbonate Market Size and Share
Market Overview
| Study Period | 2019 - 2030 |
|---|---|
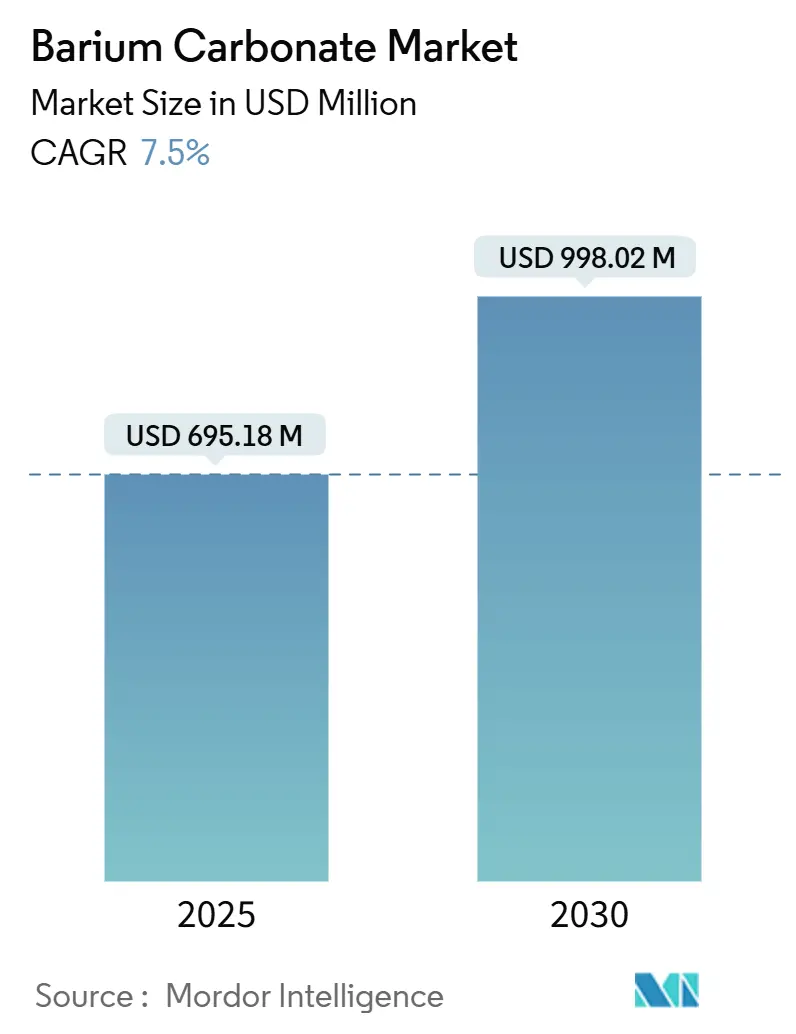
| Market Size (2025) | USD 695.18 Million |
| Market Size (2030) | USD 998.02 Million |
| Growth Rate (2025 - 2030) | 7.50% CAGR |
| Fastest Growing Market | Asia Pacific |
| Largest Market | Asia Pacific |
| Market Concentration | Medium |
Major Players *Disclaimer: Major Players sorted in no particular order Image © Mordor Intelligence. Reuse requires attribution under CC BY 4.0. | |
Barium Carbonate Market Analysis by Mordor Intelligence
The global barium carbonate market size stands at USD 695.18 million in 2025 and is forecast to reach USD 998.02 million by 2030, advancing at a 7.50% CAGR. Construction revival, semiconductor miniaturization, and stricter performance specifications for specialty glass anchor current demand for the barium carbonate market, while ultrafine processing technologies unlock higher-value electronic applications. Asia-Pacific dominates consumption and production, supported by its ceramic tile output and an expanding chip-manufacturing footprint, whereas North America and Europe lead on environmental compliance and premium grades. Producers are prioritizing vertical integration to safeguard barite supply and are investing in lead-free alternatives that align with tightening regulations. Price volatility in barite, coupled with continuous R&D in barium titanate capacitors, is reshaping strategic priorities across geographies as end users look for reliable partners able to balance cost, purity, and sustainability.
Key Report Takeaways
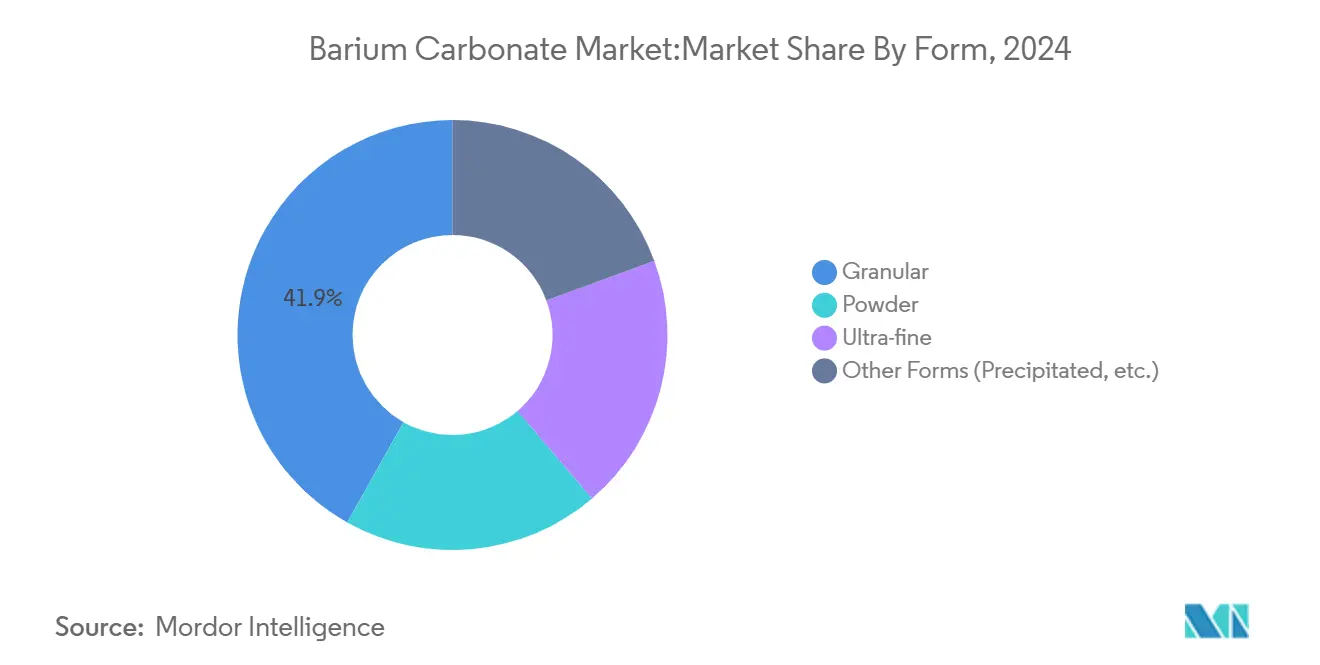
- By form, granular barium carbonate led with 41.86% revenue share in 2024, while the ultra-fine segment is forecast to accelerate at an 8.06% CAGR through 2030.
- By application, bricks and tiles accounted for 36.87% of the barium carbonate market share in 2024; electro-ceramics is projected to expand at an 8.19% CAGR to 2030.
- By end-user industry, the construction sector held 39.80% revenue share in 2024, whereas electronics is set to advance at an 8.48% CAGR over the same period.
- By geography, Asia-Pacific captured 44.55% of 2024 demand and is expected to post the fastest regional growth at a 9.02% CAGR through 2030.
Global Barium Carbonate Market Trends and Insights
Driver Impact Analysis*
| Driver | (~) % Impact on CAGR | Geographic Relevance | Impact Timeline |
|---|---|---|---|
| Expansion of construction and infrastructure industry | +2.1% | Global, with concentration in Asia-Pacific and emerging markets | Medium term (2-4 years) |
| Increase in output of specialty glass | +1.8% | North America & Europe, expanding to Asia-Pacific | Long term (≥ 4 years) |
| Increasing demand from ceramic industry | +1.6% | Asia-Pacific core, spill-over to MEA | Short term (≤ 2 years) |
| Advancements in electronics and semiconductor manufacturing | +1.4% | Asia-Pacific, North America, select European hubs | Medium term (2-4 years) |
| Increasing applications in agriculture sector | +0.6% | Global, with early adoption in developed markets | Long term (≥ 4 years) |
| Source: Mordor Intelligence | |||
Expansion of Construction and Infrastructure Industry
Infrastructure upgrades in India, Southeast Asia, and Latin America are amplifying ceramic tile, brick, and roof-tile consumption that relies on barium carbonate as a flux agent. India’s construction chemicals market alone is on track to add INR 500 crore turnover by 2028, reflecting the nation’s push for organized concrete production and green-building materials. Urbanization rates above 3% per year in Jakarta, Manila, and São Paulo sustain steady demand for moisture-resistant bricks that leverage barium carbonate for improved durability. Although China’s real-estate retrenchment tempered overall output in 2024, large government-funded housing projects in Tier-2 cities maintain baseline demand. Multilateral banks’ financing for roads and affordable housing increases the addressable market for high-performance ceramics across South Asia and Africa. Producers supplying granular grades benefit from established kiln infrastructure, while ultra-fine suppliers tap niche contracts for precision façade elements.
Increase in Output of Specialty Glass
Automotive head-up displays, augmented-reality optics, and solar modules require glass compositions that balance high refractive index with minimal optical dispersion, functions met efficiently by barium carbonate additions. European and North-American factories upgrading to ultra-thin, flexible glass substrates have documented thickness reductions of up to 30% while maintaining mechanical integrity by incorporating carefully metered barium levels[1]Venator Materials Corporation, “Advanced Optical Glass with Enhanced Barium Content,” venatorcorp.com . Growing electric-vehicle adoption boosts demand for lightweight, heat-resistant windshield and sunroof panels, leading automakers to negotiate long-term supply contracts for high-purity barium carbonate. Expansion of photovoltaic arrays under EU renewable mandates raises consumption of barium-enhanced cover glass that improves light transmission and module durability. The shift to high-clarity infotainment screens in next-generation vehicles widens opportunities for fine and ultra-fine powders formulated to tight impurity specifications.
Increasing Demand from Ceramic Industry
Digital printing, kiln electrification, and large-format tile production are revamping ceramics manufacturing, elevating the role of barium carbonate in flux systems that cut sintering temperatures by up to 15% and enhance green-body strength. The United States ceramic sector rebounded by 13.9% in 2022, benefiting domestic suppliers that can assure quick deliveries and consistent quality in the wake of trade disruptions. Asian producers focus on patio and façade tiles engineered for thermal shock resistance, applications that favor granular or powder grades with controlled particle morphology. Electro-ceramic components, especially multilayer ceramic capacitors, demand ultra-fine barium carbonate whose strict particle-size distribution underpins tight dielectric tolerances. European and Japanese tile makers are piloting hydrogen-ready kilns, creating additional incentives to adopt fluxes that lower firing temperatures and overall energy intensity.
Advancements in Electronics and Semiconductor Manufacturing
As chip geometries shrink and switching frequencies climb, multilayer ceramic capacitors built on barium titanate cores must deliver higher permittivity and lower dielectric loss. AIP Materials research confirmed that wet-etch fabrication preserves BaTiO3 capacitor integrity better than ion milling, prompting device makers to specify ultra-high-purity barium carbonate with trace contaminants below 50 ppm. The AI server boom has quadrupled high-capacitance MLCC demand since 2023, shifting procurement to suppliers who can guarantee chemical consistency lot-to-lot. TSMC’s Kumamoto fab start-up in late 2024 created a new lift in Japanese demand, while Korean and Taiwanese packaging houses accelerate purchases of electrode-grade powders. North-American universities collaborating on ferroelectric memory prototypes further broaden the adoption base for specialty barium carbonate formulations.
Restraint Impact Analysis*
| Restraint | (~) % Impact on CAGR Forecast | Geographic Relevance | Impact Timeline |
|---|---|---|---|
| Toxicity & stricter environmental norms | -1.2% | Global, with stricter enforcement in North America & Europe | Short term (≤ 2 years) |
| Volatile baryte ore pricing | -0.8% | Global supply chain impact, particularly affecting Asia-Pacific producers | Medium term (2-4 years) |
| Shift toward lead-free alternative fluxes | -0.7% | North America & Europe leading, expanding to Asia-Pacific | Long term (≥ 4 years) |
| Source: Mordor Intelligence | |||
Toxicity & Stricter Environmental Norms
Regulators worldwide have lowered permissible workplace exposure limits for soluble barium compounds, increasing compliance costs for manufacturers. The Agency for Toxic Substances and Disease Registry’s toxicological profile links ingestion of soluble barium salts with gastrointestinal and cardiac effects, encouraging factories to upgrade containment and wastewater treatment facilities. California’s Air Resources Board records 22,000 lb of barium compound emissions annually, a data point that triggered mandatory installation of advanced particulate capture system. In Europe, REACH authorizations require detailed safe-use dossiers, steering mid-sized producers toward third-party audits and ISO 14001 certification. Brands supplying consumer electronics are switching to lead-free glaze formulations, increasing R&D pressure on suppliers to deliver alternative flux blends without compromising performance. Collectively, these measures tighten market entry barriers and reward early adopters of clean production technologies.
Volatile Baryte Ore Pricing
Baryte accounts for 60-70% of variable costs in typical barium carbonate production flowsheets, meaning price swings directly erode margins. Chinese provincial crackdowns on environmentally non-compliant baryte mines cut output from 1.2 million t to roughly 325,000 t over three years, quadrupling raw-ore prices in the process[2]Valerie Jones, “China’s Baryte Supply Tightens, Prices Climb,” rigzone.com . Indian state-controlled supply auctions add further unpredictability, while logistics bottlenecks in Nigeria and Morocco disrupt seaborne trade. To hedge volatility, large integrated players secure captive deposits or finance synthetic-barite pilot plants that convert industrial sulfate wastes into high-density feedstock. Smaller Asian producers without similar hedges face working-capital strain and are ceding share in value-added grades to better-capitalized multinationals.
*Our forecasts treat driver/restraint impacts as directional, not additive. The impact forecasts reflect baseline growth, mix effects, and variable interactions.
Segment Analysis
By Form: Granular Dominance Meets Ultra-Fine Innovation
Granular material commanded 41.86% of the barium carbonate market in 2024, favored for kiln-friendly flow properties and moderate purity targets across ceramics and glass. Unit costs remain predictable because granulation can be performed near barite sources, cutting freight expenses. Powder grades bridge cost and performance, supplying enamel, coating, and chemical intermediates with particle-size options from 10–75 µm. The ultra-fine segment, though smaller, is projected to post an 8.06% CAGR; semiconductor fabs and multilayer capacitor makers require sub-500 nm particles that deliver high sintering activity and uniform crystal phases. Microwave precipitation routes demonstrated in peer-reviewed studies yield orthorhombic BaCO3 with narrow size distributions, catalyzing broader adoption among electronics clients[3]P. Gupta, “Microwave Homogeneous Precipitation of BaCO3,” High Temperature Materials and Processes, degruyter.com .
The shift toward miniaturization means equipment vendors now guarantee sub-micron classification and metal-impurity levels below 10 ppm, benchmarks unattainable with legacy milling. As a result, several Asian chemical groups have upgraded to closed-loop precipitation reactors with in-line particle-size analytics. Powder and granular suppliers continue to enjoy stable demand from brick kilns and glass float lines, but pricing pressure intensifies as clients demand higher bulk densities and lower soluble barium content to meet plant-level emission limits. The barium carbonate market size for ultra-fine grades is forecast to grow USD 54 million by 2030, reflecting a migration from commodity to engineered formulations.


By Application: Traditional Bricks Meet Advanced Electronics
Bricks and tiles held 36.87% of global revenue in 2024, as masonry units leveraging barium carbonate exhibit reduced efflorescence and improved frost resistance. Urban infrastructure roll-outs in Indonesia and Vietnam continue to funnel orders to low-cost granular producers. Specialty glass remained the second-largest application, supplying flat-panel, solar, and automotive glass producers; optical-grade powder demand rises in tandem with electric-vehicle display volumes. Electro-ceramics represent the fastest-growing field, estimated to log an 8.19% CAGR, fueled by 5G base-station filters and high-density MLCC stacks.
Glaze and enamel markets maintain steady tonnage owing to architectural façade popularity, while chemical intermediates, agricultural micronutrients, and analytical reagents track modest single-digit growth. As performance expectations climb, clients seek guaranteed residual sulfate levels below 0.1% and heavy-metal contaminants below 5 ppm. The barium carbonate market share for electro-ceramics remains modest today but will steadily expand, reshaping producer portfolios toward high-margin, high-purity offerings.
By End-User Industry: Construction Leads, Electronics Accelerates
The construction sector contributed 39.80% to 2024 consumption, supported by stimulus-backed infrastructure projects across South Asia and Latin America. Cement substitution experiments using barium carbonate–modified fly-ash bricks further enlarge the addressable group of downstream users. In contrast, electronics applications, from capacitors to nonlinear varistors, are set to outpace all other industries at an 8.48% CAGR, underlining the material’s strategic importance in advanced circuits.
Oil and gas continues to consume moderate volumes via drilling mud additives, but energy-transition policies and lower exploration budgets temper growth. Producers eye emerging agricultural demand for Ba-based soil pH modifiers; however, regulatory clearance in many jurisdictions is pending toxicity dossiers. Overall, the barium carbonate market benefits from diversification: cyclical construction projects stabilize baseline volumes, while electronics applications deliver higher unit margins and resilience against raw-material price spikes.

Geography Analysis
By Geography: Asia-Pacific’s Dual Leadership
Asia-Pacific captured 44.55% of 2024 global demand for the barium carbonate market, a position it reinforces through vertically integrated tile, glass, and semiconductor supply chains. China remains the principal consumer despite real-estate headwinds, as its electronics and solar industries continue contracting specialized grades. India’s Smart Cities program and 100 GW solar target drive brisk uptake in construction chemicals and PV cover-glass formulations. Japan’s government subsidy that supports domestic chip capacity, together with robust auto-glass exports, extends regional demand.
North America accounts for a sizeable share because aerospace and defense clients require consistent dielectric performance and tight impurity controls. The 2024 CHIPS Act capital outlay deepens domestic value-addition, opening niches for regional barium carbonate suppliers capable of ultrafine purity. Canada’s Saskatchewan barite resource development also offers long-term feedstock options that could ease volatility concerns.
Europe champions environmental stewardship, pushing suppliers to adopt energy-efficient kilns and closed-loop effluent treatment. High-end float-glass, automotive optics, and ceramic capacitor producers demand grades exceeding 99.95% purity, enabling premium pricing and long-term contracts. EU funding for green hydrogen–ready furnaces encourages adoption of low-melting-point fluxes, a property readily met by barium carbonate powders.
South America’s infrastructure stimulus in Brazil and Chile propels construction-grade demand, while lithium-battery initiatives in Argentina create embryonic prospects for high-purity ceramics. The Middle East & Africa region sees incremental volumes tied to tourism-driven hotel construction and desalination plant upgrades. Logistics hurdles and limited local processing facilities currently cap regional growth, but joint ventures under the Belt and Road banner may introduce new grinding and precipitation capacity by 2028.


Competitive Landscape
The barium carbonate market is moderately consolidated. Solvay and Honeywell International leverage proprietary precipitation technology and captive barite channels to supply capacitor-grade powders to Japanese and U.S. OEMs. Hebei Xinji Chemical Group and Guizhou Redstar serve large tiles, brick, and glass producers at competitive price points, benefiting from proximity to reserves and integrated logistics.
Barium Carbonate Industry Leaders
SAKAI CHEMICAL INDUSTRY CO.,LTD.
SHAANXI ANKANG JIANGHUA GROUP CO., LTD.
Chemical Products Corporation
Solvay
Honeywell International Inc
- *Disclaimer: Major Players sorted in no particular order


Recent Industry Developments
- May 2025: Vishnu Chemicals, India’s largest barium carbonate producer, stated that its 20-year solar-power contract, sealed in 2023, is cutting power costs for barium carbonate production by 25–30%.
- October 2022: India’s Finance Ministry removed anti-dumping duties on Chinese barium carbonate imports, following recommendations by the Directorate General of Trade Remedies.


Research Methodology Framework and Report Scope
Market Definitions and Key Coverage
Our study defines the barium carbonate market as the sales value of new, merchant-grade BaCO3 supplied in powder, granular, or ultra-fine form for downstream use in bricks and tiles, specialty glass, glazes, electro-ceramics, enamels, and allied chemical syntheses. Conversion from mined barite or witherite through precipitation or carbothermic routes is included, and figures are reported in USD millions at manufacturer gate prices.
Scope exclusion: recycled barium residues, captive intra-company transfers, and derivative compounds such as barium titanate are out of scope.
Segmentation Overview
- By Form
- Granular
- Powder
- Ultra-fine
- Other Forms (Precipitated, etc.)
- By Application
- Bricks and Tiles
- Specialty Glass
- Glazes
- Electro-Ceramics
- Enamels
- Other Applications (Chemical Intermediates, etc.)
- By End-User Industry
- Construction
- Ceramics
- Electronics
- Oil and Gas
- Other End-User Industries (Specialty Chemicals, etc.)
- By Geography
- Asia-Pacific
- China
- India
- Japan
- South Korea
- Rest of Asia-Pacific
- North America
- United States
- Canada
- Mexico
- Europe
- Germany
- United Kingdom
- France
- Italy
- Rest of Europe
- South America
- Brazil
- Argentina
- Rest of South America
- Middle East and Africa
- Saudi Arabia
- South Africa
- Rest of Middle East and Africa
- Asia-Pacific
Detailed Research Methodology and Data Validation
Primary Research
Mordor analysts then contacted plant managers, ceramic formulators, regional traders, and environmental regulators across Asia-Pacific, Europe, and North America. Interviews and short surveys clarified typical purity grades, average selling prices, substitution trends, and near-term capacity additions, which we used to validate secondary findings and fine-tune elasticity assumptions.
Desk Research
Analysts first assembled supply-demand cues from open sources such as United States Geological Survey baryte output data, International Trade Centre HS 283660 trade flows, World Bank construction spending dashboards, and the European Ceramic Society production bulletins. Company filings, patent abstracts, and reputable business press complemented those datasets. Subscription repositories (for example, D&B Hoovers and Dow Jones Factiva) helped verify producer revenues and capacity footprints. The sources listed illustrate the breadth of material consulted; many additional references were reviewed for cross-checks and context.
The desk exercise yielded baseline production, end-use split patterns, and regional price corridors that underpin our model construction.
Market-Sizing & Forecasting
A top-down build starts with regional barite throughput and conversion yields, reconstructed into BaCO3 output and net trade, before being matched against demand pools derived from construction tile production, specialty glass tonnage, and multilayer ceramic capacitor output. Select bottom-up roll-ups of producer shipments and sampled ASP × volume act as guardrails. Key variables like construction spending, ceramic tile exports, specialty glass output, barite ore price indices, and MLCC shipment growth feed a multivariate regression that projects value to 2030. Where bottom-up gaps appear (e.g. small privately held suppliers), historic import coverage ratios are used to interpolate.
Data Validation & Update Cycle
Model outputs pass three layers of variance checks, peer review, and senior analyst sign-off. Results are revisited annually, with interim refreshes triggered by material events such as major plant closures or regulatory shifts; a quick update is run just before each publication release.
Why Our Barium Carbonate Baseline Is Trusted by Decision-Makers
Published estimates often diverge because firms adopt different product scopes, assume distinct price trajectories, or refresh data on varying cadences.
Key gap drivers here include whether downstream captive use is counted, the way average selling prices evolve with purity upgrades, and how swiftly electronics demand is factored in. Mordor's study fixes a transparent scope, applies region-specific price curves validated with live supplier quotes, and updates annually, thereby delivering a balanced midpoint for planners.
Benchmark comparison
| Market Size | Anonymized source | Primary gap driver |
|---|---|---|
| USD 695.18 mn (2025) | Mordor Intelligence | - |
| USD 792.12 mn (2025) | Global Consultancy A | Wider scope includes captive glass-maker transfers and assumes uniform 4 % annual ASP rise |
| USD 391.74 mn (2024) | Industry Publication B | Excludes electronics-grade powders and applies conservative regional coverage limited to five countries |
These comparisons show that when scope boundaries and price progression are aligned, Mordor's disciplined blend of field insight and transparent variables provides the most reproducible baseline for strategic use.


Key Questions Answered in the Report
What is the current Barium Carbonate Market size?
The barium carbonate market size is valued at USD 695.18 million in 2025.
Which region will grow fastest through 2030?
Asia-Pacific is projected to record the highest regional CAGR at 9.02%, reflecting its dual strength in construction materials and semiconductor fabrication.
Which application segment is expanding most rapidly?
Electro-ceramics, including MLCCs and varistors, is forecast to expand at an 8.19% CAGR driven by 5G, AI, and electric-vehicle electronics demand.
How do environmental regulations affect producers?
Stricter exposure limits and hazardous-waste rules drive investment in closed-loop production, emission capture, and lead-free formulations, increasing costs for companies unable to upgrade quickly.
Page last updated on:


