
Electronics And Electrical Ceramics Market Size and Share
Market Overview
| Study Period | 2020 - 2031 |
|---|---|
| Market Size (2026) | USD 14.5 Billion |
| Market Size (2031) | USD 18.49 Billion |
| Growth Rate (2026 - 2031) | 4.98 % |
| Fastest Growing Market | Asia Pacific |
| Largest Market | Asia Pacific |
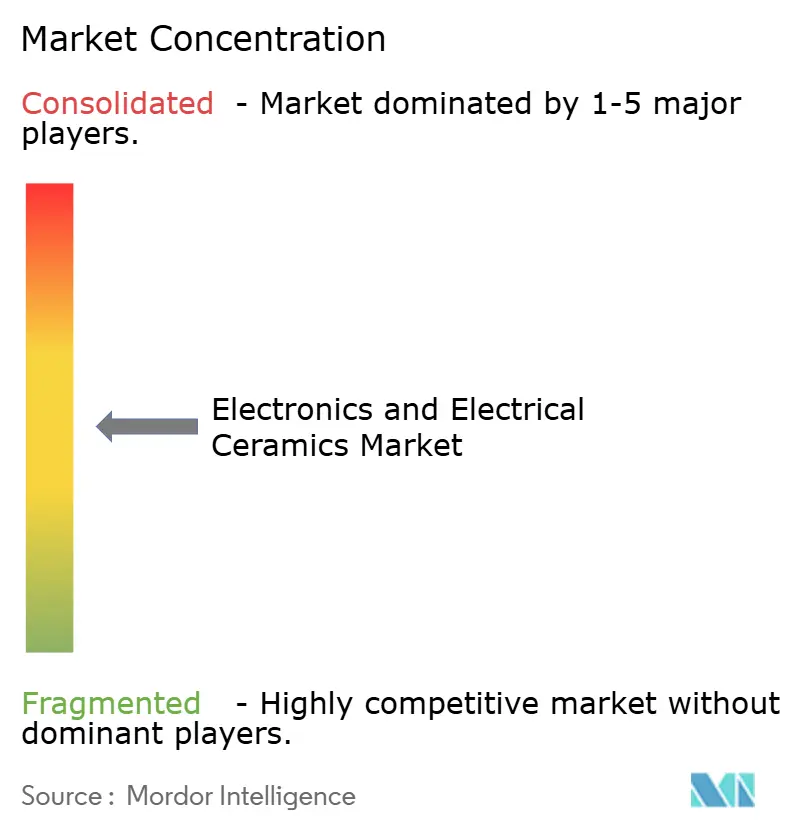
| Market Concentration | Medium |
Major Players *Disclaimer: Major Players sorted in no particular order Image © Mordor Intelligence. Reuse requires attribution under CC BY 4.0. | |
Electronics And Electrical Ceramics Market Analysis by Mordor Intelligence
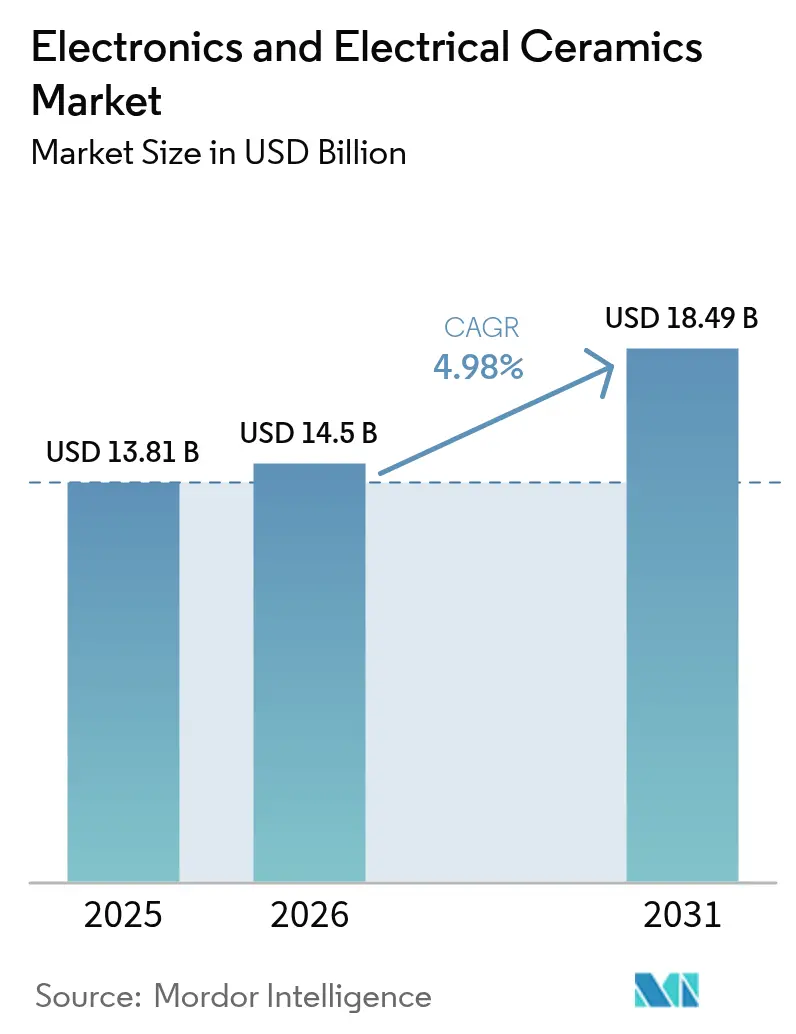
The Electronics And Electrical Ceramics Market size was valued at USD 13.81 billion in 2025 and estimated to grow from USD 14.5 billion in 2026 to reach USD 18.49 billion by 2031, at a CAGR of 4.98% during the forecast period (2026-2031). This trajectory signals how ceramic materials out-perform metals and polymers when next-generation devices require high dielectric strength, thermal conductivity and mechanical robustness. Growth is amplified by the simultaneous rollout of 5G networks, volume expansion in electric vehicles, and continuous miniaturization across consumer electronics that all depend on advanced ceramic substrates, capacitors and sensors. Continual product innovation, coupled with regional supply chain localization, is widening the addressable opportunity for the electronics and electrical ceramics market as designers seek reliable, energy-efficient parts. Sustained public-sector focus on particulate-matter emissions from ceramic powder processing is adding compliance investment, yet it is also prompting process upgrades that improve yield and cut waste in the electronics and electrical ceramics market.
Key Report Takeaways
- By material type, alumina ceramics accounted for 36.58% of the electronics and electrical ceramics market size in 2025, while titanate ceramics are poised to expand at a 6.12% CAGR to 2031.
- By product type, monolithic ceramics commanded 52.60% of the electronics and electrical ceramics market size in 2025, whereas ceramic matrix composites are forecast to grow at a 6.55% CAGR to 2031.
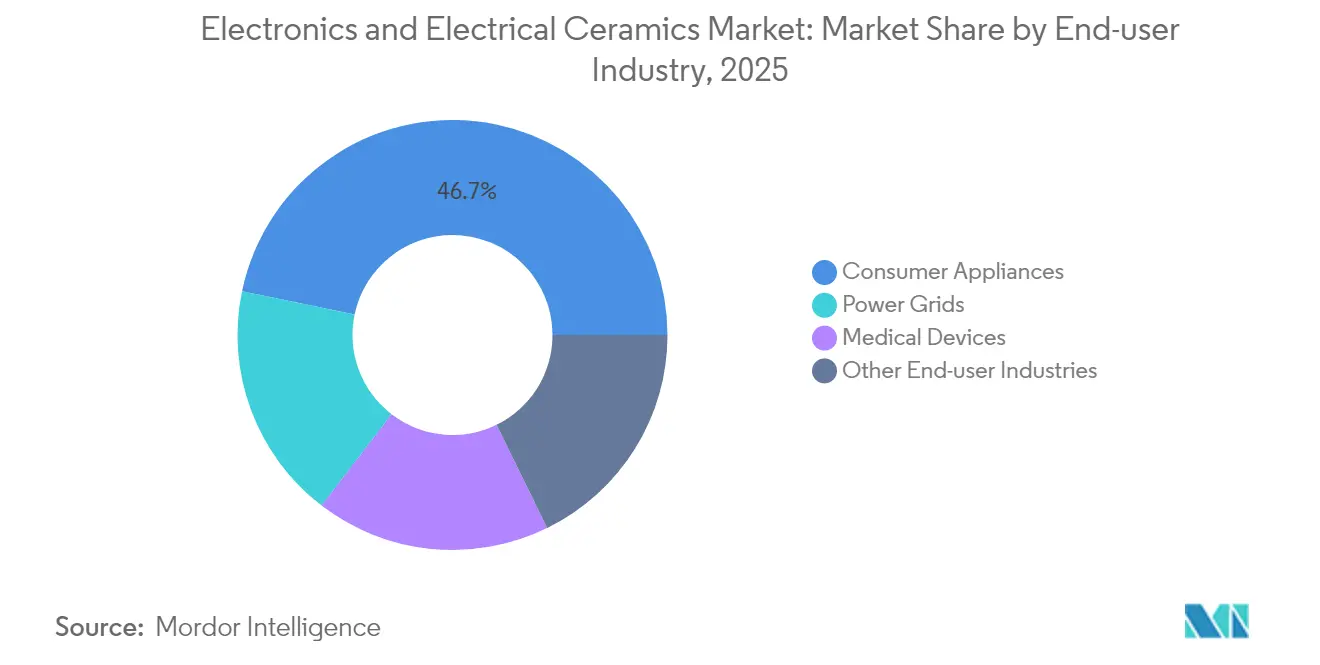
- By end-user industry, consumer appliances captured 46.73% of the electronics and electrical ceramics market share in 2025; medical devices record the highest projected CAGR of 6.42% to 2031.
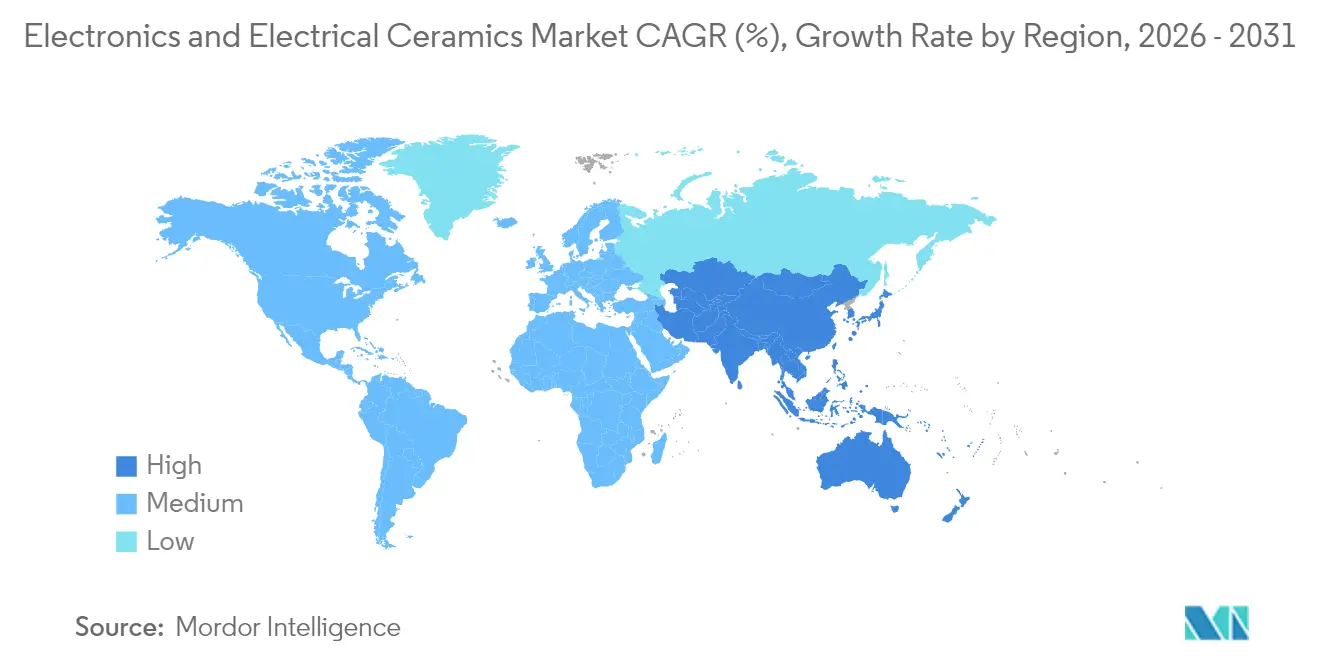
- By geography, Asia-Pacific led with 48.05% of the electronics and electrical ceramics market share in 2025; the same region is projected to advance at a 5.93% CAGR through 2031.
Note: Market size and forecast figures in this report are generated using Mordor Intelligence’s proprietary estimation framework, updated with the latest available data and insights as of 2026.
Market Trends and Insights
Drivers Impact Analysis of Electronics And Electrical Ceramics Market*
| Driver | (~) % Impact on CAGR Forecast | Geographic Relevance | Impact Timeline |
|---|---|---|---|
| Surge in Consumer Electronics Demand | +1.8% | Global, with APAC leading production and consumption | Medium term (2-4 years) |
| Expansion of 5G Infrastructure | +1.2% | North America and EU early deployment, APAC mass rollout | Short term (≤ 2 years) |
| EV Traction Inverters' Thermal-Ceramic Demand | +0.9% | Global, concentrated in China, EU, North America | Medium term (2-4 years) |
| Proliferation of LTCC Mmwave AiP Modules | +0.7% | APAC manufacturing, global deployment | Short term (≤ 2 years) |
| Wearable Solid-State Batteries using Ceramic Electrolytes | +0.4% | Global, with early adoption in developed markets | Long term (≥ 4 years) |
| Source: Mordor Intelligence | |||
Surge in Consumer Electronics Demand
Miniaturization in smartphones, earbuds and smart watches has intensified requirements for high-Q multilayer ceramic capacitors, piezo actuators and heat-spreading substrates. Murata’s launch of a 0.4 mm × 0.2 mm 100 V capacitor allows 5G RF modules to raise power density without losing signal integrity Electrocaloric solid-state coolers promise quieter, energy-saving alternatives to mini compressors in wearables, while TDK’s CeraCharge solid-state micro-battery highlights how ceramic electrolytes enhance safety and cycle life in compact formats. As volumes grow, economies of scale are narrowing the cost gap with legacy materials, broadening adoption across mid-tier consumer devices and cementing the electronics and electrical ceramics market as a foundational enabler of connected lifestyles.
Expansion of 5G Infrastructure
Millimeter-wave base stations need low-loss substrates that standard FR-4 or PTFE laminates cannot provide above 24 GHz. LTCC substrates offer permittivity stability, integrated passive embedding and dimensional precision. Applied Materials has commercialized LTCC deposition and sintering equipment tailored for 5G antenna-in-package lines, underscoring how manufacturing accuracy drives RF performance[1]Applied Materials, “LTCC equipment for 5G,” appliedmaterials.com . A typical 64T64R massive-MIMO radio consumes three to five times more ceramic capacitors than a 4G macro cell, multiplying demand for dielectric grades tuned for high-frequency loss tangents. National security concerns are pushing operators in the United States and Europe to dual-source ceramic passives locally, accelerating supply-chain regionalization within the electronics and electrical ceramics market.
EV Traction Inverters’ Thermal-Ceramic Demand
Silicon-carbide MOSFET inverters now approach junction temperatures of 175 °C. AlN or metallized Al₂O₃ substrates that exceed 20 W/mK thermal conductivity keep module footprints compact while meeting vehicle reliability requirements. Semiconductor Today reported SiC power modules packaged on ceramic bases with die-attach layers optimized for coefficient-of-expansion matching, enabling higher switching frequencies without derating. Automakers shifting to 48 V architectures also adopt ceramic capacitors for high-voltage isolation in DC-DC converters. Supply chains have started to secure alumina and AlN powder under long-term contracts, lowering volatility for this portion of the electronics and electrical ceramics market.
Proliferation of LTCC mmWave AiP Modules
Embedding resistors, capacitors and radiators within a multilayer ceramic stack shortens RF paths and cuts parasitic inductance. KOA Corporation achieved fine-line printing on LTCC that places temperature-stable resistors and filter structures inside a single substrate, producing package sizes compatible with automotive radar sensors. AiP designs for 79 GHz radar benefit from LTCC’s 0.002 dielectric loss, improving signal-to-noise ratios and enabling smaller bumper-mounted modules. Yield advantages from one-step co-firing are offsetting the premium material cost, helping the electronics and electrical ceramics market penetrate radar and satellite communication front ends.
Restraints Impact Analysis of Electronics And Electrical Ceramics Market*
| Restraint | (~) % Impact on CAGR Forecast | Geographic Relevance | Impact Timeline |
|---|---|---|---|
| Higher Unit Cost than Metals And Alloys | -0.6% | Global, particularly impacting price-sensitive applications | Medium term (2-4 years) |
| Critical-Mineral (Alumina) Price Spikes | -0.3% | Global supply chains, concentrated mining regions | Short term (≤ 2 years) |
| Tightening PM 2.5 Emission Norms for Ceramic Powders | -0.4% | Developed markets with strict environmental regulations | Long term (≥ 4 years) |
| Source: Mordor Intelligence | |||
Higher Unit Cost than Metals and Alloys
Ceramic substrates, housings and capacitors typically cost between two and five times more than stamped aluminum parts or polymer-based alternatives. The multi-stage sintering cycle, tight atmosphere control and post-firing metallization needed in ceramic processing drive energy use and capital intensity. While system-level benefits such as thermally induced reliability and weight reduction offset some of the extra expenditure, budget-constrained consumer device firms still default to cheaper metals where performance headroom allows. Greater production scale and line automation are incrementally lowering conversion cost, but price sensitivity remains a tangible drag on the electronics and electrical ceramics market in mass electronics.
Critical-Mineral (Alumina) Price Spikes
High-purity alumina output is geographically concentrated, leaving supply chains exposed when operational incidents or geopolitical restrictions arise. Abrupt price jumps ripple into multilayer ceramic capacitor and substrate lines, complicating annual price agreements with automotive and industrial customers. Imerys has reported alumina spot increases exceeding 30% within one quarter after mine disruptions, prompting OEMs to demand hedging clauses in new contracts. Larger ceramic groups respond by forward-buying feedstock, yet the working-capital burden weighs on smaller players. This volatility tempers profit visibility in the electronics and electrical ceramics market and encourages backward-integration strategies.
*Our forecasts treat driver/restraint impacts as directional, not additive. The impact forecasts reflect baseline growth, mix effects, and variable interactions.
Electronics And Electrical Ceramics Market Segment Analysis
By Material Type:
Alumina Leads Despite Titanate InnovationAlumina retained 36.58% of the electronics and electrical ceramics market share in 2025 owing to its balanced dielectric strength, 20-25 W/mK thermal conductivity and favorable price-to-performance ratio. The material anchors multilayer ceramic capacitors, semiconductor packages and lamp substrates that ship in billions of units each year. Titanate ceramics held a smaller slice but are expanding at a 6.12% CAGR through 2031 as sensor makers exploit their strong piezoelectric coefficients for energy harvesting in Internet-of-Things nodes. The electronics and electrical ceramics market size for titanate compositions therefore shows the fastest segment-level rise, especially where self-powered wearables and structural health monitoring sensors require repeated mechanical-to-electrical conversion.
Research pushing alumina performance is equally vibrant. Journal of Advanced Ceramics detailed a boron-nitride microribbon reinforced grade that boosts thermal conductivity by 45.6% compared with baseline alumina while keeping volume resistivity above 10¹³ Ω·cm. Zirconia covers surgical implants and high-temperature sensors thanks to fracture-toughness exceeding 10 MPa·m¹ᐟ², whereas silica glasses protect laser and etching equipment from plasma erosion. Ultra-high-temperature ceramics based on ZrB₂ and HfB₂ borides are moving from lab scale toward hypersonic vehicle nosecone electronics, broadening the long-term canvas for the electronics and electrical ceramics market.




By Product Type:
Monolithic Dominance Challenged by Composite InnovationMonolithic forms constituted 52.60% of the electronics and electrical ceramics market size in 2025 given their straightforward pressing-and-sintering routes and consistent isotropic properties for capacitors, heaters and substrates. Ceramic matrix composites, though contributing a smaller share, are on track for a 6.55% CAGR to 2031. Aerospace engines blend SiC fibers within an SiC matrix to raise turbine inlet temperatures above 1,300 °C while trimming mass by up to 30% against superalloys. AddComposites reports diffusion-bonded joints in such composites surpassing 439 MPa shear strength, fostering confidence among jet-engine OEMs. Ceramic coatings occupy an intermediate niche, applying micron-scale oxide or nitride layers onto metals to raise wear and heat resistance at comparatively low cost. Nanostructured foams and fibers are also acquiring footholds in filtration and battery separators, ensuring the electronics and electrical ceramics market maintains a diversified product menu.
By End-user Industry:
Medical Devices Drive Growth Despite Consumer DominanceConsumer appliances controlled 46.73% of the electronics and electrical ceramics market share in 2025, reflecting sustained demand for induction cooktops, inverter microwaves and smart thermostats where thermal-shock tolerance and dielectric insulation are vital. SCHOTT’s CERAN Luminoir glass-ceramic cooktop panel illustrates how functional ceramics add both aesthetics and efficiency in premium kitchen ranges. Medical devices, while only mid-single-digit in share, post the fastest 6.42% CAGR, pulled by implantable batteries, ceramic-tip endoscopes and dental restorations that need biocompatibility and corrosion immunity. MDPI Applied Sciences highlighted antibacterial zirconia carrying silver ions that cut microbial colonization, an advantageous trait for next-generation implants. Power grids, telecom base stations and aerospace electronics round out the duty roster, each aligning ceramic specification to voltage, frequency or temperature extremes, cementing the electronics and electrical ceramics market as an essential pillar across critical infrastructure
Geography Analysis
APAC Electronics and Electrical Ceramics Market
Asia-Pacific contributed 48.05% of global revenue in 2025 and is forecast to grow at 5.93% CAGR through 2031, combining extensive raw-material processing in mainland China, advanced component machining in Japan and high-volume capacitor assembly in South Korea. The region also hosts Guangzhou’s biennial Ceramics China trade fair that spotlights powder innovations and kiln electrification roadmaps. Localized supply chains reduce logistics lead-times for smartphone and EV makers based in Shenzhen, Osaka and Seoul, thereby reinforcing the electronics and electrical ceramics market leadership in Asia.
North America Electronics and Electrical Ceramics Market
North America trails in share yet enjoys strategic tailwinds from accelerated 5G mid-band deployments and federal incentives for domestic EV battery manufacturing. Saint-Gobain’s 2025 decision to construct a NorPro plant in Wheatfield, New York, shows how capacity additions are re-balancing ceramic supply closer to United States automotive and aerospace hubs. The electronics and electrical ceramics market size in North America is therefore primed for low-single-digit share gains, fueled by procurement shifts tied to critical-material security.
EMEA and South America Electronics and Electrical Ceramics Market
Europe carries a longstanding ceramic heritage in Germany, Italy and France. Automotive regulation mandating hybrid powertrains and particulate-filter upgrades sustains substrate and sensor demand, while Horizon-Europe grants push research into recyclable ceramic composites. Emerging economies in South America and Middle-East Africa currently represent single-digit shares but exhibit rising imports of telecom backhaul gear and high-voltage insulators. Local assembly incentives in Brazil and the United Arab Emirates may gradually cultivate regional ceramic production, extending the electronics and electrical ceramics market footprint beyond traditional centers.

Value Chain Analysis
The value chain starts with high-purity ceramic powder inputs (alumina, zirconia, titanate, and aluminum nitride), along with specialty additives and binders that support tape casting and slurry preparation. Material qualification and supply continuity are important because downstream products such as MLCC dielectrics, LTCC substrates, thermal management ceramics, and semiconductor equipment parts rely on tight particle-size control, impurity limits, and predictable sintering behavior. In 2026, upstream portfolio moves such as Sumitomo Chemical launching its ELA series of low-alpha, high-purity fine spherical alumina for semiconductor-related fields reinforce how tailored powders are used to secure performance and yield at the component level.
Midstream processing converts powders into engineered forms through steps such as granulation, forming (pressing, cold isostatic pressing, tape casting), high-temperature sintering, machining, and metallization. After that, parts move into module and end-equipment assembly across consumer electronics, telecom infrastructure, EV power electronics, and medical devices. Bottlenecks increasingly show up in advanced manufacturing steps rather than basic powder availability, particularly for high-end MLCCs where yield constraints have been reported, and for high-purity AlN where structural supply tightness reflects demand from EV, 5G, and AI data centers. Precious-group-metal metallization (palladium and silver) also remains a strategic dependency for high-reliability applications where base-metal electrode approaches are not always substitutable, linking PGM supply conditions to component lead times and downstream pricing.
Competitive Landscape
The electronics and electrical ceramics market is moderately fragmented, with the ten largest suppliers accounting for just over 60% of value. Kyocera, Murata and TDK secure more than one-third combined share through vertically integrated powder synthesis, tape-casting, multilayer lamination and finished component assembly. Patents covering dielectric chemistries and LTCC process windows create high entry barriers, steering new players toward niche formulations rather than head-to-head volume competition. Capital outlay per production line often exceeds USD 40 million, underpinning the tendency for scale economies.
Technology partnerships remain the route to address white-space applications. Murata collaborates with QuantumScape on flexible ceramic separators for solid-state EV batteries, while SINTX works with defense contractors on silicon-nitride drone bearings. Additive manufacturing is gaining mindshare; binder-jet and stereolithography printers now produce fine-feature ceramic parts within days, cutting prototype cycles. Environmental stewardship differentiates leading suppliers. Murata pledged 100% renewable electricity by 2035, fifteen years ahead of its prior plan, and deployed a thermal storage system that cuts factory CO₂ by 249 tons annually[2]Murata Manufacturing Co., Ltd., “RE100 roadmap,” murata.com . As OEMs integrate sustainability KPIs into sourcing, green credentials will weigh as much as technical specifications in vendor selection across the electronics and electrical ceramics market.
Electronics And Electrical Ceramics Industry Leaders
Murata Manufacturing Co., Ltd.
Kyocera Corporation
TDK Corporation
CeramTec GmbH
CoorsTek Inc.
- *Disclaimer: Major Players sorted in no particular order
Electronics And Electrical Ceramics Market Companies Covered in this Report
- 3M
- AdValue Technology
- CeramTec GmbH
- CoorsTek Inc.
- Heraeus Group
- IBIDEN
- KCM Corporation
- Kyocera Corporation
- MARUWA Co., Ltd.
- Murata Manufacturing Co., Ltd.
- NGK INSULATORS, LTD.
- NIPPON CARBIDE INDUSTRIES CO., INC.
- NORITAKE CO., LIMITED
- PI Ceramic GmbH
- Saint-Gobain Ceramics
- Sumitomo Chemical Co., Ltd.
- TDK Corporation
Read Analysis of Electronics And Electrical Ceramics Companies

Market Opportunities and Future Outlook
AI-driven server hardware and advanced semiconductor packaging are creating a whitespace for higher-layer-count MLCCs, low-loss LTCC, and ceramic-core or ceramic-enhanced substrates that address warpage and thermal constraints. Company actions in 2026 support this shift: Kyocera announced commercialization of a multilayer ceramic core substrate for advanced AI semiconductor packages (April 2026), while Samsung Electro-Mechanics disclosed major AI-server-oriented MLCC and substrate investments and supply agreements during 2026. Together, these moves pull demand toward tighter-spec dielectric powders, finer internal layer processing, and more rigorous reliability qualification, benefiting suppliers that can combine powder control, precision lamination, and high-throughput firing with stable yields.
A second opportunity sits at the intersection of semiconductor equipment and functional ceramics, where capacity additions for components such as susceptors and other process-contact ceramics support expanding fabrication and packaging throughput. NGK Insulators announced an investment (70 billion yen) to build the NGK Ceramic Device Ishikawa Plant for semiconductor functional ceramics, reflecting how equipment-side ceramics can scale alongside fabs and OSATs as contamination control becomes more critical. In parallel, lead-free dielectric formulations are moving from research to a commercial requirement: the EU RoHS exemption timeline for lead zirconate titanate (PZT) in low-voltage MLCCs, alongside 2026 research reporting high energy density and efficiency in lead-free ceramic capacitors, is accelerating qualification work for compliant, high-performance alternatives across consumer, industrial, and automotive electronics.
Recent Industry Developments in Electronics And Electrical Ceramics Market
- July 2026: Kyocera announced a seven-year components investment plan through March 2031 and set the opening of its new Nagasaki Isahaya Plant for September 1, 2026, targeting fine ceramic components and semiconductor packages. The program includes dedicated funding to strengthen MLCC capacity for AI server applications, reinforcing the companys push into higher-value electronic ceramics and packaging.
- February 2025: Saint-Gobain Ceramics began construction of a new NorPro manufacturing facility in Wheatfield, New York, backed by an investment of about USD 40 million. The project expands North American production for specialized ceramic components used in electronics and industrial applications, supporting regional supply-chain localization.
- May 2024: PI Ceramic developed piezoceramic composites that combine piezoelectric ceramics with filling polymers using a new manufacturing process. This broadens design flexibility for sensors and actuators by enabling performance tuning beyond conventional monolithic piezoceramics, supporting customization in electronics and industrial end uses.


Electronics And Electrical Ceramics Market Report Scope and Research Methodology
Market Definition and Coverage
This market covers revenue generated from ceramics designed for electrical insulation, dielectric performance, thermal management, and related electronic functions used inside electrical and electronic equipment. Values are captured at the point where these ceramics are sold into electronics and electrical applications, across major producing and consuming regions.
Scope exclusions: We exclude general construction ceramics and non-electrical structural ceramics where performance is not tied to electrical or electronic use.
Segments Covered in This Report
- By Material Type
- Alumina Ceramics
- Titanate Ceramics
- Zirconia Ceramics
- Silica Ceramics
- Other Types
- By Product Type
- Monolithic Ceramics
- Ceramic Matrix Composites
- Ceramic Coatings
- Other Product Types
- By End-user Industry
- Consumer Appliances
- Power Grids
- Medical Devices
- Other End-user Industries
- Geography
- Asia-Pacific
- China
- Japan
- India
- South Korea
- Rest of Asia-Pacific
- North America
- United States
- Canada
- Mexico
- Europe
- Germany
- United Kingdom
- France
- Italy
- Russia
- Rest of Europe
- South America
- Brazil
- Argentina
- Rest of South America
- Middle-East and Africa
- Saudi Arabia
- South Africa
- Rest of Middle-East and Africa
- Asia-Pacific
Data Sources, Market Sizing, and Validation
Desk Research
Desk work starts with building a fact base on where demand is coming from and how pricing is moving across end uses. We refer to public sources such as the USGS for mineral and ceramics related statistics, UN Comtrade for trade flows, the International Energy Agency for power and grid investment signals, and the World Bank for macro indicators used in normalization.
To keep the model grounded in electronics pull-through, we also review non-paywalled sources such as IEEE and other peer-reviewed engineering journals for adoption trends (for example, dielectric and thermal requirements by device type), along with customs and port releases where available. Company annual reports, investor presentations, and credible industry press are used to confirm capacity additions, utilization commentary, and regional mix. In a few places, paid subscriptions for company financials and patent databases are used to speed up cross-checking, but the core inputs remain traceable to public evidence. The desk source list is not exhaustive, and many other references were used to collect data, validate assumptions, and clarify gaps.
Primary Interviews and Surveys
Primary work is used to test what the desk signals are really implying for ceramics content, mix, and pricing across electronics and electrical uses. We speak with a spread of stakeholders such as material suppliers, component makers, distributors, and procurement and engineering roles at end users. Coverage spans APAC, EMEA, and the Americas so regional mix and export exposure are not treated as assumptions without confirmation.
Distribution of primary research fieldwork respondents
| Company type | Respondent position | Region |
|---|---|---|
| Top tier: 36% | CXOs: 12% | APAC: 42% |
| Mid tier: 44% | Functional/Unit leaders: 42% | EMEA: 31% |
| Smaller Players: 20% | Managers: 46% | Americas: 27% |
Market-Sizing & Forecasting
Sizing is built using a top-down approach where demand pools are reconstructed from electronics and electrical production signals, and then translated into ceramics value using use-case level content and pricing ranges. To keep totals realistic, the output is corroborated with selective bottom-up approximations, such as rolling up sampled supplier revenues, channel checks, and ASP times volume checks for key product families, followed by adjustments where gaps show up.
Inputs used in the model include electronics and electrical production growth, grid and power equipment investment cycles, EV and charging infrastructure build-out, the mix shift toward higher dielectric and higher thermal conductivity parts, and average price movements tied to raw material and energy costs. When forecasting, scenario analysis is used so short-term cycles in electronics demand and longer-cycle utility spending are both reflected. Assumptions are aligned to what industry participants expect for capacity, utilization, and pricing behavior. Where supplier roll-ups are incomplete, we fill the gap using regional trade signals and peer benchmarks, and then we recheck the implied per-unit ceramics value against interview feedback so the final number stays explainable.
Data Validation & Update Cycle
Validation is done through a set of cross-checks that compare the model output against independent signals, including trade direction, capacity commentary, and end-use production trends, so outliers can be surfaced early. If a segment shows a sharp step-change, the underlying drivers are reviewed, and follow-up questions are triggered with industry contacts to confirm whether the change is structural or timing related.
Before sign-off, the work goes through multi-step analyst reviews where assumptions, currency treatment, and year alignment are checked for variance. Reports are refreshed annually, and interim updates are made when material events occur, such as major capacity additions, policy shifts tied to energy infrastructure, or a sudden change in electronics demand. Right before delivery, a fresh pass is completed so clients receive the latest updated view based on the most recent data points.
Mordor Intelligence's Electronics and Electrical Ceramics Market Sizing Compared With Other Published Estimates
Published market values for electronics and electrical ceramics can look far apart, even when the topic name is similar, because the counting rules are often not the same. Differences usually come from what is included as ceramics value, which year is treated as the base, and whether demand is tied back to measurable electronics and electrical production signals.
In our checks, the biggest spread typically comes from scope and unit logic, where some estimates appear to fold in broader advanced ceramics or downstream component revenue, and some use aggressive price ramps without validating them against end-use production and trade movements. The main gap is clear when electrical insulation ceramics and electronics-grade ceramics are counted only when they are sold into defined electrical and electronic applications, with annual refresh checks on pricing and regional mix applied by Mordor Intelligence.
Benchmark comparison
| Source | Market Size | Gaps in Research Methodology |
|---|---|---|
| Mordor Intelligence | USD 13.81 B (2025) | |
| Industry Publisher A | USD 13.20 B (2025) | Uses a similar headline market label but can differ on what is treated as electronics-grade versus general electrical ceramics, and its long-horizon view to 2035 can apply smoother growth and pricing paths that are not always re-anchored to short-cycle electronics demand swings. |
| Global Research House B | USD 55.00 B (2025) | The stated figure is presented as a sales market and is likely capturing a much wider revenue pool, which can include broader ceramics and component-level sales that sit beyond the ceramics material value counted in this study. |
The table shows that close estimates usually differ because of small scope and pricing choices, while very large numbers often signal a broader revenue definition. Our approach keeps each step tied to observable demand indicators and clear inclusion rules, which makes the final market value easier to repeat and explain year after year.


Key Questions Answered in the Report
What is the current value of the electronics and electrical ceramics market?
The electronics and electrical ceramics market size reached USD 14.5 billion in 2026.
How fast is the electronics and electrical ceramics market expected to grow?
The market is forecast to register a 4.98% CAGR from 2026 to 2031.
Which region leads the electronics and electrical ceramics market?
Asia-Pacific dominates with 48.05% share in 2025 and is also the fastest-growing region at 5.93% CAGR to 2031.
Which material segment is expanding quickest within the electronics and electrical ceramics market?
Titanate ceramics are projected to grow at 6.12% CAGR through 2031 due to strong piezoelectric demand.
Why are ceramics preferred over metals in EV traction inverters?
Ceramic substrates deliver thermal conductivities above 20 W/mK and maintain electrical insulation at high junction temperatures, enabling compact SiC power modules.
Page last updated on:


 Your data is secure and never sold or shared.


