
Ball Valve Market Size and Share
Market Overview
| Study Period | 2020 - 2031 |
|---|---|
| Market Size (2026) | USD 13.57 Billion |
| Market Size (2031) | USD 16.23 Billion |
| Growth Rate (2026 - 2031) | 3.64 % |
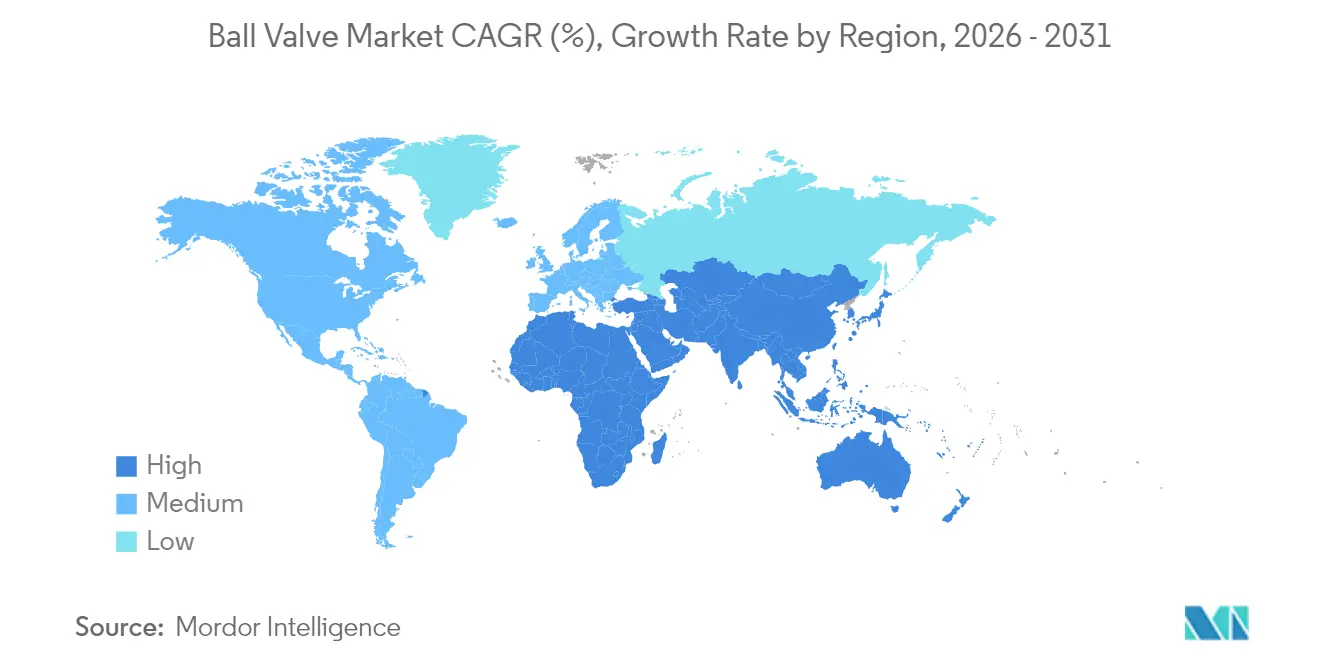
| Fastest Growing Market | Middle East and Africa |
| Largest Market | Asia Pacific |
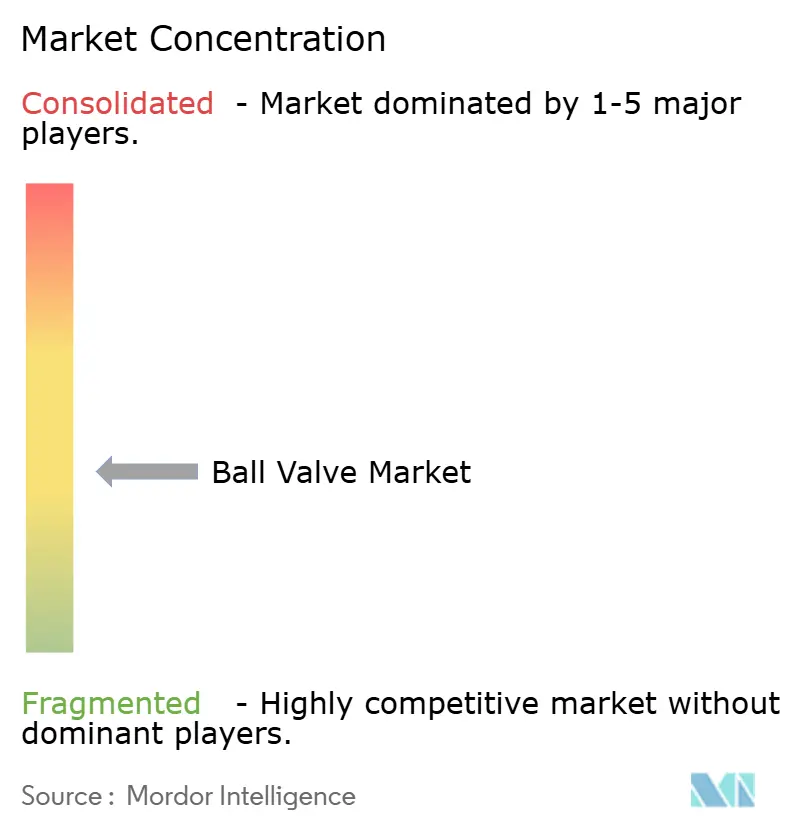
| Market Concentration | Medium |
Major Players *Disclaimer: Major Players sorted in no particular order Image © Mordor Intelligence. Reuse requires attribution under CC BY 4.0. | |
Ball Valve Market Analysis by Mordor Intelligence
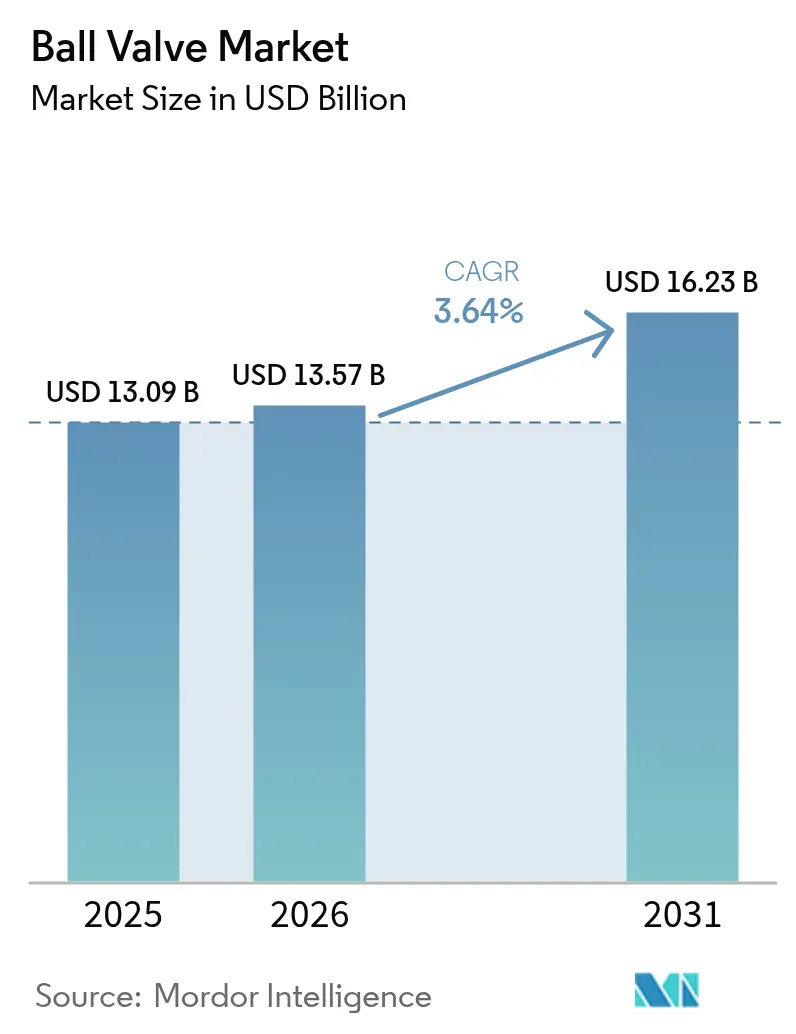
The Ball valve market size was valued at USD 13.09 billion in 2025 and estimated to grow from USD 13.57 billion in 2026 to reach USD 16.23 billion by 2031, at a CAGR of 3.64% during the forecast period (2026-2031). The outlook confirms a steady, demand-backed expansion that mirrors the pace of global infrastructure upgrades rather than boom-cycle growth. Widespread liquefied natural gas (LNG) build-outs in Asia, regulatory pressure to cut fugitive emissions in hydrocarbon economies, and accelerated digitalization of water utilities are the principal forces reinforcing long-term valve demand. Project owners are prioritizing component integrity, safety compliance, and low lifetime emissions, which amplifies preference for premium ball valves over lower-cost substitutes. At the same time, supply-chain bottlenecks in specialty forgings and volatile stainless-steel prices are tempering near-term profit margins, especially for mid-tier Asian fabricators.
Key Report Takeaways
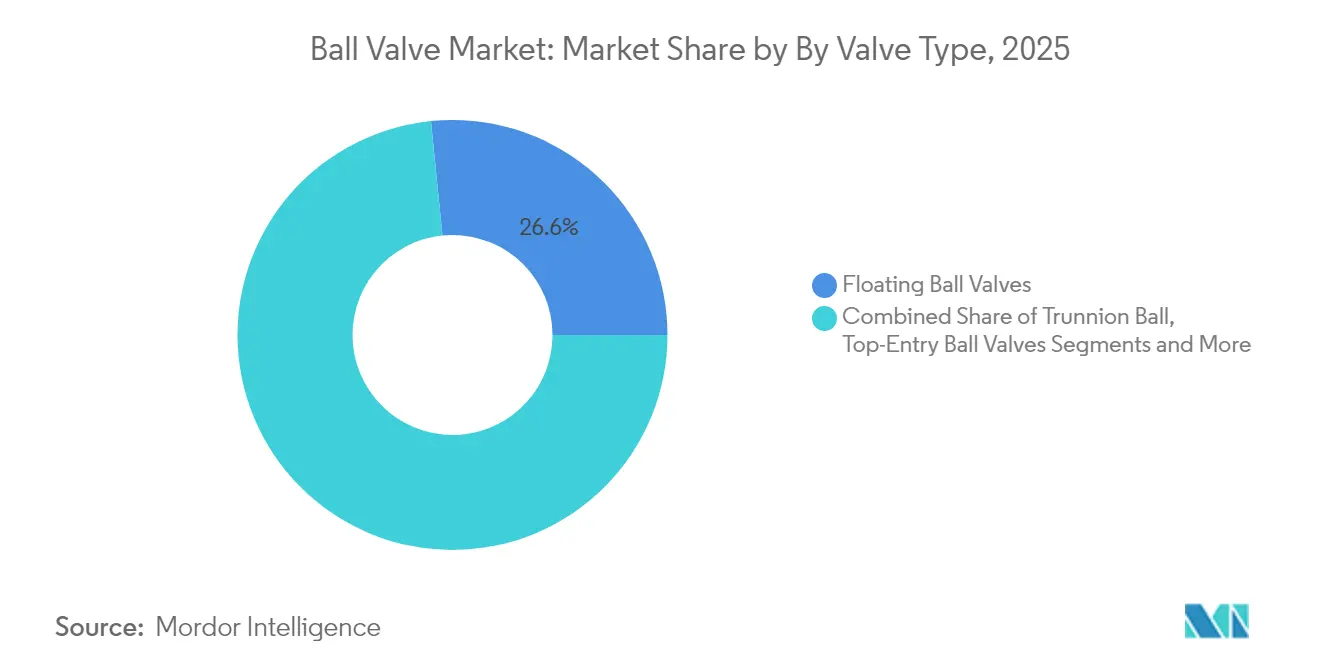
- By valve type, floating ball valves held 26.60% of Ball valve market share in 2025, while cryogenic designs are on course for a 6.12% CAGR to 2031.
- By material, carbon steel captured 31.50% of the Ball valve market share in 2025; alloy-based materials are expanding at a 5.07% CAGR through 2031.
- By valve size, the 1"–6" class led with 33.30% share of the Ball valve market size in 2025, whereas units above 50" are poised to grow 6.31% per year to 2031.
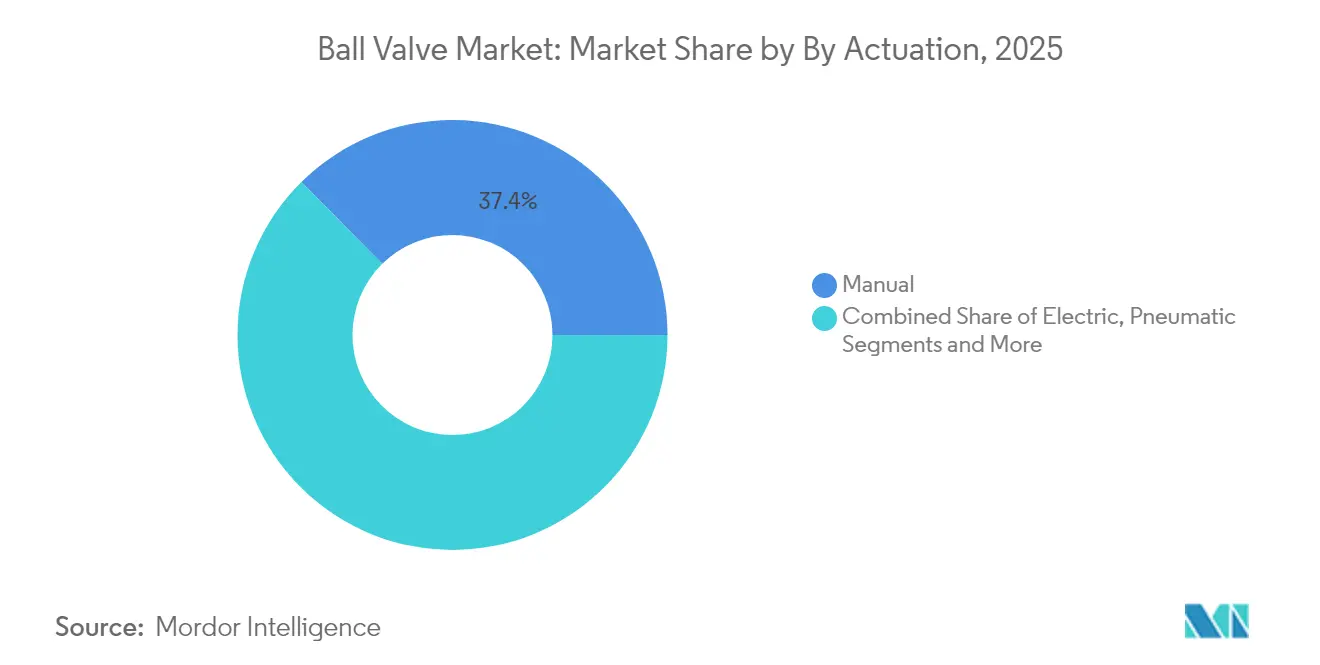
- By actuation, manual devices accounted for 37.40% share of the Ball valve market size in 2025; electric actuators represent the fastest track at a 6.02% CAGR.
- By end-user, oil and gas remained the biggest spender with 20.70% share in 2025; water and wastewater treatment is set to register a 5.83% CAGR to 2031.
- By region, Asia dominated the Ball valve market with 30.60% revenue in 2025; the Middle East is projected to pace growth at 4.94% CAGR through 2031.
Note: Market size and forecast figures in this report are generated using Mordor Intelligence’s proprietary estimation framework, updated with the latest available data and insights as of 2026.
Market Trends and Insights
Drivers Impact Analysis of Ball Valve Market*
| DRIVER | (~) % IMPACT ON CAGR FORECAST | GEOGRAPHIC RELEVANCE | IMPACT TIMELINE |
|---|---|---|---|
| Accelerated LNG Infrastructure Expansion in Emerging Asia Pacific | +0.8% | ASEAN core, spill-over to South Asia | Medium term (2-4 years) |
| Rising Adoption of Severe-Service Ball Valves in Hydrogen & CCS Projects across Europe | +0.6% | EU core, UK, Norway | Long term (≥ 4 years) |
| North American Mid-stream Asset Modernization Mandates Driving Replacement Demand | +0.5% | North America, selective Canadian provinces | Short term (≤ 2 years) |
| Rapid Digitalization of Water Utilities Spurs Smart Ball Valve Retrofit in Nordics | +0.3% | Nordic countries, selective EU markets | Medium term (2-4 years) |
| Surge in FPSO Deployments Boosting Cryogenic Ball Valve Uptake in Brazil & West Africa | +0.4% | Brazil, West Africa offshore | Medium term (2-4 years) |
| Regulatory Push for Low-Emission Valves in the Middle East | +0.2% | Middle East core, selective GCC states | Short term (≤ 2 years) |
| Source: Mordor Intelligence | |||
Accelerated LNG Infrastructure Expansion in Emerging Asia Pacific
Asian governments view LNG as an immediate route to strengthen energy security and cut coal reliance. An 18% rise in global LNG export capacity in 2025, mainly aimed at Asian import terminals, magnifies demand for cryogenic ball valves rated to –162 °C. These units must guarantee methane-tight sealing throughout liquefaction, transport, and regasification duty, which favors vendors with deep metallurgical expertise and validated low-temperature testing records. Import-dependent markets such as Vietnam and the Philippines, lacking pipeline grids, are rolling out floating storage and regasification units that specify premium trunnion-mounted cryogenic valves. This requirement lifts average selling prices and insulates leading suppliers from substitution risk, reinforcing profitable growth for the Ball valve market.[1]Institute for Energy Economics and Financial Analysis, “Global LNG Outlook 2024-2028,” ieefa.org
Rising Adoption of Severe-Service Ball Valves in Hydrogen & CCS Projects across Europe
The EU’s plan to generate 10 million t of renewable hydrogen by 2030 requires pipelines and storage networks that can withstand pressures above 700 bar while avoiding hydrogen-induced cracking. Duplex and super-duplex alloys are moving into mainstream production to meet these mechanical demands and the corrosion challenges of supercritical CO₂ in carbon capture and storage (CCS) lines. Manufacturers that certify materials under evolving hydrogen standards enjoy a first-mover advantage, because plant owners seek proven safety documentation before awarding contracts. This trend cements Europe’s role as a technology test bed and enlarges the premium tier of the Ball valve market.
North American Mid-stream Asset Modernization Mandates Driving Replacement Demand
Pipelines built during the 1970s are approaching design end-life, and regulators now require upgraded valves that integrate real-time monitoring. Pipe, valve, and fitting (PVF) spend across the United States and Canada will climb to USD 42.5 billion in 2025. Operators emphasize reliability and superior sealing over unit price, which raises margins on replacement projects. Digital valve diagnostics, aligned with federal leak detection rules, form a core procurement criterion and push adoption of smart electric actuators deloitte.com. However, chronic forging shortages have stretched lead times past 30 weeks, prompting some projects to explore plug-valve alternatives in less-critical services.
Rapid Digitalization of Water Utilities Spurs Smart Ball Valve Retrofit in Nordics
Nordic utilities are using internet-of-things (IoT) retrofits to manage distribution losses. Scandinavian pilot programs show leakage ratios dropping from 30% to 10% after full automation, validating the value proposition for connected valves. Artificial-intelligence (AI) analytics embedded in supervisory control and data acquisition (SCADA) platforms predict wear patterns and schedule maintenance before failure, lowering operating costs. The economic case is strongest in high-labor-cost economies, where field inspections are expensive. The experience is influencing municipal utilities across continental Europe, scaling demand for retrofittable actuator kits that transform legacy ball valves into network assets.
Restraints Impact Analysis of Ball Valve Market*
| RESTRAINTS | (~) % IMPACT ON CAGR FORECAST | GEOGRAPHIC RELEVANCE | IMPACT TIMELINE |
|---|---|---|---|
| Prolonged Lead-Times due to Global Forging Capacity Constraints | -0.4% | Global, acute in specialized alloys | Short term (≤ 2 years) |
| High Capital Outlay for Metal-Seated Valves in Abrasive Mining Applications | -0.2% | Mining-intensive regions globally | Medium term (2-4 years) |
| Increasing Preference for Plug & Butterfly Valves in Compact HVAC Systems | -0.3% | Global, concentrated in urban markets | Long term (≥ 4 years) |
| Volatile Stainless-Steel Prices Eroding Margins for Tier-2 Asian Manufacturers | -0.2% | Asia Pacific, selective emerging markets | Short term (≤ 2 years) |
| Source: Mordor Intelligence | |||
Prolonged Lead-Times due to Global Forging Capacity Constraints
A decade of supplier consolidation has left only a handful of open-die forges capable of producing large-diameter, nickel-alloy blanks. Simultaneous demand from aerospace and energy increases capacity strain, with delivery cycles stretching to 24–32 weeks versus the historical 12–16 week window. Project owners now embed buffer inventories or accept alternate valve styles if schedule risk outweighs technical benefit. Some OEMs pursue vertical integration, but capital needs and qualification timelines delay relief until late decade.[2]Supply House Times, “State of the industrial PVF market,” supplyht.com
High Capital Outlay for Metal-Seated Valves in Abrasive Mining Applications
Metal-seated ball valves using tungsten-carbide or ceramic inserts deliver long service life in slurry lines but can cost four times more than soft-seated versions. Many mines facing volatile commodity pricing choose lower-cost valves, accepting higher maintenance frequency. The trade-off restrains uptake in cash-constrained regions even though total cost of ownership favors premium designs in remote or deep-shaft operations.
*Our forecasts treat driver/restraint impacts as directional, not additive. The impact forecasts reflect baseline growth, mix effects, and variable interactions.
Ball Valve Market Segment Analysis
By Valve Type:
Cryogenic Applications Drive InnovationThe Ball valve market size for floating designs logged 26.60% revenue in 2025, driven by their adaptability across refinery, water, and general-purpose services. Cryogenic ball valves, though niche, are rising at a 6.12% CAGR as LNG terminals and hydrogen export hubs demand guaranteed sealing down to –162 °C. End users emphasize zero-leakage seats and blow-out-proof stems validated by helium mass-spectrometer testing, a standard that raises entry barriers and sustains premium price realization.
Additive-manufactured flow paths, now field-proven in subsea pilots, reduce weight and pressure drop in fully welded bodies. Meanwhile, orbit and rising-stem variants preserve seat life where throttling duty would damage conventional floating valves. Together, these developments diversify product portfolios and extend the functional scope, preserving relevance of ball valves even in markets exploring butterfly or plug alternatives.



By Material:
Alloy Innovation Meets Hydrogen DemandsCarbon steel held 31.50% share of the Ball valve market size in 2025 thanks to its favorable strength-to-cost ratio across pipelines and industrial utilities. Hydrogen projects now favor alloy-based bodies with super-duplex or austenitic grades to resist embrittlement, raising alloy demand at a 5.07% CAGR. Duplex grades also unlock higher allowable pressure ratings, enabling pipeline engineers to downsize schedules and shave capex.
Stainless-steel price volatility pushes OEMs to qualify dual-certified grades that meet both 304L and 316L requirements, streamlining procurement flexibility. Additive manufacturing introduces functionally graded materials where high-nickel matrices reinforce seat zones, while carbon-steel dominates outer shells, optimizing total cost.
By Valve Size:
Large Bore Applications Command Premium1"–6" valves delivered 33.30% of 2025 revenue yet face modest growth as industrial baseload demand stabilizes. Units above 50" show a 6.31% CAGR as LNG export trains and offshore risers scale diameter to move larger gas volumes. These valves require purpose-built machining centers and deep-hole boring, limiting global supply to fewer than 10 certified workshops.
Weight drives installation economics; thus, designers adopt forged bar sections with finite-element-optimized wall profiles that cut mass without lowering burst rating. Automated phased-array ultrasonic testing has become standard to assure defect-free forgings. The Ball valve market benefits through value-rich orders even if volumes are low compared with mid-size categories.
By Actuation:
Electric Systems Gain Smart IntegrationManual gearboxes still dominate the Ball valve market, claiming 37.40% of 2025 shipments, because they suit applications with minimal cycling and on-site operator presence. Electric-actuated units are advancing at 6.02% CAGR as digital plant architectures require closed-loop control and predictive maintenance. Upgraded firmware now embeds HART, Modbus, and PROFINET in a single board, easing integration with distributed control systems.
Battery-backed solar kits broaden use in remote valve stations, while cloud analytics forecast stem torque trends that signal packing wear. Pneumatic drives retain a niche in explosion-hazard zones; hydraulic cylinders govern rapid-stroke emergency shut-down duty. The net result is a more heterogeneous actuation mix that deepens service revenue potential across the Ball valve industry.
By End-User Industry:
Water Utilities Lead Growth TransitionOil and gas contributed 20.70% of 2025 revenue but trails future growth as upstream budgets increasingly diversify into carbon-efficient ventures. Water and wastewater agencies will expand spend at 5.83% CAGR because regulatory targets for non-revenue water force utilities to modernize valves and telemetry. Evidence from Nordic pilot cities shows triple-offset leakage reductions, motivating capital allocations despite tight municipal budgets.
Chemical producers order high-alloy valves for corrosive streams; mining operations weigh premium metal seats against capex limits yet lean toward metal-seated upgrades in isolated sites where downtime is costly. Food, beverage, and pharmaceutical plants specify sanitary internals and traceable alloys, adding documentation-driven value to the Ball valve market.
Geography Analysis
APAC Ball Valve Market
Asia accounted for 30.60% of Ball valve market revenue in 2025, propelled by Chinese industrial growth and Southeast Asian LNG import terminals. Government policies that mandate cleaner energy mix underpin sustained valve procurement. India’s “Make in India” scheme fosters domestic valve production yet still relies on imported severe-service trims for hydrogen pilots. Japan and South Korea prioritize high-performance alloys for niche chemical processes, maintaining a technology premium in regional trade.
Middle East and Turkey Ball Valve Market
The Middle East is the fastest-growing cluster, projecting 4.94% CAGR to 2031 as operators retrofit low-emission valves in legacy fields and build green-field LNG mega-trains. Qatar’s North Field expansion alone calls for thousands of cryogenic units, while Saudi Aramco deploys smart actuators across gas gathering networks to satisfy methane-intensity goals. Turkey’s transit ambitions also translate into large-bore pipeline valve orders.
North America Ball Valve Market
North America retains sizable share owing to mid-stream replacement mandates. Shale-gas gathering systems need high-pressure ball valves resistant to acid gases. Canadian oil sands lines demand hard-faced seats to manage bitumen abrasion. Mexico, opening its energy market, imports API 6D-certified valves for export-class pipelines. Climate regulation stimulates adoption of ISO-15848-1 certified products, adding incremental requirements that favor established brands.

Regulatory Landscape
Ball valves used in oil and gas and other regulated process services are governed primarily by international standards and operator procurement specifications, with API 6D and ISO 14313 forming common baselines for pipeline valve design, testing, and documentation. In September 2024, API issued Addendum 2 to API Specification 6D (25th Edition), reinforcing revisions that cascade into project specifications and supplier qualification packages for API 6D-certified valves.
Operator-led procurement frameworks also shape compliance requirements. In April 2026, the International Association of Oil and Gas Producers (IOGP) published JIP33 Specification S-562 (Version 4.0) and its associated quality requirements, updating minimum procurement requirements for ball valves aligned to API 6D and raising expectations for traceability and quality system controls for suppliers targeting major upstream and LNG projects. For plastics piping applications, ISO 18984:2025 (published July 2025) adds a dedicated reference point for ball valves used in thermoplastics systems. On the trade side, ball valves typically move under Harmonized Tariff Schedule heading 8481, and Section 301 measures continue to influence landed costs for certain China-origin valve imports into the United States, affecting sourcing decisions and regional manufacturing strategies.
Value Chain Analysis
The ball valve value chain starts with raw materials and semifinished inputs (carbon steel, stainless steel, duplex/super-duplex, and nickel alloys) and proceeds through forging and casting, machining of bodies and balls, seat and stem component supply, surface treatments/coatings, assembly, and functional testing (pressure testing and application-specific leak testing for low-emission and cryogenic duty). Certification and documentation layers, including API 6D/ISO 14313 conformance and fugitive-emission qualification (for example, ISO 15848-1 referenced in many specifications), are integral steps for suppliers serving oil and gas, LNG, and other high-integrity end users.
Downstream, OEMs sell via direct project channels (EPCs and major operators) and through distributors/MRO networks, with aftermarket spares and refurbishment supporting installed-base economics. Current pinch points sit upstream in specialty forgings and exotic-alloy trims, consistent with the report context of large-diameter and specialty-alloy lead times stretching well beyond historical norms. Qualification cycles in high-integrity energy applications also slow supplier switching. Digitalization is pushing more value into packaged solutions, where ball valves are bundled with electric/pneumatic actuators, positioners, and diagnostics for SCADA/DCS integration, shifting bargaining power toward suppliers that can deliver complete, documented valve-and-actuator assemblies and sustain service support across regions.
Competitive Landscape
Industry structure is moderately concentrated. Emerson, Flowserve, and Schlumberger combine wide portfolios, aftermarket presence, and global service bases to anchor premium project awards. Technological differentiation now centers on digital valve twins, advanced alloys, and integrated severe-service packages rather than sheer manufacturing scale.
Acquisition activity reshapes product breadth. Flowserve’s USD 290 million purchase of MOGAS doubled its mining exposure, underscoring a strategy to absorb niche innovators rather than develop in-house flowserve.com. IMI plc secured North Sea anti-surge contracts by pairing additive-manufactured internals with proprietary drag-control trims, highlighting material and flow-path innovation as market levers.
Tier-2 Asian suppliers face cost headwinds because stainless-steel price surges cannot be passed through in fixed-price export tenders. Some move up the value chain by securing ISO-15848-1 certifications and forming alliances with actuator specialists to offer complete packages. Competitive pressure also arises from butterfly and plug manufacturers entering the Ball valve market with compact designs that address HVAC space constraints yet still meet moderate pressure needs.
Ball Valve Industry Leaders
Emerson Electric Co.
Flowserve Corporation
Schlumberger (Cameron)
IMI plc
Kitz Corporation
- *Disclaimer: Major Players sorted in no particular order
Ball Valve Market Companies Covered in this Report
- Emerson Electric Co.
- Flowserve Corporation
- Schlumberger (Cameron)
- IMI plc
- Kitz Corporation
- Crane Co.
- Baker Hughes (Valves and Process Solutions)
- Honeywell International Inc.
- Alfa Laval AB
- Curtiss-Wright Corporation
- SAMSON AG
- Velan Inc.
- CIRCOR International Inc.
- AVK Holding
- Mueller Water Products Inc.
- Neway Valve Co., Ltd.
- Bonney Forge Corp.
- Metso Corporation (Valmet)
- Hitachi Ltd.
- Valvitalia S.p.A.
- Georg Fischer Ltd.
- Danfoss A/S
- Castel SRL
- Sanhua Holding Group

Market Opportunities and Future Outlook
White space is most visible where buyers need documented low-emission performance, digital diagnosability, and severe-service metallurgy rather than commodity pricing. The report context points to regulatory pressure to cut fugitive emissions in hydrocarbon economies and accelerated digitalization of water utilities, which increases demand for certified low-leakage valve designs and actuator-ready platforms that retrofit into existing networks. This supports an opportunity set around complete valve automation packages (valve, actuator, controls, and documentation) for midstream modernization programs and municipal water operators seeking remote monitoring and predictive maintenance.
Regionalized manufacturing and capacity additions also create room for suppliers that can shorten lead times and qualify locally. In November 2025, ITT Gould Pumps completed a USD 25 million expansion at its Dammam, Saudi Arabia site, doubling production capacity for industrial process valves and pumps, aligning with Middle East demand for low-emission retrofits and large project volumes. In March 2026, AS-Schneider inaugurated a new production facility in Coimbatore, India to support process-industry demand in Asia-Pacific, while Challenger Valves opened an AUD 8 million facility in Shepparton, Australia to expand manufacturing and distribution capacity. Suppliers and integrators can leverage these hub builds to provide faster delivery for standard-to-mid engineered valves and to strengthen local service and documentation capabilities for LNG terminals, pipeline upgrades, and water utility automation programs.
Recent Industry Developments in Ball Valve Market
- June 2026: Flowserve completed its all-cash acquisition of the Trillium Flow Technologies Valves Division for USD 490 million. The deal broadened Flowserve's engineered valve portfolio and strengthened its positioning in nuclear and conventional power applications, where long qualification cycles and mission-critical specifications favor established suppliers.
- February 2026: SLB introduced a fully electric Cameron frac fluid delivery system with electric actuation and automation for hydraulic fracturing operations. The move reinforces electrification and automation themes in field equipment, supporting demand for valve packages that integrate controls while reducing reliance on hydraulic systems in harsh operating environments.
- January 2024: Emerson launched the Fisher easy-Drive 200R electric actuator. The product adds an electrification pathway for valve actuation in process industries, supporting broader adoption of digitally integrated valve assemblies aligned with plant automation and remote operability requirements.


Ball Valve Market Report Scope and Research Methodology
Market Definition and Coverage
This market covers revenue generated from ball valves sold for flow isolation and control across industrial, utility, and building applications, regardless of end-user industry. Our sizing focuses on valves sold as products, and it is tracked across major demand regions using consistent currency and timing assumptions.
Scope exclusions: Excludes butterfly, gate, globe, check, plug, and control valves that are not ball-valve based, even if they are used in the same pipelines and plants.
Segments Covered in This Report
- By Valve Type
- Floating Ball Valves
- Trunnion-Mounted Ball Valves
- Rising-Stem / Orbit Ball Valves
- Top-Entry Ball Valves
- Fully-Welded Ball Valves
- Cryogenic Ball Valves
- By Material
- Carbon Steel
- Stainless Steel
- Cast Iron / Ductile Iron
- Alloy-Based (Duplex, Inconel, Hastelloy)
- Bronze and Brass
- Other Materials
- By Valve Size
- Up to 1" (DN 25)
- 1" - 6"
- 6 " - 25"
- 25" - 50"
- Above 50"
- By Actuation
- Manual
- Electric
- Pneumatic
- Hydraulic
- Electro-Hydraulic
- By End-User Industry
- Oil and Gas
- Chemicals and Petrochemicals
- Water and Wastewater
- Power Generation
- Mining and Metals
- Food and Beverage
- Pharmaceuticals and Biotechnology
- HVAC and Refrigeration
- Pulp and Paper
- Other Industries
- By Geography
- North America
- United States
- Canada
- Mexico
- Europe
- United Kingdom
- Germany
- France
- Italy
- Rest of Europe
- Asia-Pacific
- China
- Japan
- India
- South Korea
- Rest of Asia-Pacific
- Middle East
- Israel
- Saudi Arabia
- United Arab Emirates
- Turkey
- Rest of Middle East
- Africa
- South Africa
- Egypt
- Rest of Africa
- South America
- Brazil
- Argentina
- Rest of South America
- North America
Data Sources, Market Sizing, and Validation
Desk Research
We started by mapping where ball valves get consumed and how that demand shows up in public data, so later assumptions could be tied back to visible activity. Useful references included sources such as the US Energy Information Administration for upstream and midstream indicators, the International Energy Agency for power and fuel mix signals, and the USGS for metals and alloy availability that influence valve production economics.
To anchor regional demand cycles, we also reviewed sources such as UN Comtrade for trade flows, national statistics offices for construction and industrial output trends, and water or wastewater utility publications where replacement cycles are discussed. These were complemented with company filings and investor presentations, association sites, and reputed press coverage to capture capacity expansions, plant shutdowns, and project pipelines. We also used a paid subscription for company financials and news, plus an import and export shipment-level database where it helped validate directional trade movements. The desk sources listed above are illustrative, and many other public references were checked to collect data, validate it, and clarify open questions.
Primary Interviews and Surveys
Primary work was used to pressure-test demand drivers and pricing logic that desk sources cannot fully explain, especially for specialty designs and large-diameter valves. We spoke with a mix of manufacturers, distributors, EPC linked stakeholders, and end-user maintenance teams across major consuming regions, and then used follow-ups to reconcile gaps between project activity, replacement demand, and realized shipments.
Distribution of primary research fieldwork respondents
| Company type | Respondent position | Region |
|---|---|---|
| Top tier: 39% | CXOs: 14% | APAC: 47% |
| Mid tier: 47% | Functional/Unit leaders: 32% | EMEA: 33% |
| Smaller Players: 14% | Managers: 54% | Americas: 20% |
Market-Sizing & Forecasting
Sizing was built using top-down demand pool reconstruction, where industrial output and project activity were translated into valve consumption by end-use, and then rolled up by region into a single market value. To keep the totals realistic, selective bottom-up approximations were applied as checks, using sampled ASP x volume logic by valve size bands and actuation mix, followed by distributor and channel checks for order patterns.
Key inputs included: announced pipeline and LNG related project additions, water and wastewater network capex and replacement cadence, refinery and chemical capacity changes, the share of automated actuation versus manual in new builds, and stainless steel versus carbon steel price trends that shift average selling prices. Where gaps appeared in country data, the model used peer-country proxies tied to industrial base and trade intensity, and then it was corrected using interview feedback on local sourcing and import reliance. Forecasting relied on scenario analysis, where a base case was created around expected capex cycles and maintenance spending, and then adjusted with expert views on project delays, permitting, and material cost pass-through.
Data Validation & Update Cycle
Outputs were checked against independent signals such as regional trade direction, large project commissioning timelines, and the implied valve intensity per application, so outliers could be spotted early. If a region showed an unusual jump, the assumptions were re-opened, and respondents were re-contacted to confirm whether it was price-led, volume-led, or timing related.
Before sign-off, the model and assumptions go through multi-step analyst reviews, where inputs, unit logic, and currency conversions are rechecked and sensitivity ranges are tested. The report is refreshed annually, with interim updates when material events occur, such as major energy project delays or sharp metals price moves. Right before delivery, we run a fresh pass on the key inputs so clients receive the most current view available.
Mordor Intelligence's Ball Valve Market Size Compared With Other Published Estimates
It is normal to see different market size numbers for ball valves because publishers do not always count the same revenue streams, time periods, and pricing assumptions. Differences also come from how each study treats trade flows, channel margins, and how often the estimate is refreshed.
Actuated assemblies and automation-heavy packages are sometimes counted as a bundled system in other studies, and this item sits outside Mordor Intelligence's scope when it is priced primarily as an actuator or control package rather than as a ball valve product sale. Gaps also show up when one estimate leans on factory-gate values, another uses end-user installed values, or when ASP escalation is applied uniformly even though material mix and size mix change over time.
Benchmark comparison
| Source | Market Size | Gaps in Research Methodology |
|---|---|---|
| Mordor Intelligence | USD 13.57 B (2026) | |
| Trade Journal A | USD 13.67 B (2024) | Uses a factory-gate framing and a different base year, which can understate downstream channel value and shift totals when end-use project timing changes. |
| Industry Publisher B | USD 12.60 B (2024) | Relies on a longer forecast window and higher-level segmentation, which can smooth short-cycle replacement demand and apply broader ASP progression assumptions across regions. |
The spread in the table is mainly explained by what gets counted as valve-only revenue versus bundled packages, plus the year used for the starting point and how prices are carried forward. By tying the estimate to visible demand indicators like project additions, utility renewal cycles, and realistic size and actuation mix, the resulting market value stays transparent and easier to reproduce.


Key Questions Answered in the Report
What is the current Ball valve market size and projected growth?
The market stands at USD 13.57 billion in 2026 and is estimated to reach USD 16.23 billion by 2031, reflecting a 3.64% CAGR.
Which region leads the Ball valve market?
Asia accounts for 30.60% of 2025 revenue, supported by industrial expansion in China and new LNG terminals across Southeast Asia.
Which valve type is growing fastest?
Cryogenic ball valves show the highest growth trajectory at 6.12% CAGR through 2031 due to LNG and hydrogen demand.
Why are electric actuators gaining share?
Plant digitalization drives demand for remote monitoring and predictive maintenance, causing electric-actuated valves to expand at 6.02% CAGR.
How are forging shortages affecting the market?
Limited forging capacity has doubled delivery lead times for large-diameter and specialty-alloy valves, prompting some buyers to consider alternative valve types.
What is driving Ball valve adoption in water utilities?
Nordic utilities cut leakage rates by installing smart, IoT-enabled ball valves, stimulating global interest in digital retrofits that improve water-network efficiency.
Page last updated on:


 Your data is secure and never sold or shared.


