Automotive Data Monetization Market Size and Share
Market Overview
| Study Period | 2020 - 2031 |
|---|---|
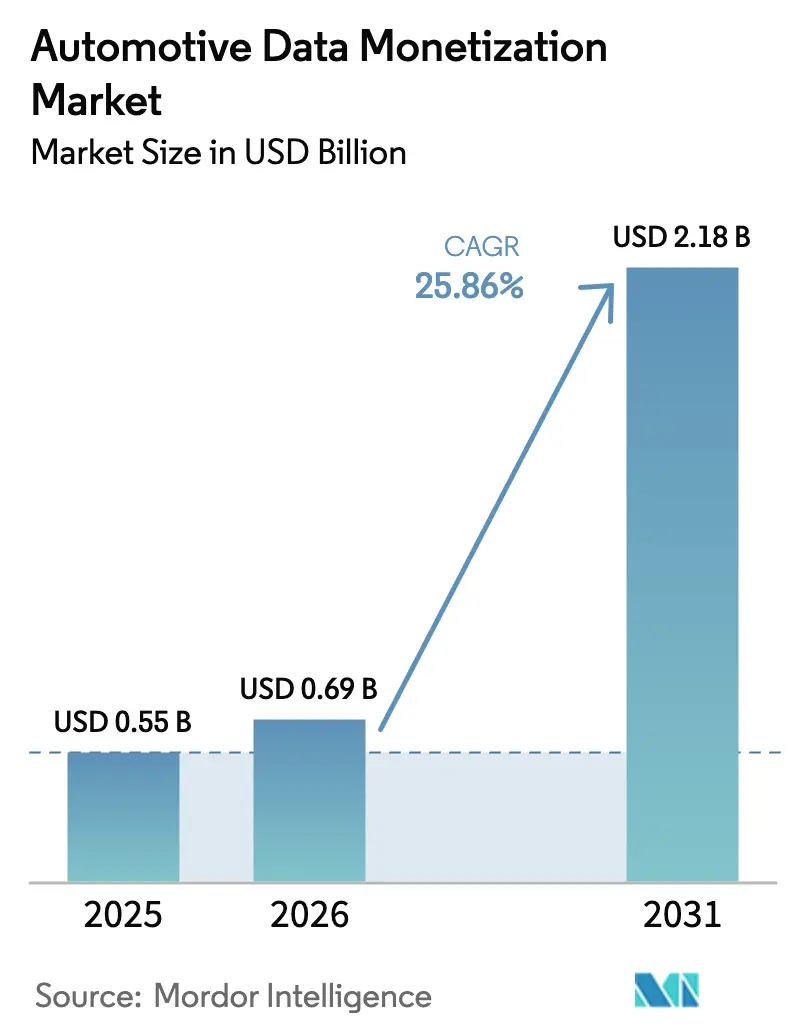
| Market Size (2026) | USD 0.69 Billion |
| Market Size (2031) | USD 2.18 Billion |
| Growth Rate (2026 - 2031) | 25.86% CAGR |
| Fastest Growing Market | Asia Pacific |
| Largest Market | North America |
| Market Concentration | Medium |
Major Players *Disclaimer: Major Players sorted in no particular order Image © Mordor Intelligence. Reuse requires attribution under CC BY 4.0. | |
Automotive Data Monetization Market Analysis by Mordor Intelligence
The automotive data monetization market size was valued at USD 0.55 billion in 2025 and estimated to grow from USD 0.69 billion in 2026 to reach USD 2.18 billion by 2031, at a CAGR of 25.86% during the forecast period (2026-2031). This pace underscores how connected-vehicle proliferation, software-defined architectures, and artificial-intelligence models reshape value creation from hardware sales to recurring data revenue. Direct licensing currently holds the largest automotive data monetization market share, while revenue-sharing marketplaces record the fastest growth, signaling a pivot toward open exchange platforms. Usage-based insurance dominates applications, yet smart-city analytics is the most rapidly expanding use case, supported by public-sector demand for mobility insights. Regionally, North America leads the automotive data monetization market, whereas Asia Pacific posts the strongest CAGR as China, Japan, and India accelerate connected-vehicle rollouts backed by supportive policy environments. Competitive intensity remains moderate because OEMs, technology platforms, and new data aggregators are still staking positions, with differentiation centering on privacy-preserving analytics and API standardization.
Key Report Takeaways
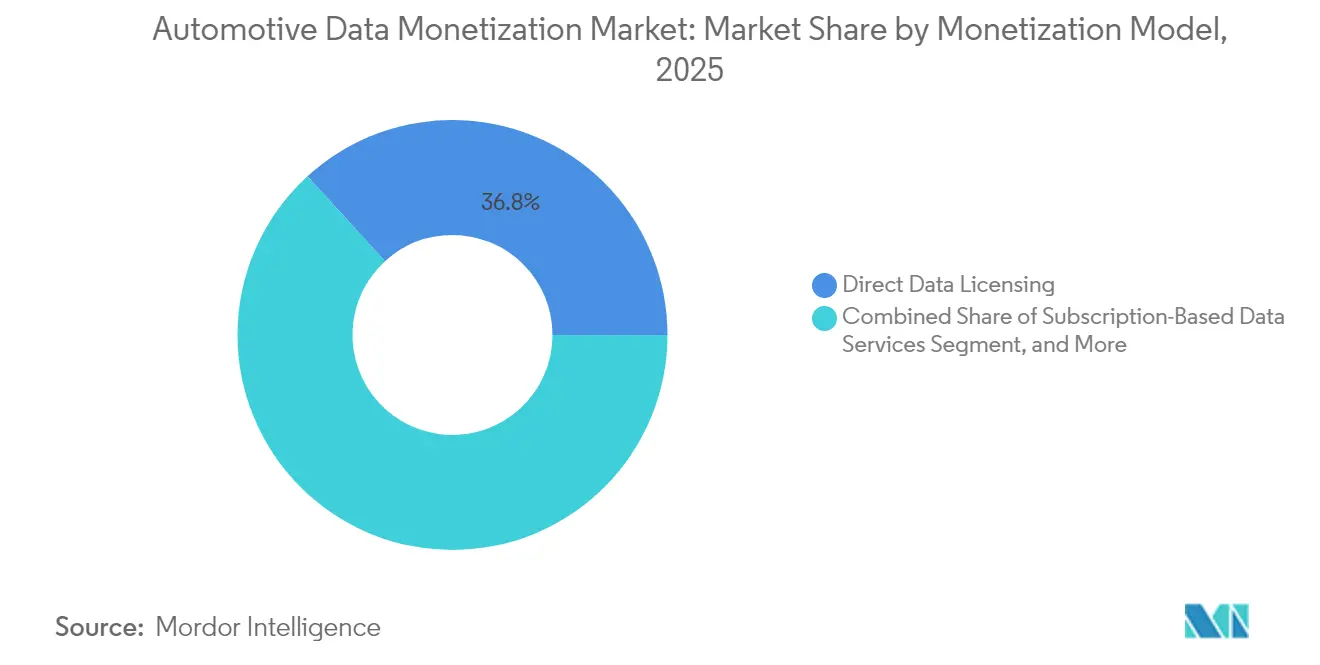
- By monetization model, direct licensing captured 36.78% of 2025 revenue, whereas revenue-sharing marketplaces are projected to expand at a 26.62% CAGR through 2031.
- By application, usage-based insurance held 41.64% of 2025 revenue, while smart-city and infrastructure analytics is forecast to grow at a 27.68% CAGR to 2031.
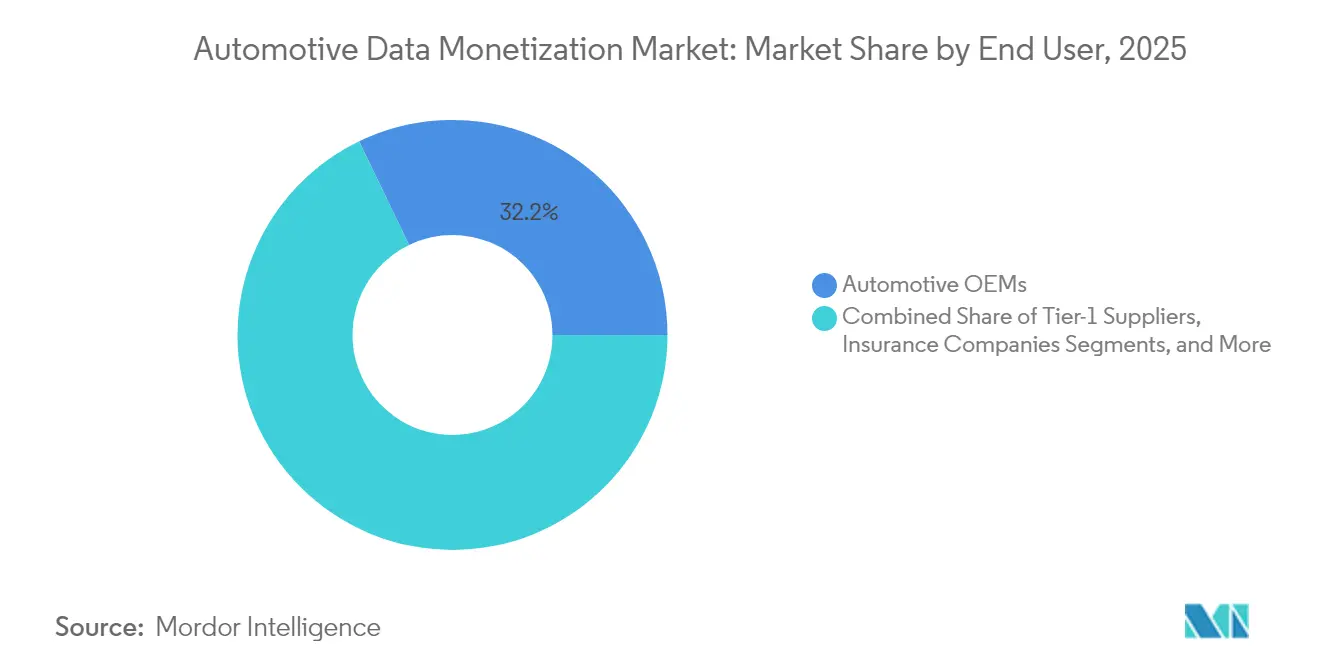
- By end user, OEMs led with 32.15% share in 2025, whereas government and infrastructure agencies record the highest projected CAGR at 28.6% during the forecast period.
- By data type, telematics and vehicle-health information accounted for 38.96% of 2025 revenue, and battery and powertrain analytics exhibit the fastest growth at a 26.85% CAGR through 2031.
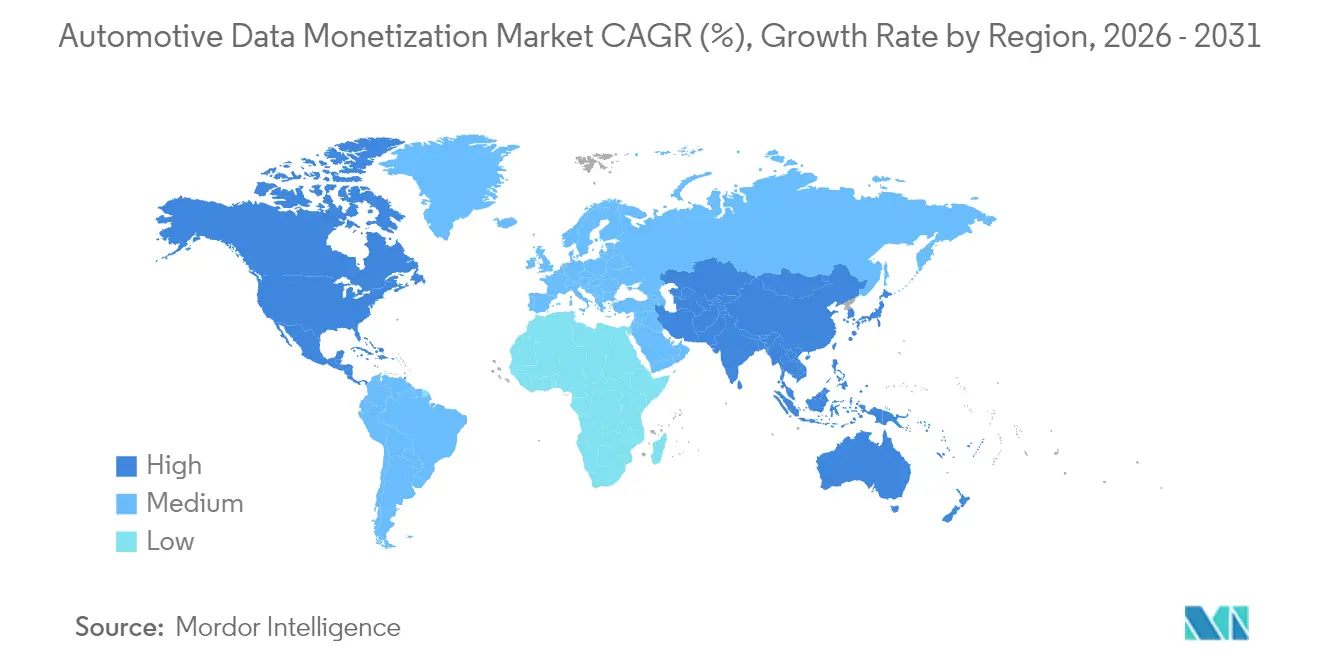
- By geography, North America commanded 33.88% of 2025 revenue, while Asia Pacific is advancing at a 26.54% CAGR to 2031.
Note: Market size and forecast figures in this report are generated using Mordor Intelligence’s proprietary estimation framework, updated with the latest available data and insights as of 2026.
Global Automotive Data Monetization Market Trends and Insights
Drivers Impact Analysis*
| Driver | (~) % Impact on CAGR Forecast | Geographic Relevance | Impact Timeline |
|---|---|---|---|
| Proliferation of connected vehicles and V2X infrastructure | +6.8% | Global, early gains in North America, Europe, China | Medium term (2-4 years) |
| Expansion of usage-based insurance programs | +5.2% | North America and Europe core; spill-over to Asia Pacific | Short term (≤ 2 years) |
| OEM shift toward software-defined vehicles and subscriptions | +4.9% | Global, led by premium segments in developed markets | Medium term (2-4 years) |
| Accelerating digital transformation across automotive value chain | +4.1% | Global, faster adoption in Asia Pacific | Long term (≥ 4 years) |
| Regulatory push for open-data APIs | +3.4% | Europe leading, North America following | Long term (≥ 4 years) |
| AI foundation models enabling synthetic vehicle data products | +2.8% | North America and China | Long term (≥ 4 years) |
| Source: Mordor Intelligence | |||
Proliferation of Connected Vehicles and V2X Infrastructure
Half of 2024 model-year vehicles shipped with embedded connectivity and penetration is on track to reach 90% by 2030. Bidirectional vehicle-to-everything links funnel 3-40 GB of data each day from more than 200 onboard sensors, effectively turning the car into a rolling data center.[1]The Fast Mode, “Driving on the Edge - The Ways Edge Computing Will Power Fifth-generation networks supply sub-millisecond latency that unlocks safety-critical use cases such as cooperative awareness messaging and enables real-time analytics services. As data volumes soar, the automotive data monetization market benefits from traffic optimization, predictive-maintenance subscriptions, and location-based offerings that derive value from these continuous feeds. OEMs and municipalities already pilot 5G road-side units that push real-time hazard alerts to drivers and, in return, harvest anonymized telemetry for congestion management.
Expansion of Usage-Based Insurance Programs
Telematics-driven insurance shifted from pilot stage to mainstream, with major carriers rolling out pay-how-you-drive and pay-as-you-drive products across North America and Europe. Granular metrics covering speed, acceleration, cornering, and environmental context feed AI models that calculate individual risk scores, moving underwriting away from demographic averages toward behavior-based pricing. Safe drivers earn premium discounts, insurers reduce claims costs, and data suppliers secure recurring revenue from high-frequency streams. Embedded telematics modules factory-installed by OEMs accelerate this adoption, eliminating aftermarket device costs and ensuring data quality. Early studies show double-digit declines in loss ratios where predictive models trigger pre-emptive driver coaching.
OEM Shift Toward Software-Defined Vehicles and Subscriptions
Automakers are restructuring around software stacks that decouple hardware lifecycles from digital services. Over-the-air update pipelines now push new features post-sale, turning each vehicle into a platform for continuous monetization. Executives surveyed anticipate software and digital services will represent the majority of profit pools by the mid-2030s.[2]IBM Institute for Business Value, “Automotive 2035,” ibm.com Recurring offerings already range from driver-assist upgrades to fleet productivity dashboards, priced monthly and activated on demand. Subscription adoption also increases the volume and granularity of operational data flowing back to manufacturers, which in turn creates fresh opportunities across the automotive data monetization market for analytics consultancies, component suppliers, and cloud providers.
Accelerating Digital Transformation Across the Automotive Value Chain
End-to-end digitization links manufacturing plants, suppliers, dealers, and service networks, generating consolidated datasets that complement in-vehicle telemetry. Cloud-native platforms and API-first architectures enable controlled sharing of operational metrics such as production quality, warranty events, and parts logistics. Digital twins simulate vehicle behavior under varying conditions, producing synthetic data that supplements real-world logs, reduces validation costs, and speeds new feature deployment. Battery OEMs already leverage combined manufacturing and field-usage datasets to predict degradation and optimize chemistries, demonstrating how cross-domain data fusion widens the addressable opportunities inside the automotive data monetization market.
Restraints Impact Analysis*
| Restraint | (~) % Impact on CAGR Forecast | Geographic Relevance | Impact Timeline |
|---|---|---|---|
| Heightened cybersecurity and privacy concerns | -3.8% | Global, stricter enforcement in Europe and California | Short term (≤ 2 years) |
| Lack of standardized data taxonomy across OEMs | -2.9% | Global, hindering cross-border exchanges | Medium term (2-4 years) |
| Edge-computing shift limiting centralized data availability | -2.1% | Advanced 5G markets | Long term (≥ 4 years) |
| Consumer backlash to in-cabin surveillance | -1.7% | North America and Europe | Medium term (2-4 years) |
| Source: Mordor Intelligence | |||
Heightened Cybersecurity and Privacy Concerns
Vehicles now collect extensive personal information and serve as potential gateways to safety-critical functions, making them prime cyber targets. High-profile breaches and stricter legislation such as the General Data Protection Regulation and the California Consumer Privacy Act impose stringent consent, encryption, and minimization requirements. Automakers must invest in secure boot chains, over-the-air patch management, and continuous threat monitoring, inflating operating costs and slowing new data-sharing agreements. Privacy anxieties also affect consumer willingness to opt-in, curbing data supply to the automotive data monetization market and forcing stakeholders to adopt privacy-preserving analytics such as differential privacy and on-device processing.
Lack of Standardized Data Taxonomy Across OEMs
Most manufacturers rely on proprietary data models, signal naming conventions, and communication protocols, which complicates third-party integration and reduces the attractiveness of cross-OEM datasets. Marketplace providers spend significant resources building translation layers that map signals from dozens of vehicle brands into unified schemas.[3]5G-META Project, “Monetisation of and Access to In-Vehicle Data and Resources,” arxiv.org The absence of common APIs particularly disadvantages smaller developers that cannot afford one-off integrations. Although initiatives like AUTOSAR Adaptive seek convergence, competitive concerns and legacy architecture inertia slow progress. Until interoperability improves, friction costs suppress demand growth within the automotive data monetization market.
*Our forecasts treat driver/restraint impacts as directional, not additive. The impact forecasts reflect baseline growth, mix effects, and variable interactions.
Segment Analysis
By Monetization Model: Direct Licensing Retains Control as Marketplaces Surge
Direct licensing held a 36.78% share of the automotive data monetization market in 2025 and remains the preferred path for OEMs that wish to safeguard customer relationships and pricing leverage. Contractual datasets covering location, diagnostics, and usage metrics are sold to insurers, fleets, and analytics vendors, yielding immediate cash flows. Over the forecast period, direct licensing still expands in absolute terms, yet its relative dominance erodes as revenue-sharing marketplaces accelerate. These platform operators bundle anonymized feeds from multiple brands, manage consent, and abstract technical complexities. As a result, revenue-sharing models are forecast to post a 26.62% CAGR, the fastest among all categories, reflecting rising buyer preference for aggregated, standardized, and compliant data access.
In parallel, subscription APIs monetize live streams on a recurring basis, enabling developers to embed real-time insights into mobility apps, navigation, and fleet dashboards. Advertising-driven schemes remain nascent but could unlock new value once in-cabin interfaces support contextually relevant content. Regulatory pushes for open access, notably the European Union Data Act, create tailwinds for marketplace approaches by limiting exclusive control. The automotive data monetization industry therefore transitions toward hybrid strategies where OEMs license premium datasets directly while simultaneously participating in shared-revenue exchanges for broader reach.


By Application: Insurance Dominance Meets Smart-City Momentum
Usage-based insurance commanded 41.64% of 2025 revenue, reflecting insurers’ rapid shift toward behavior-based underwriting. High-frequency telemetry enables fine-grained risk segmentation, which in turn reduces claims ratios and empowers tailored rewards for safer driving. Predictive maintenance followed as the second-largest field, drawing on vehicle-health signals to schedule service proactively and minimize downtime. Smart-city and infrastructure planning, though smaller today, exhibits the strongest growth at 27.68% CAGR, backed by government initiatives to alleviate congestion, curb emissions, and optimize public transport.
Fleet-management platforms integrate routing, driver scoring, and fuel-efficiency analytics, leveraging the same data streams to lower operating costs for commercial operators. In-vehicle commerce and advertising enter the picture as software-defined vehicles deliver personalized promotions based on location, trip context, and occupant preferences. Battery-health and vehicle-to-grid services emerge alongside the electrification trend, providing fresh datasets that diversify the revenue mix inside the automotive data monetization market.
By End User: OEM Leadership While Public Sector Adoption Accelerates
Automakers captured 32.15% of automotive data monetization market revenue in 2025. Their ownership of embedded connectivity, customer touchpoints, and after-sales networks affords privileged data access and multiple monetization vectors. Tier-1 suppliers monetize component-level information for predictive maintenance and product improvement, deepening collaboration up the value chain. Government and infrastructure agencies, however, represent the fastest-growing constituency at 28.6% CAGR. Urban planners monetize aggregated telemetry to map congestion hotspots, adjust traffic-light timings, and model emissions zones.
Insurance carriers widen their data appetite beyond actuarial uses to build proactive safety coaching, stolen-vehicle recovery, and claims automation. Fleet operators exploit route and driver performance insights to raise asset utilization and trim fuel bills. Cross-sector partnerships between public agencies and private platforms amplify end-user diversity, enlarging the total addressable pool for the automotive data monetization market.
By Data Type: Telematics Prevails as Battery Intelligence Accelerates
Telematics and vehicle-health parameters accounted for 38.96% of 2025 revenue. These encompass GPS location, diagnostic trouble codes, and usage metrics that underpin most insurance, maintenance, and fleet solutions. Infotainment and in-cabin interaction data sit in second place, covering media consumption, voice commands, and seat-adjustment patterns that enable personalized services and targeted advertising. Battery and powertrain analytics post the highest growth at 26.85% CAGR, propelled by electric-vehicle uptake and the imperative to monitor cell aging, optimize charging, and schedule second-life deployment.
Advanced driver-assistance and autonomous-sensor datasets are smaller but command premium pricing owing to their utility in HD mapping and algorithm validation. Synthetic data from digital-twin simulations begins to supplement scarce edge-case scenarios, broadening supply while reducing privacy exposure. Collectively, these categories reinforce the automotive data monetization market as a multi-dimensional opportunity set rather than a single-stream business.
Geography Analysis
North America remained the single largest region in 2025, with the automotive data monetization market size benefiting from widespread telematics installations, early usage-based insurance adoption, and pro-innovation data policies. State-level pilots in Michigan and California demonstrate real-time congestion-pricing models that rely on anonymized vehicle telemetry. OEM-insurer collaborations further entrench the region’s leadership by embedding consent mechanisms at vehicle purchase, which expedites data activation.
Europe sustained second position. The forthcoming EU Data Act mandates standardized APIs and defines B2B data-sharing obligations, creating predictable guardrails that may reduce fragmentation costs. German premium brands are already offering optional driving-data subscriptions compliant with the Act’s consent provisions. Public agencies tap aggregated datasets to refine low-emission zones and adjust traffic signals dynamically, signaling a shift from one-off research access toward recurring data services.
Asia Pacific’s fast growth stems from multiple national policies. China’s MIIT requires connected-vehicle data submissions to local servers, enabling city governments to procure traffic analytics. Japan’s Society 5.0 roadmap accelerates cross-industry data fusion, integrating mobility, energy, and commerce streams into citizen-centric platforms. India introduces mandatory AIS-140 telematics in commercial fleets, unlocking a new supply of standardized data. The rising supply aligns with a burgeoning developer ecosystem, collectively propelling the automotive data monetization market to its highest regional CAGR.

Competitive Landscape
The automotive data monetization market is moderately fragmented. No single participant commands more than one-third of global revenue, which limits pricing power and fuels collaboration. Traditional automakers leverage scale, vehicle access, and established brand trust, but they partner with cloud specialists for analytics and with platform aggregators for anonymized exchange. Intermediaries such as Dawex and Otonomo differentiate through consent management, schema harmonization, and privacy-preserving computation that lower onboarding friction for third-party data consumers.
Strategic moves emphasize ecosystem building. One leading European OEM integrates an energy-management company to bundle battery-health data with grid-balancing services, while a North American platform signs multi-year agreements with municipal agencies for traffic analytics sourced from connected vehicle fleets. Emerging players focus on synthetic data engines and edge-analytics modules that process signals on-device before forwarding derived insights, addressing privacy and bandwidth constraints.
Mergers and acquisitions remain selective. Valuations for data-centric assets corrected alongside broader tech multiples, encouraging acqui-hires over blockbuster deals. Vendors instead pursue minority investments and commercial alliances to secure pipeline access rather than outright control. Competitive intensity is therefore dictated more by speed of innovation and standard adoption than by consolidation. The projected rise in battery and ADAS data flows may, however, trigger a new wave of vertical integration among sensor suppliers, cloud hosts, and application developers by decade’s end.
Automotive Data Monetization Industry Leaders
Otonomo Technologies Ltd.
Wejo Group Limited
Continental AG
Harman International Industries Inc.
Stellantis N.V. (Mobilisights)
- *Disclaimer: Major Players sorted in no particular order


Recent Industry Developments
- February 2025: McKinsey analysis shows automotive M and A activity rests at a twenty-year low while acquirers rely on earn-outs and seller financing to bridge valuation gaps in data-platform deals.
- January 2025: Dawex introduces an automotive-specific data-exchange platform featuring consent orchestration and granular access controls tailored to global privacy regulations.
- December 2024: IBM Institute for Business Value survey of over 1,200 executives finds expectations for recurring digital revenue to climb from 15% to 51% by 2035, with autonomous-feature subscriptions forecast at USD 269 monthly per customer.
- October 2024: Alvarez and Marsal report highlights mid-year drop in automotive deal volumes, with strategics constituting 67% of transactions as companies consolidate around software and data analytics capabilities.


Global Automotive Data Monetization Market Report Scope
The automotive data monetization market is defined by the revenue generated from automotive data monetization software and solutions offered by major vendors.
The automotive data monetization market is segmented by geography (North America, Europe, Asia Pacific, and Rest of the World). The market size and forecasts are provided in terms of value (USD) for all the above segments.
| Direct Data Licensing |
| Subscription-Based Data Services |
| Revenue-Sharing Marketplaces |
| Advertising-Based Models |
| Usage-Based Insurance |
| Predictive Maintenance |
| Fleet Management and Optimization |
| In-Vehicle Advertising and Commerce |
| Smart City and Infrastructure Planning |
| Automotive OEMs |
| Tier-1 Suppliers |
| Insurance Companies |
| Fleet Operators and Mobility Providers |
| Government and Infrastructure Agencies |
| Telematics and Vehicle Health Data |
| Infotainment and In-Cabin Interaction Data |
| Powertrain and Battery Performance Data |
| ADAS and Autonomous Driving Sensor Data |
| North America | United States |
| Canada | |
| Mexico | |
| South America | Brazil |
| Argentina | |
| Rest of South America | |
| Europe | Germany |
| France | |
| United Kingdom | |
| Italy | |
| Spain | |
| Russia | |
| Rest of Europe | |
| Asia Pacific | China |
| Japan | |
| India | |
| South Korea | |
| Australia and New Zealand | |
| Southeast Asia | |
| Rest of Asia Pacific | |
| Middle East | Saudi Arabia |
| United Arab Emirates | |
| Turkey | |
| Rest of Middle East | |
| Africa | South Africa |
| Egypt | |
| Rest of Africa |
| Monetization Model | Direct Data Licensing | |
| Subscription-Based Data Services | ||
| Revenue-Sharing Marketplaces | ||
| Advertising-Based Models | ||
| Application | Usage-Based Insurance | |
| Predictive Maintenance | ||
| Fleet Management and Optimization | ||
| In-Vehicle Advertising and Commerce | ||
| Smart City and Infrastructure Planning | ||
| End User | Automotive OEMs | |
| Tier-1 Suppliers | ||
| Insurance Companies | ||
| Fleet Operators and Mobility Providers | ||
| Government and Infrastructure Agencies | ||
| Data Type | Telematics and Vehicle Health Data | |
| Infotainment and In-Cabin Interaction Data | ||
| Powertrain and Battery Performance Data | ||
| ADAS and Autonomous Driving Sensor Data | ||
| Geography | North America | United States |
| Canada | ||
| Mexico | ||
| South America | Brazil | |
| Argentina | ||
| Rest of South America | ||
| Europe | Germany | |
| France | ||
| United Kingdom | ||
| Italy | ||
| Spain | ||
| Russia | ||
| Rest of Europe | ||
| Asia Pacific | China | |
| Japan | ||
| India | ||
| South Korea | ||
| Australia and New Zealand | ||
| Southeast Asia | ||
| Rest of Asia Pacific | ||
| Middle East | Saudi Arabia | |
| United Arab Emirates | ||
| Turkey | ||
| Rest of Middle East | ||
| Africa | South Africa | |
| Egypt | ||
| Rest of Africa | ||


Key Questions Answered in the Report
What is the projected value of the automotive data monetization market in 2031?
Forecasts indicate expansion to USD 2.18 billion by 2031 on a 25.86% CAGR.
Which application currently brings in the most revenue?
Usage-based insurance leads, holding 41.64% of 2025 revenue.
Why are revenue-sharing marketplaces growing so quickly?
They lower integration costs, aggregate multi-brand data, and handle consent management, which fuels a 26.62% CAGR.
How do privacy regulations affect data monetization strategies?
Laws such as the GDPR and CCPA impose strict consent and security requirements, adding compliance costs and limiting data scope.
Which data type is gaining ground fastest with the rise of electric vehicles?
Battery and powertrain analytics, posting a 26.85% CAGR, are expanding due to the need for health monitoring and charging optimization.
Who are the fastest-growing end users of mobility data?
Government and infrastructure agencies, advancing at 28.6% CAGR as smart-city projects leverage vehicle telemetry.
Page last updated on:


