Automated Cell Culture Systems Market Size and Share
Market Overview
| Study Period | 2020 - 2031 |
|---|---|
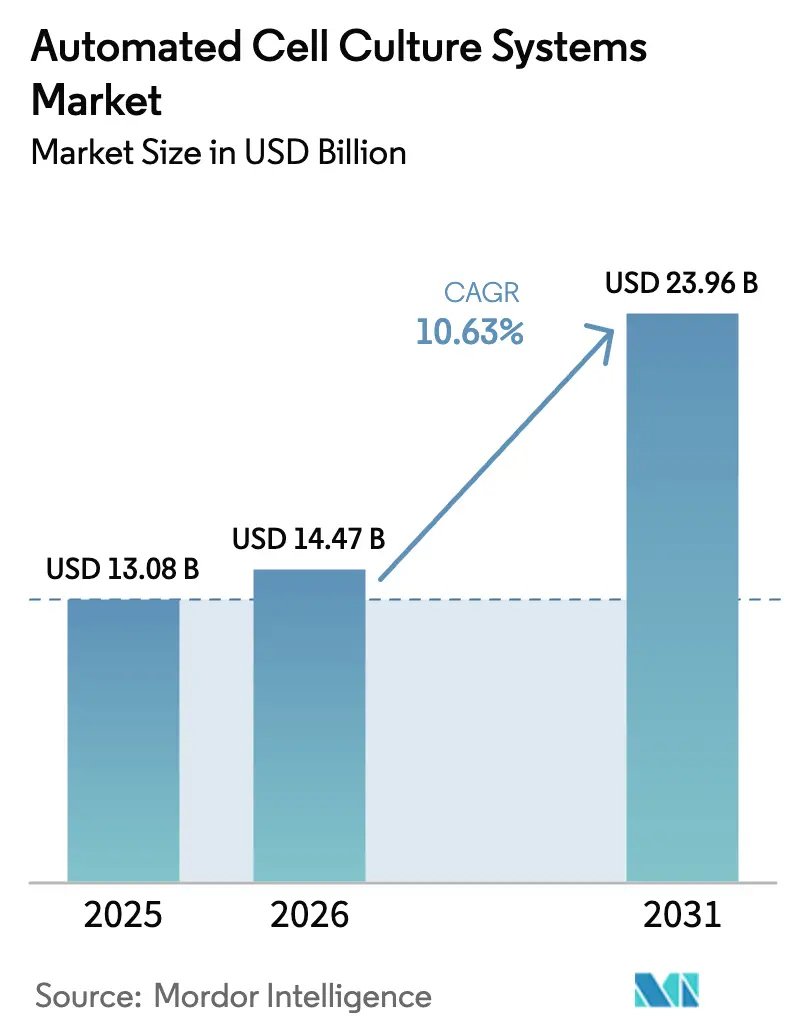
| Market Size (2026) | USD 14.47 Billion |
| Market Size (2031) | USD 23.96 Billion |
| Growth Rate (2026 - 2031) | 10.63% CAGR |
| Fastest Growing Market | Asia Pacific |
| Largest Market | North America |
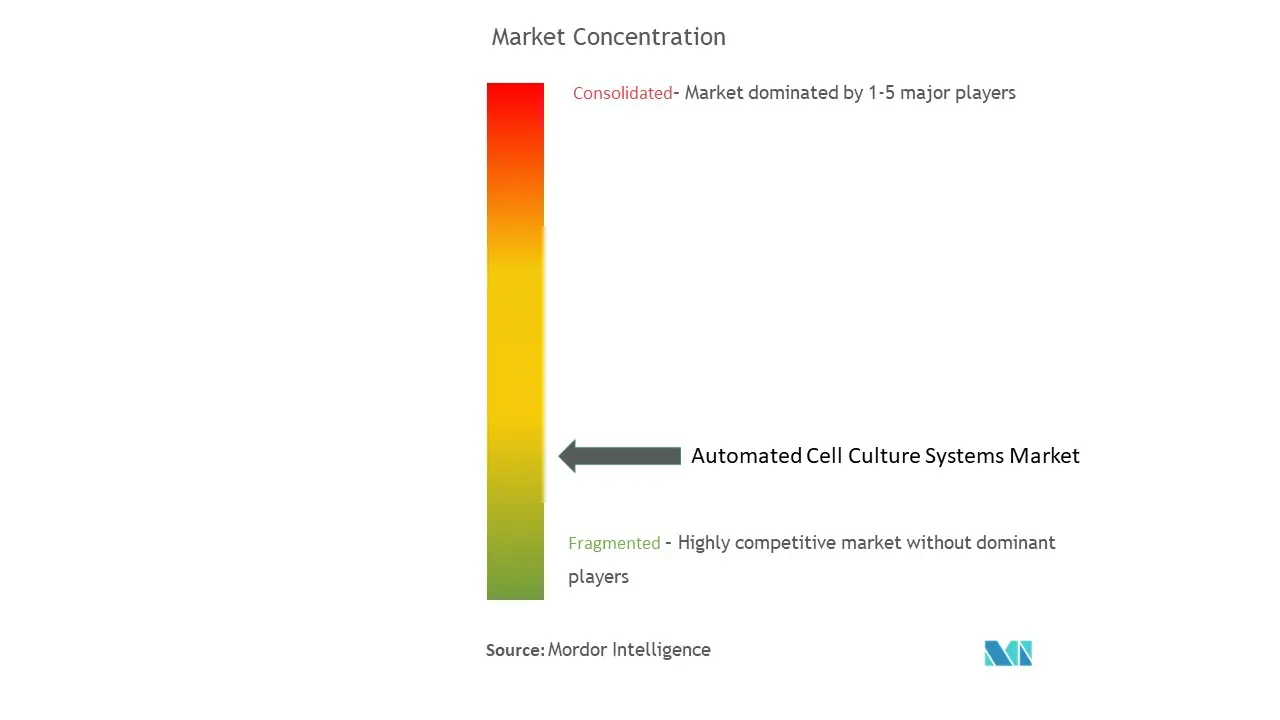
| Market Concentration | Low |
Major Players *Disclaimer: Major Players sorted in no particular order Image © Mordor Intelligence. Reuse requires attribution under CC BY 4.0. | |
Automated Cell Culture Systems Market Analysis by Mordor Intelligence
The automated cell culture systems market size in 2026 is estimated at USD 14.47 billion, growing from 2025 value of USD 13.08 billion with 2031 projections showing USD 23.96 billion, growing at 10.63% CAGR over 2026-2031. Increasing demand for scalable manufacturing of cell and gene therapies, regulatory encouragement for closed automated platforms, and steady advances in robotics and artificial intelligence are steering this growth. Industry participants are channeling capital toward multi-parallel bioreactor suites, modular liquid-handling workcells, and software that digitizes every step of good manufacturing practice (GMP) workflows. Strategic partnerships between large life-science suppliers and emerging automation specialists accelerate commercialization while lowering technical risk for therapy developers. At the same time, supply-chain pressures on single-use plastics and specialty media temper the pace of expansion but have not derailed capital commitments by biopharmaceutical companies.
Key Report Takeaways
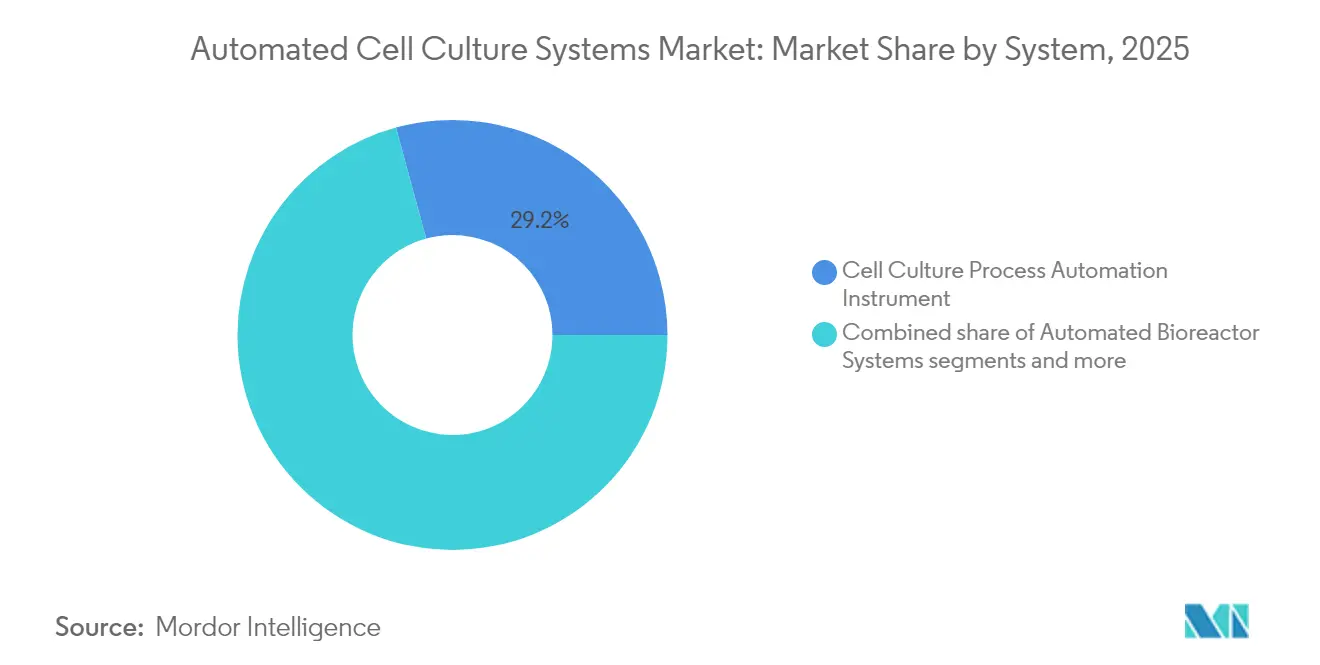
- By system, cell-culture process automation instruments held 29.24% of automated cell culture systems market share in 2025, while automated cell counters are advancing at an 11.29% CAGR through 2031.
- By cell-culture type, infinite cell lines commanded 65.18% share of automated cell culture systems market size in 2025 and are projected to grow at an 11.18% CAGR to 2031.
- By application, cancer research led with 40.25% revenue share in 2025, whereas drug development is forecast to expand at an 11.52% CAGR through 2031.
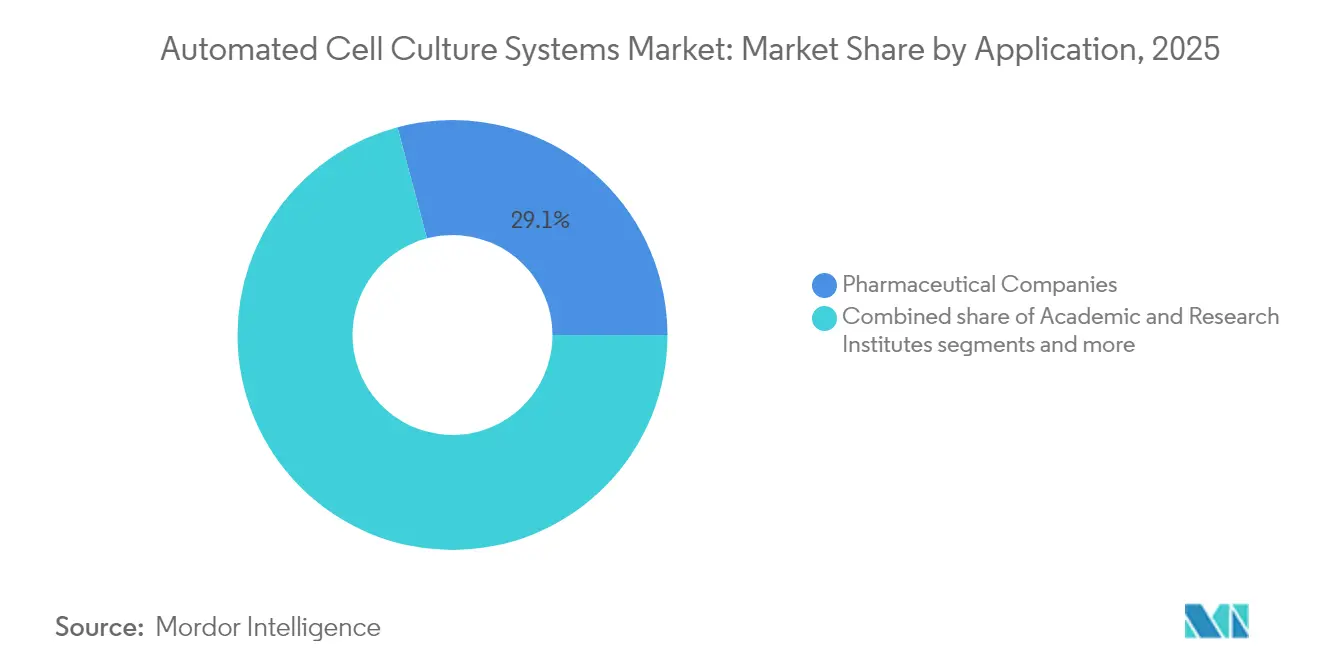
- By end user, pharmaceutical and biotechnology companies accounted for 29.12% share in 2025, while CDMOs are poised for the fastest 11.67% CAGR over the outlook period.
- North America dominated with 35.05% share in 2025; Asia-Pacific is the quickest-rising region, expanding at an 11.12% CAGR to 2031.
Note: Market size and forecast figures in this report are generated using Mordor Intelligence’s proprietary estimation framework, updated with the latest available data and insights as of 2026.
Global Automated Cell Culture Systems Market Trends and Insights
Drivers Impact Analysis*
| Driver | (~) % Impact on CAGR Forecast | Geographic Relevance | Impact Timeline |
|---|---|---|---|
| Rising demand for biopharmaceuticals & monoclonal antibodies | +2.8% | Global, with concentration in North America & EU | Medium term (2-4 years) |
| Expansion of cell & gene therapy pipelines | +3.2% | North America core, spill-over to APAC | Long term (≥ 4 years) |
| Need for process standardization & contamination-free manufacturing | +2.1% | Global | Short term (≤ 2 years) |
| Hospital-based decentralized manufacturing driving closed systems adoption | +1.9% | APAC core, expanding to MEA | Medium term (2-4 years) |
| AI-driven predictive maintenance improving bioreactor uptime | +1.5% | North America & EU, early adoption in APAC | Long term (≥ 4 years) |
| Regulatory push for single-use automated platforms to lower clean-room class | +2.3% | Global, with EU leading regulatory framework | Medium term (2-4 years) |
| Source: Mordor Intelligence | |||
Rising Demand for Biopharmaceuticals & Monoclonal Antibodies
Escalating global biologics consumption obliges manufacturers to move beyond manual flask-based work toward integrated, closed automated lines that reduce batch-to-batch variability. Lonza’s USD 1.2 billion acquisition of Roche’s Vacaville plant brings[1]Source: “Lonza Completes Acquisition of Large-Scale Biologics Site in Vacaville (US) from Roche,” lonza.com 330,000 L of bioreactor capacity under a unified automated control layer that synchronizes media prep, inoculation, harvest, and downstream filtration. Thermo Fisher Scientific and Sartorius extend multi-parallel bioreactor offerings to compress process-development timelines and raise clone-screening throughput. The FDA’s Advanced Manufacturing Technologies Designation Program finalized in 2025 incentivizes deployment of self-validating automation that delivers consistent critical quality attributes[2]Source: U.S. Food & Drug Administration, “Advanced Manufacturing Technologies Designation Program,” fda.gov . Together these forces underpin sustained equipment spending despite macroeconomic volatility.
Expansion of Cell & Gene Therapy Pipelines
Commercialization of autologous and allogeneic therapies creates unprecedented pressure on cleanroom capacity that manual techniques cannot satisfy. Cellares’ Cell Shuttle platform can produce 40,000 therapy batches a year within a single modular chassis, reducing operator touchpoints by 90%. Clinical developers such as Cabaletta Bio and Bristol Myers Squibb are moving projects onto these closed robotic systems to shorten vein-to-vein times and expand patient access. In parallel, AGC Biologics is building a fully automated CGT line in Japan, scheduled to reach full capacity by 2026. These investments reinforce the long-term growth outlook for automated cell culture systems market.
Need for Process Standardization & Contamination-Free Manufacturing
EMA’s revised GMP Annex 1 elevates contamination-control requirements, pushing manufacturers toward vaporized-hydrogen-peroxide isolators and robotic pipettors that limit human access to critical zones. Likewise, FDA Q5A(R2) viral-safety guidance highlights the necessity for fully documented, auditable upstream workflows. Automated environmental-monitoring modules integrated with supervisory control and data acquisition (SCADA) software provide continuous data streams that speed deviation investigations and facilitate lot release.
Hospital-Based Decentralized Manufacturing
Clinics are retrofitting ISO-7 suites with self-contained “GMP-in-a-box” units that orchestrate cell isolation, expansion, harvest, and final formulation inside a suitcase-sized enclosure. This configuration cuts logistics time, lowers shipping risk, and preserves cell viability, especially for autologous therapies where every hour counts. Early projects in Japan and Singapore demonstrate how closed automated loops fit within hospital infrastructure while satisfying regulators’ electronic-record requirements.
Restraints Impact Analysis*
| Restraint | (~) % Impact on CAGR Forecast | Geographic Relevance | Impact Timeline |
|---|---|---|---|
| High capital expenditure of integrated systems | -1.8% | Global, with higher impact in emerging markets | Short term (≤ 2 years) |
| Shortage of skilled automation engineers | -1.4% | North America & EU, spreading to APAC | Medium term (2-4 years) |
| Cyber-security risks in connected culture platforms | -1.1% | Global, with higher concern in North America & EU | Medium term (2-4 years) |
| Lack of data-format standards limiting interoperability | -0.9% | Global | Long term (≥ 4 years) |
| Source: Mordor Intelligence | |||
High Capital Expenditure of Integrated Systems
Turnkey automated suites cost USD 2–5 million, a threshold that challenges emerging biotechs and public hospitals operating under constrained budgets. Despite a two-to-three-year payback from lower labor expenses, financing delays have forced several early-stage CDMOs, including AmplifyBio, to curtail operations in 2025. Government grant programs and vendor-backed leasing options partially mitigate the barrier but do not eliminate it.
Shortage of Skilled Automation Engineers
Operating and validating complex robotic lines requires cross-disciplinary talent conversant in cell biology, software scripting, and GMP quality documentation. Industry surveys reveal six-month hiring lead times for senior automation engineers, forcing firms to delay facility start-up or rely on expensive consultants. Large-language-model agents, exemplified by the BioMARS project, promise to automate troubleshooting tasks and shrink the skills gap over the medium term.
*Our forecasts treat driver/restraint impacts as directional, not additive. The impact forecasts reflect baseline growth, mix effects, and variable interactions.
Segment Analysis
By System: Automation Drives Efficiency Across Platform Components
Automated cell culture systems market size for cell-culture process automation instruments hit USD 3.83 billion in 2025, translating to a 29.24% slice of overall revenue. Growing preference for unified supervisory software that links inoculum expansion, seed train, and production bioreactors underpins this leadership. These master controllers synchronize media make-up, pH adjustments, and perfusion-rate modifications in real time, eliminating latency common in manual interventions and driving consistent product titers.
Automated cell counters are projected to secure an 11.29% CAGR, fastest among system types, as multicolor fluorescence imaging and AI-based confluence analysis compress time-to-result from minutes to seconds. Vendors bundle counters with disposable slide cartridges that integrate seamlessly into upstream automation lines, creating incremental hardware pull-through. Supporting software and robotics continue to attract venture funding as developers focus on plug-and-play modules compatible with existing incubators and biosafety cabinets, broadening addressable markets beyond greenfield facilities.


By Cell Culture Type: Infinite Lines Dominate Commercial Applications
Infinite cell lines captured 65.18% of automated cell culture systems market share in 2025, buoyed by their ability to proliferate indefinitely without senescence. Chinese hamster ovary (CHO) and HEK-293 derivatives remain workhorse hosts for monoclonal antibody and viral-vector production. Automation platforms excel at maintaining stringent temperature, dissolved-oxygen, and osmolality parameters essential for high-titer expression. The segment’s 11.18% CAGR is bolstered by regulatory confidence in long-characterized master cell banks, which simplifies comparability studies when process upgrades occur.
Finite or primary cultures, while smaller in revenue, hold strategic relevance for autologous therapies, personalized vaccines, and regenerative medicine. Automated microfluidic chips developed at MIT achieve 30–40% cycle-time reductions, demonstrating that primary-cell scale-up can also benefit from closed robotic handling. Still, the limited lifespan of finite cells demands flexible scheduling algorithms inside manufacturing execution software to avoid resource bottlenecks.
By Application: Drug Development Accelerates Beyond Cancer Research
Cancer research retained the top revenue position at 40.25% in 2025, reflecting the high volume of cell-based assays needed for oncology pipeline decisions. Yet drug-development screening workflows will post the quickest 11.52% CAGR as pharmaceutical firms deploy miniaturized 3-D spheroid models and high-content imaging to lower attrition rates earlier in discovery. Internet-of-Things architectures capable of running thousands of parallel experiments illustrate how automation extends beyond production into basic research.
Cell and gene therapy manufacturing continues to attract capital, aided by FDA guidance that allows accelerated pathways for technologies demonstrating robust process control. Regenerative medicine labs pair automated stirred-tank reactors with induced pluripotent stem cell (iPSC) workflows that preserve pluripotency markers during scale-up. Tissue-engineering teams integrate 3-D bioprinters with automated cell dispensers to fabricate vascularized constructs at higher reproducibility than manual pipetting permits.
By End User: CDMOs Emerge as Growth Leaders Despite Pharma Dominance
Pharmaceutical and biotechnology companies controlled 29.12% of automated cell culture systems market size in 2025 owing to broad in-house discovery pipelines. However, CDMOs will outpace at an 11.67% CAGR as sponsors outsource complex manufacturing to organizations that amortize capital across multiple clients. Avid Bioservices’ USD 1.1 billion acquisition by private equity underscores investor appetite for automation-heavy CDMOs.
Academic institutes adopt mid-scale robotic incubators to harmonize protocols across multiple labs, raising reproducibility metrics. Hospitals integrating point-of-care systems aim to deliver individualized therapies without cross-continental logistics, aided by vendor-supplied electronic batch-record templates that satisfy 21 CFR Part 11 mandates.
Geography Analysis
North America accounted for 35.05% of revenue in 2025 thanks to dense biopharmaceutical R&D clusters, predictable regulatory pathways, and sizable venture funding pools. U.S. facilities employ multi-parallel bioreactors across early-stage projects to screen clones under varying perfusion regimes, while Canadian CDMOs expand viral-vector capacity to serve domestic gene-therapy trials.
Europe follows closely, propelled by the EMA’s harmonized GMP frameworks that streamline cross-border product release. Germany and Switzerland host global automation suppliers that co-locate manufacturing plants for single-use sensors and tubing, strengthening the regional supply chain. Demand for sustainable, animal-origin-free media formulations spurs upgrades to control software capable of fine-tuning amino-acid feeds.
Asia-Pacific is the fastest-growing territory, rising at an 11.12% CAGR through 2031 as governments subsidize biomanufacturing infrastructure to reduce import dependence. China’s science parks assemble vertically integrated automation ecosystems, while Japan’s regulatory nod to decentralized “hospital factory” models catalyzes new installations. South Korea extends tax rebates to companies purchasing locally produced robotic pipettors, tightening regional competition.
Latin America and Middle East & Africa remain nascent but are witnessing pilot projects linked to multinational vaccine technology-transfer initiatives. Brazilian public-private partnerships invest in automated cell arrester modules for adenovirus-based vaccines, laying groundwork for broader adoption. Gulf Cooperation Council states earmark budget for stem-cell centers equipped with closed expansion systems designed for high ambient temperatures, demonstrating region-specific engineering adaptations.


Competitive Landscape
The automated cell culture systems market exhibits moderate consolidation, with the top five suppliers controlling roughly 45% of global revenue. Thermo Fisher Scientific leverages a USD 42.9 billion revenue base and broad consumable catalog to cross-sell automation hardware into existing customer labs. Sartorius and Danaher emphasize modularity, offering stackable bioreactors and AI-enabled software that retrofit into legacy suites without extended downtime.
Partnerships reshape competition: Cytiva teams with Cellular Origins to link Sefia closed-system washers to Constellation robotics, yielding a walk-away CGT platform approved under the FDA’s advanced-manufacturing designation. Lonza collaborates with startup NanoEntek on microfluidic cartridges that miniaturize stem-cell expansion, targeting regenerative-medicine innovators. Disruptive entrants such as Cellares pursue an integrated-development-and-manufacturing-organization (IDMO) model, pairing hardware sales with turnkey production services that circumvent buyers’ capital constraints.
Product differentiation now revolves around embedded analytics and remote-support offerings. Vendors bundle service contracts that include cloud dashboards tracking sensor drift, filter pressure, and glucose uptake, enabling proactive spare-part shipments and minimizing unplanned outages. Green-design considerations emerge as a differentiator: single-use bag suppliers experiment with bio-based polyethylene to curb scope-3 emissions, aligning with pharmaceutical clients’ carbon-neutral goals.
Automated Cell Culture Systems Industry Leaders
Danaher (Beckman Coulter, Inc., Cytiva)
Thermo Fisher Scientific Inc.
Hitachi, Ltd.
Becton, Dickinson and Company (BD)
Sartorius AG
- *Disclaimer: Major Players sorted in no particular order

Recent Industry Developments
- August 2025: Sartorius partnered with Nanotein Technologies to co-develop automation modules that improve T-cell activation efficiency in cell-therapy manufacturing
- March 2025: Cellares and Cabaletta Bio completed technology-adoption trials for Rese-cel on the Cell Shuttle robotic platform, achieving consistent batch-release metrics at commercial scale.


Global Automated Cell Culture Systems Market Report Scope
Automated cell culture systems are specialized laboratory equipment and setups designed to automate the process of growing and maintaining cell cultures.
The automated cell culture systems market is segmented into products, cell culture types, applications, end users, and geography. The market is segmented by product into cell culture process automation instruments, automated bioreactors, automated cell culture media exchange systems, automated culture media analyzers, automated cell counters, and others. By cell culture types, the market is segmented into finite cell line cultures and infinite cell line cultures. The market is segmented by application into cancer research, drug development, stem cell research, regenerative medicine, and cell therapy. By end user, the market is segmented into pharmaceutical companies, biotechnology companies, CDMOs/CMOs, research organizations, academic institutes, and hospitals providing cell therapy/regenerative medicine. The market is segmented by geography into North America, Europe, Asia-Pacific, the Middle East and Africa, and South America. The report offers the value (USD) for the above segments.
| Automated Bioreactor Systems |
| Automated Cell Culture Vessels & Reactors |
| Automated Liquid-Handling/Seeding Systems |
| Automated Cell Harvesters |
| Monitoring & Control Modules |
| Supporting Software & Robotics |
| Finite Cell Line Cultures |
| Infinite Cell Line Cultures |
| Biopharmaceutical Production |
| Cell & Gene Therapy Manufacturing |
| Stem-Cell Research |
| Regenerative Medicine |
| Drug Discovery & High-Throughput Screening |
| Tissue Engineering & 3-D Culture |
| Pharmaceutical & Biotechnology Companies |
| CDMOs & CMOs |
| Academic & Research Institutes |
| Hospitals & Diagnostic Laboratories |
| Others (CROs, Government Labs) |
| North America | United States |
| Canada | |
| Mexico | |
| Europe | Germany |
| United Kingdom | |
| France | |
| Italy | |
| Spain | |
| Rest of Europe | |
| Asia-Pacific | China |
| India | |
| Japan | |
| South Korea | |
| Australia | |
| Rest of Asia-Pacific | |
| South America | Brazil |
| Argentina | |
| Rest of South America | |
| Middle East and Africa | GCC |
| South Africa | |
| Rest of Middle East and Africa |
| By System | Automated Bioreactor Systems | |
| Automated Cell Culture Vessels & Reactors | ||
| Automated Liquid-Handling/Seeding Systems | ||
| Automated Cell Harvesters | ||
| Monitoring & Control Modules | ||
| Supporting Software & Robotics | ||
| By Cell Culture Type | Finite Cell Line Cultures | |
| Infinite Cell Line Cultures | ||
| By Application | Biopharmaceutical Production | |
| Cell & Gene Therapy Manufacturing | ||
| Stem-Cell Research | ||
| Regenerative Medicine | ||
| Drug Discovery & High-Throughput Screening | ||
| Tissue Engineering & 3-D Culture | ||
| By End User | Pharmaceutical & Biotechnology Companies | |
| CDMOs & CMOs | ||
| Academic & Research Institutes | ||
| Hospitals & Diagnostic Laboratories | ||
| Others (CROs, Government Labs) | ||
| By Geography | North America | United States |
| Canada | ||
| Mexico | ||
| Europe | Germany | |
| United Kingdom | ||
| France | ||
| Italy | ||
| Spain | ||
| Rest of Europe | ||
| Asia-Pacific | China | |
| India | ||
| Japan | ||
| South Korea | ||
| Australia | ||
| Rest of Asia-Pacific | ||
| South America | Brazil | |
| Argentina | ||
| Rest of South America | ||
| Middle East and Africa | GCC | |
| South Africa | ||
| Rest of Middle East and Africa | ||


Key Questions Answered in the Report
How large is the automated cell culture systems market in 2026?
It reached USD 14.47 billion in 2026 and is set to grow at a 10.63% CAGR through 2031.
Which region is growing fastest for automated cell culture technologies?
Asia-Pacific is expanding at an 11.12% CAGR due to aggressive government investment and new CGT facilities.
What system type is expanding most quickly?
Automated cell counters show the highest 11.29% CAGR thanks to AI-enabled image analysis.
Why are CDMOs investing heavily in automation?
Outsourced manufacturers amortize high capital costs across multiple clients, driving an 11.67% CAGR in CDMO adoption.
How are regulators encouraging automated platforms?
FDA's Advanced Manufacturing Technologies Designation Program offers priority review and dialog for products manufactured on qualified automated systems.
Page last updated on:


