Cell Line Development Market Size and Share
Market Overview
| Study Period | 2020 - 2031 |
|---|---|
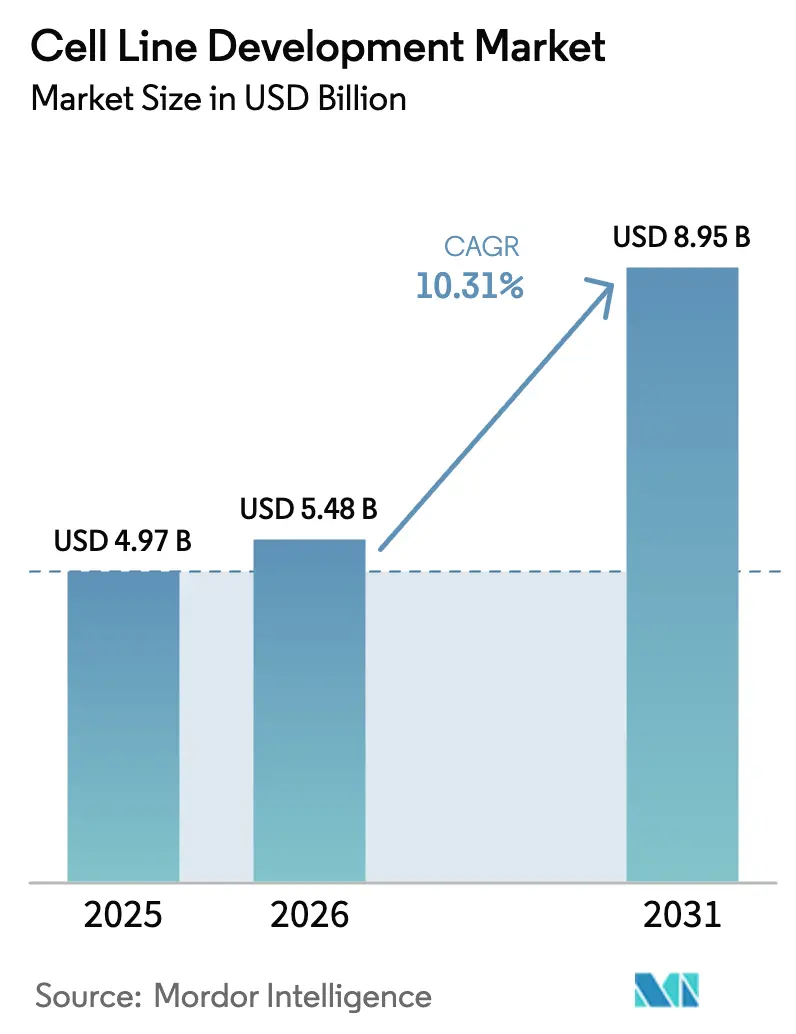
| Market Size (2026) | USD 5.48 Billion |
| Market Size (2031) | USD 8.95 Billion |
| Growth Rate (2026 - 2031) | 10.31% CAGR |
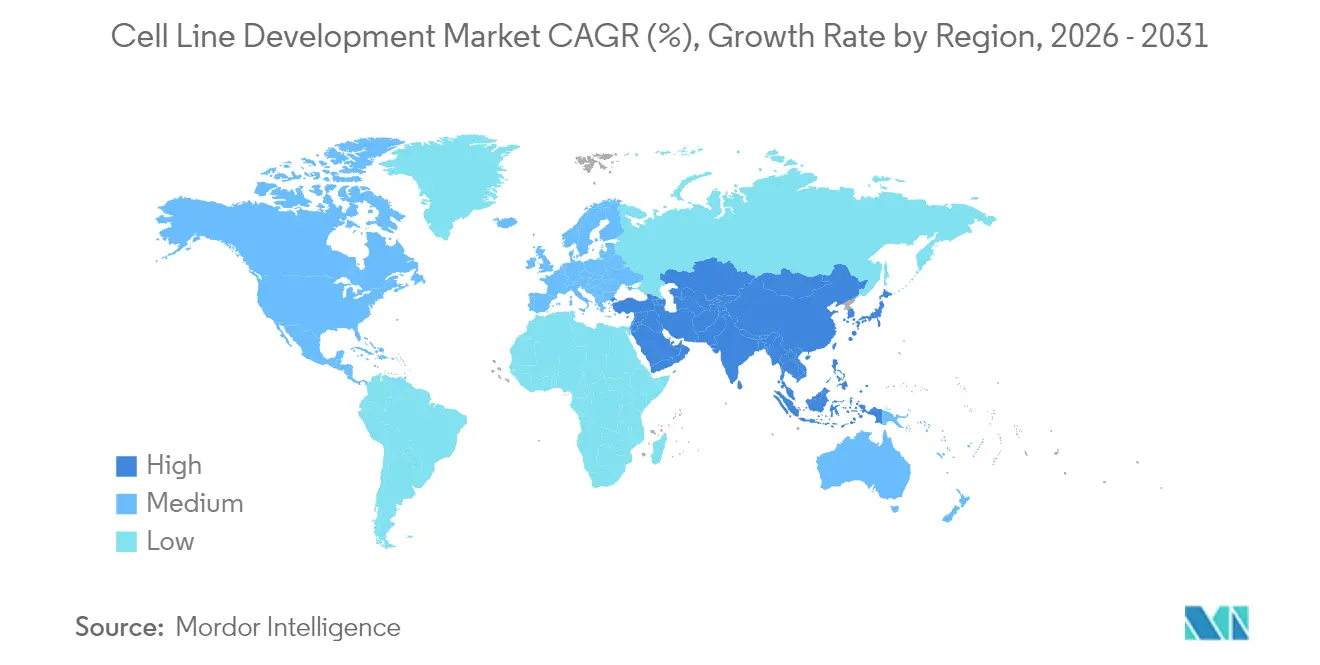
| Fastest Growing Market | Asia-Pacific |
| Largest Market | North America |
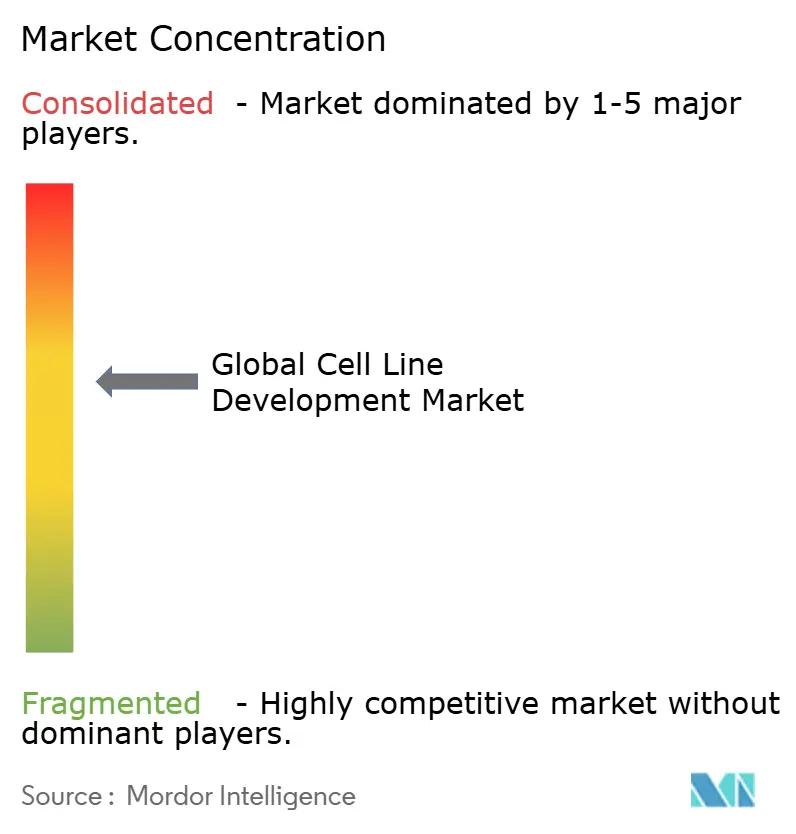
| Market Concentration | Medium |
Major Players *Disclaimer: Major Players sorted in no particular order Image © Mordor Intelligence. Reuse requires attribution under CC BY 4.0. | |
Cell Line Development Market Analysis by Mordor Intelligence
The Cell Line Development Market size is expected to grow from USD 4.97 billion in 2025 to USD 5.48 billion in 2026 and is forecast to reach USD 8.95 billion by 2031 at 10.31% CAGR over 2026-2031.
Expanding demand for biologics, which accounted for more than 40% of 2024 drug approvals, anchors this growth as complex proteins, monoclonal antibodies, and gene therapies all require highly engineered cell lines for commercial-scale production. Heightened capital expenditure on continuous bioprocessing, an accelerating shift toward outsourcing, and the advent of AI-guided optimization platforms have already shortened development cycles from 6-9 months to 3-4 months, giving first movers a tangible competitive edge. Regulatory reforms that favor risk-based viral safety evaluations create both compliance costs and quality incentives, while geopolitical tensions encourage regional manufacturing clusters that reduce exposure to single-country supply risks. Taken together, these structural forces reinforce the central role that the cell line development market will play in delivering the next wave of biologics.
Key Report Takeaways
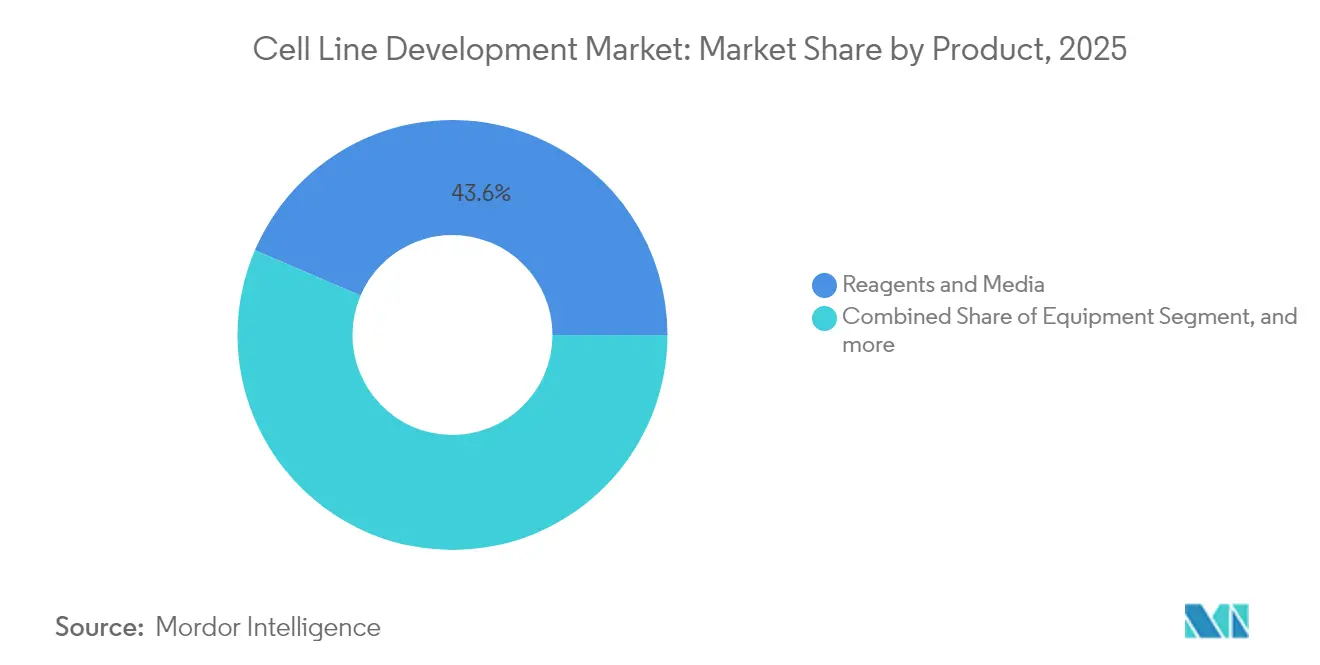
- By product, reagents and media led with 43.55% revenue share in 2025, whereas equipment is projected to grow fastest at a 10.78% CAGR through 2031.
- By source, mammalian platforms captured 74.62% of cell line development market share in 2025, while non-mammalian systems display an 10.91% CAGR over the forecast period.
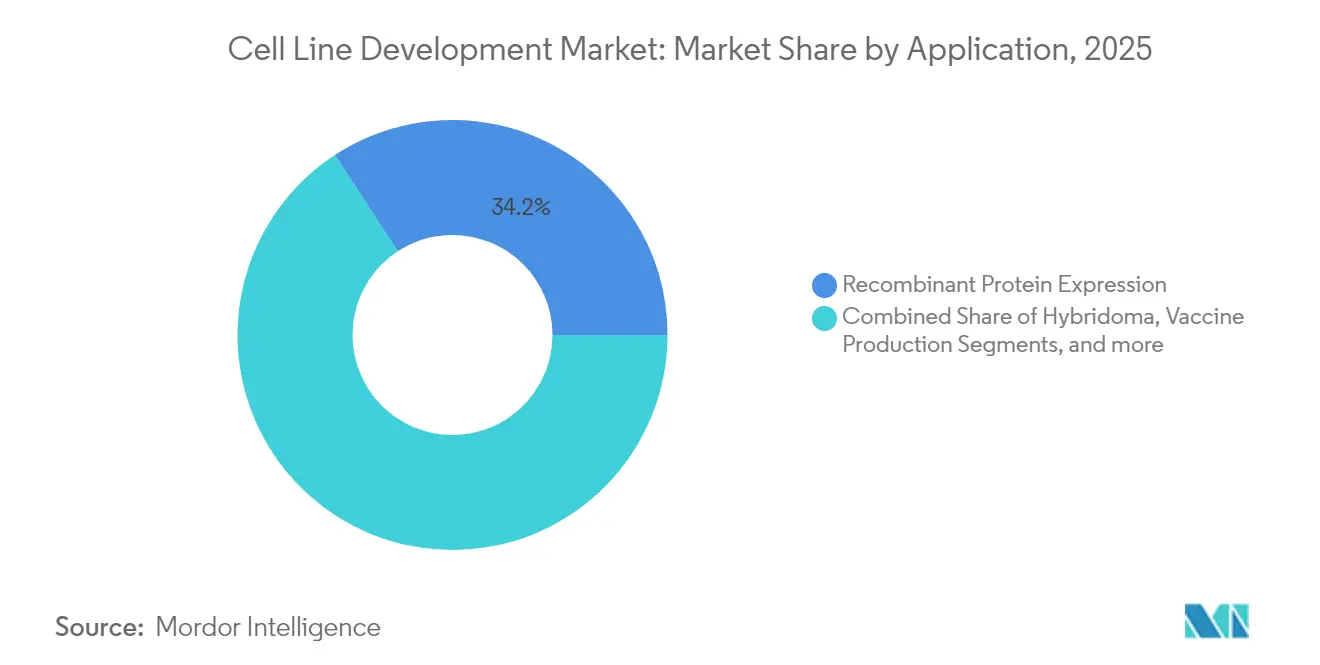
- By application, recombinant protein expression held 34.22% share of the cell line development market size in 2025; gene and cell therapy manufacturing is expanding at an 10.88% CAGR to 2031.
- By end user, biopharma and pharma companies commanded 48.92% of revenue in 2025, yet CDMOs are advancing at an 11.17% CAGR and will narrow the gap by 2031.
- By geography, North America maintained 39.88% share in 2025, while Asia-Pacific is forecast to post the highest regional CAGR at 10.96%.
Note: Market size and forecast figures in this report are generated using Mordor Intelligence’s proprietary estimation framework, updated with the latest available data and insights as of 2026.
Market Trends and Insights
Drivers Impact Analysis of Cell Line Development Market*
| Driver | (~) % Impact on CAGR Forecast | Geographic Relevance | Impact Timeline |
|---|---|---|---|
| Growing biopharmaceutical demand | +2.8% | Global, concentrated in North America and EU | Medium term (2-4 years) |
| Expansion of monoclonal antibody pipelines | +2.1% | Global, led by North America, expanding to APAC | Long term (≥ 4 years) |
| CAPEX race for continuous bioprocessing infrastructure | +1.9% | North America and EU, emerging in APAC | Medium term (2-4 years) |
| AI-guided cell-line optimisation platforms | +1.4% | Global, early adoption in North America and EU | Short term (≤ 2 years) |
| Rise of regional bio-CDMO clusters in MENA & ASEAN | +1.1% | MENA & ASEAN, with spill-over effects globally | Long term (≥ 4 years) |
| Surge in biosimilar production post-patent cliff | +0.9% | APAC core, spill-over to MEA and Latin America | Short term (≤ 2 years) |
| Source: Mordor Intelligence | |||
Growing Biopharmaceutical Demand
Monoclonal antibodies already dominate biologic pipelines, and their growth into autoimmune and rare disease indications sustains pressure on cell line productivity. Over 200 antibody therapeutics are approved, with nearly 1,400 candidates in active development, forcing sponsors to secure robust, high-yielding cell lines early in clinical programs. The cell line development market therefore functions as a strategic bottleneck that largely dictates overall project timelines and commercial viability. Rising volumes of bispecific antibodies and antibody-drug conjugates require engineered cell lines capable of balanced chain expression, driving premium pricing for specialized development services. Across every major geography, large molecules now receive preferential investment over small molecules, cementing long-term demand for sophisticated cell culture systems.
Expansion of Monoclonal Antibody Pipelines
Clinical approvals of bispecific antibodies since 2020 highlight the shift toward dual-target formats, which double the complexity of cell engineering workflows. Pharmaceutical majors continue to finance dedicated facilities, such as AstraZeneca’s USD 1.5 billion Singapore site, to secure end-to-end antibody-drug conjugate production capacity. As each novel antibody format carries unique folding and glycosylation needs, sponsors increasingly favor proprietary cell platforms that can be locked into long-term supply agreements. Those dynamics intensify the competitive race within the cell line development market, particularly for service providers that offer turnkey engineering plus downstream analytics[1]AstraZeneca, “AstraZeneca to build end-to-end ADC facility in Singapore,” astrazeneca.com.
CAPEX Race for Continuous Bioprocessing Infrastructure
Investments exceeding USD 8 billion at firms like Fujifilm Diosynth underscore momentum toward perfusion and continuous chromatography, which deliver 2-3-fold productivity gains while reducing buffer consumption. Suppliers of intensive process analytics and high-density cell retention devices are experiencing rapid order backlogs, and early adopters report 30-70% capital savings in scaled facilities. Cell lines used in continuous operations must sustain productivity over extended culture durations, elevating the premium on genetic stability traits. These requirements push technology providers to integrate real-time data analytics that predict metabolic drift, thereby reinforcing the cell line development market’s link to Industry 4.0 manufacturing goals.
AI-Guided Cell-Line Optimisation Platforms
Machine-learning models that correlate multi-omics datasets with phenotypic outputs can now recommend specific gene edits and media formulations that yield higher titers in silico. Early adopters claim a 40% reduction in laboratory experimentation time and a 20% boost in peak productivity. Large biopharma firms pursue build-versus-buy analyses to determine whether to license external software or develop proprietary models, while venture-backed startups position themselves as data-rich service partners. These platforms reinforce the value proposition of the cell line development market by compressing development timelines and mitigating costly dead-ends.
Restraints Impact Analysis of Cell Line Development Market*
| Restraint | (~) % Impact on CAGR Forecast | Geographic Relevance | Impact Timeline |
|---|---|---|---|
| Stringent regulatory compliance | -1.8% | Global, most stringent in North America and EU | Long term (≥ 4 years) |
| Shortage of cGMP-grade raw-material supply chains | -1.5% | Global, acute in emerging markets | Short term (≤ 2 years) |
| Lengthy cell-line stability timelines | -1.2% | Global, with regional variations in requirements | Medium term (2-4 years) |
| Geopolitical export-control risks for CHO/HEK cell lines | -0.9% | US-China trade corridors, spill-over globally | Medium term (2-4 years) |
| Source: Mordor Intelligence | |||
Stringent Regulatory Compliance
The FDA’s updated Q5A(R2) guidance on viral safety requires extended characterization studies, adding up to one year of additional testing for new cell substrates. Companies lacking in-house regulatory expertise must absorb higher consulting fees and possible rework if submissions fall short of evolving standards. Divergent regional expectations complicate global launch sequencing, as Europe often requests supplementary adventitious-agent screens not demanded elsewhere. These pressures raise the fixed costs of operating in the cell line development market and may lead smaller firms to exit or consolidate, shifting bargaining power toward large, vertically integrated providers[2]U.S. Food and Drug Administration, “Viral Safety Evaluation of Biotechnology Products Derived From Cell Lines,” fda.gov.
Shortage of cGMP-Grade Raw-Material Supply Chains
Declines in U.S. cattle herds have already reduced fetal bovine serum availability, forcing many developers to qualify multiple suppliers and expand inventories. Lead times for specialty media components now stretch several months, delaying upstream process development and inflating working capital requirements. Some producers respond by shifting to chemically defined, animal-origin-free formulations; however, that transition can require re-optimising entire cell culture processes. Supply chain uncertainty, therefore, tempers otherwise strong growth prospects for the cell line development market in regions where logistics remain fragile[3]Corning Life Sciences, “Market Alert on Serum Supply,” corning.com.
*Our forecasts treat driver/restraint impacts as directional, not additive. The impact forecasts reflect baseline growth, mix effects, and variable interactions.
Cell Line Development Market Segment Analysis
By Product:
Reagents Anchor Consumable DemandReagents and media represented 43.55% of 2025 revenue, as every production lot consumes large volumes of culture medium, feed, and buffer. The segment’s 10.64% forecast CAGR exceeds that of capital equipment because each new therapy approval scales recurring consumable orders, ensuring predictable demand within the broader cell line development market. Suppliers prioritize chemically defined and serum-free formulations that improve batch consistency while reducing contamination risks, and AI-enabled design tools optimize nutrient blends to lift peak titers. Equipment, which covers bioreactors and automated cell-handling systems, remains crucial because rising cell densities require precise process control to avoid nutrient depletion and waste accumulation. Ancillary services, such as cell banking, analytical testing, and viral clearance studies, round out a growing long-tail category that benefits from heightened regulatory scrutiny.
The reagents category further benefits from subscription-like purchasing patterns, as bioreactors continuously draw feed components during extended perfusion runs. Specialized vendors now market modular media kits tailored to CRISPR-engineered cell lines that exhibit unique metabolic footprints. As process intensification expands, demand for high-purity raw materials will escalate, encouraging suppliers to vertically integrate amino-acid and vitamin production. Collectively, these trends consolidate the competitive importance of consumables within the cell line development market, tightening linkages between media innovation and overall facility output.


By Source:
Mammalian Platforms Dominate Commercial OutputMammalian lines controlled 74.62% of cell line development market share in 2025, and their 10.42% CAGR underscores sustained preference for human-like post-translational modifications. Chinese hamster ovary cells remain the gold standard for monoclonal antibodies, while CRISPR knockouts that delete key glycosylation genes deliver more homogeneous glycoforms with reduced immunogenicity. Human embryonic kidney (HEK293) lines, optimized for suspension growth, underpin most adeno-associated viral vector production for gene therapies and now contribute meaningful revenue to the cell line development market size for viral applications. Non-mammalian systems, including yeast and insect lines, address niche enzyme and vaccine applications where complex glycosylation is unnecessary.
Advances in high-throughput microfluidic screening enable the rapid isolation of top-producing mammalian clones, cutting weeks from traditional limiting dilution campaigns. Novel genomic instability sensors track chromosomal aberrations in real time, allowing early culling of unstable clones. Bacterial and yeast systems still excel for simple protein products, although their overall growth lags mammalian gains. That technology mix ensures that the cell line development market maintains a diverse toolbox capable of matching specific molecular requirements with the most cost-effective cellular chassis.
By Application:
Gene Therapy Manufacturing AcceleratesRecombinant protein expression retained 34.22% of 2025 revenue as monoclonal antibodies and fusion proteins continue to dominate commercial pipelines. Yet gene and cell therapy manufacturing grows at 10.88% CAGR, buoyed by eight FDA approvals in 2024 alone, and is poised to claim larger slices of the cell line development market by 2031. Viral vector titers have already improved twofold through HEK293 and Sf9-based suspension platforms, while automation shortens CAR-T cell expansion from 21 days to 14-17 days. Hybridoma applications remain relevant for discovery campaigns that feed antibody pipelines, and vaccine developers explore Vero-derived suspension lines that match yield improvements achieved in adherent culture.
Growing clinical demand for autologous cell therapies also spurs investment in closed-system manufacturing hardware that reduces operator exposure. That shift compels developers to co-optimize cell line performance with bioreactor configuration, reinforcing the integrated nature of process and product design in the cell line development industry. Over the forecast horizon, regulators anticipate 10-20 new gene and cell therapy approvals annually, amplifying the strategic value of specialized vector-producing cell banks and associated analytics.
By End User:
CDMOs Capture Outsourced GrowthBiopharma and pharma sponsors accounted for 48.92% of 2025 demand, reflecting in-house programs at top-tier innovators. Even so, CDMOs post the fastest 11.17% CAGR as sponsors seek flexibility amid uncertain clinical outcomes and fluctuating capacity requirements. Samsung Biologics now operates 784,000 L of capacity, and Fujifilm Diosynth’s USD 8 billion expansion plan demonstrates sustained confidence in outsourced growth. Academic and research institutes contribute discovery-stage cell lines, often partnering with commercial entities to translate basic science into clinical candidates. Startups and diagnostic firms make up a small but rising customer class as cell-based assays gain traction.
For CDMOs, differentiation hinges on speed, proven regulatory track records, and the ability to integrate digital twins that predict batch outcomes. Sponsors value seamless tech-transfer pathways that minimize validation downtime and preserve regulatory documentation. The outsourcing wave therefore tightens strategic partnerships within the cell line development market, while simultaneously pushing providers to extend service portfolios from clone selection to commercial fill-finish.
Geography Analysis
North America Cell Line Development Market
North America maintained 39.88% revenue share in 2025, buoyed by large-scale investments such as Eli Lilly’s USD 9 billion Indiana complex and Novo Nordisk’s USD 4.1 billion North Carolina expansion. The region benefits from entrenched regulatory expertise and robust venture capital, yet faces raw-material shortages and export-control uncertainties that complicate supply continuity. Canada’s OmniaBio is building an AI-enabled cell therapy hub designed to halve production costs, signaling regional commitment to advanced manufacturing. Mexico attracts near-shoring interest as companies seek proximity to the United States without incurring domestic cost structures. Collectively, these dynamics ensure that the cell line development market in North America remains both innovative and capital intensive.
APAC Cell Line Development Market
Asia-Pacific records the fastest 10.96% CAGR through 2031, fueled by more than USD 3 billion of 2024 biomanufacturing commitments in Singapore alone. AstraZeneca’s USD 1.5 billion ADC plant and BioNTech’s first ex-Germany facility exemplify the region’s rise as a premium biomanufacturing destination. China and India retain cost advantages and large internal demand, yet the U.S. BIOSECURE Act proposal accelerates diversification toward Indian CDMOs, South Korean biologics clusters, and ASEAN member states. Japan and Australia complement the ecosystem through high-precision analytics and RNA therapeutics platforms, respectively. These moves collectively shift the gravitational center of the cell line development market toward Asia-Pacific while creating multipolar supply networks that mitigate geopolitical risks.
EMEA and South America Cell Line Development Market
Europe experiences steady but slower expansion, supported by established pharmaceutical corridors in Germany, Switzerland, and Ireland. Government incentives for advanced therapies and cross-border regulatory harmonization preserve competitiveness, although energy costs and wage inflation narrow margins relative to Asia. The Middle East and Africa pursue strategic entry, with Saudi Arabia’s National Biotechnology Strategy targeting global leadership by 2040 and the UAE positioning itself as a regional logistics node. South America, led by Brazil, taps domestic demand and emerging biosimilar opportunities, yet limited venture funding constrains rapid capacity build-out. Altogether, a rebalanced global footprint emerges in which the cell line development market relies on diverse manufacturing hubs to match local demand and de-risk supply chains.

Competitive Landscape
Competitive Landscape
The cell line development market remains moderately fragmented because no single vendor controls an outsized revenue share. Thermo Fisher Scientific, Sartorius, and Danaher anchor integrated portfolios that range from media to analytical instruments, yet emerging AI-centric firms disrupt on process speed and cost metrics. Partnerships define competitive boundaries as Bristol Myers Squibb aligns with Cellares for automated cell therapy production, while Scorpius Holdings integrates Celltheon’s transposase-based platform to shorten stable-cell line generation. Technology races focus on productivity gains, with Enduro Genetics reporting 30% yield improvements by linking essential genes to target expression, thereby aligning cellular growth with product output.
Regulatory expertise serves as a key differentiator, particularly under the revised FDA viral safety guidelines that emphasize comprehensive adventitious-agent testing. Companies with validated quality-by-design workflows can command premium pricing and secure long-term supply contracts. Geopolitical disruption functions as both threat and opportunity: the proposed BIOSECURE Act could curtail WuXi Biologics’ access to U.S. clients, steering contracts toward Indian and Southeast Asian providers. Continuous bioprocessing competencies also create stratification; firms that integrate perfusion bioreactors and inline analytics offer superior cost per gram, winning bids for high-volume antibody projects.
Smaller players often specialize in niche modalities such as lentiviral vector manufacturing or CRISPR-ready suspension HEK293 lines that circumvent existing patent thickets. Those niches, while individually small, collectively underpin a vibrant innovation layer that supplies proprietary cell banks and process know-how to larger CDMOs or direct to sponsors. As biologics pipelines diversify into multi-specifics and autologous therapies, the competitive landscape of the cell line development market will continue to reward agile players able to pivot quickly across molecule classes while maintaining strong compliance records.
Cell Line Development Industry Leaders
Promega Corporation
Danaher Corporation
Sartorius AG
Thermo Fisher Scientific
Merck KGaA
- *Disclaimer: Major Players sorted in no particular order
Cell Line Development Market Companies Covered in this Report
- American Type Culture Collection
- Sartorius
- Danaher
- Merck KGaA (MilliporeSigma)
- Thermo Fisher Scientific
- Wuxi Biologics
- Corning
- Selexis SA (JSR Life Sciences)
- Promega
- FUJIFILM
- Lonza Group
- GE HealthCare (Cell Culture)
- Samsung Group
- AGC Biologics
- Horizon Discovery (PerkinElmer)
- Charles River
- KBI Biopharma
- BioReliance (Merck)
- GenScript Biotech
- Evotec

Recent Industry Developments in Cell Line Development Market
- January 2025: BioCina and NovaCina merged to establish a global powerhouse in biopharmaceutical manufacturing, integrating services from cell line development to commercial substance production under the BioCina name.
- May 2025: AstraZeneca acquired cell therapy start-up EsoBiotec for USD 425 million upfront, expanding its capabilities in cell therapy development.
- October 2024: Matica Biotechnology joined forces with KaliVir Immunotherapeutics to enhance oncolytic viral therapy development using MatiMax cell lines.
- September 2024: Hovione and iBET created ViSync Technologies to tackle drug-delivery challenges for complex cell and gene therapies.


Cell Line Development Market Report Scope and Research Methodology
Market Definition and Coverage
Our study defines the cell line development market as the revenue generated from reagents, media, specialized equipment, and associated services used to create, screen, and bank stable mammalian and non-mammalian cell lines that express therapeutic or diagnostic biomolecules. This working definition, adopted by Mordor Intelligence, tracks value only at the point where cell lines are finalized and released for research or commercial bioproduction.
Scope exclusion: temporary research cell cultures, downstream purification hardware, and generic cell culture consumables not tied to line-creation workflows are left out.
Segments Covered in This Report
- By Product
- Reagents & Media
- Equipment
- Other Products
- By Source
- Mammalian Cell Line
- Non-mammalian Cell Line
- By Application
- Recombinant Protein Expression
- Hybridoma Technology
- Vaccine Production
- Drug Discovery & Screening
- Gene & Cell Therapy Manufacturing
- Other Applications
- By End User
- Biopharma & Pharma Companies
- Contract Development & Manufacturing Organisations (CDMOs)
- Academic & Research Institutes
- Other End-users
- Geography
- North America
- United States
- Canada
- Mexico
- Europe
- Germany
- United Kingdom
- France
- Italy
- Spain
- Rest of Europe
- Asia-Pacific
- China
- Japan
- India
- South Korea
- Australia
- Rest of Asia-Pacific
- Middle East and Africa
- GCC
- South Africa
- Rest of Middle East & Africa
- South America
- Brazil
- Argentina
- Rest of South America
- North America
Data Sources, Market Sizing, and Validation
Primary Research
We interviewed process-development directors at global CDMOs, upstream scientists inside mid-sized biopharma, and procurement leads at academic core facilities across North America, Europe, and Asia-Pacific. Their insights on average transfection yields, timeline compression targets, and pricing tiers validated desk findings and closed data gaps on service fee structures.
Desk Research
Mordor analysts began with authoritative open data such as US FDA CDER biologics approvals, EMA marketing-authorisation logs, OECD and NIH R&D outlays, UN Comtrade imports of fetal bovine serum, and patent volumes from Questel. Industry association white papers (BIO, ABPI), peer-reviewed journals, SEC 10-K filings, and news archives on Dow Jones Factiva rounded out trend signals. D&B Hoovers supplied company-level revenue splits that anchor segment shares. The sources listed illustrate the breadth of materials consulted; many additional datasets were checked for consistency.
Market-Sizing & Forecasting
A top-down reconstruction starts with biologic drug pipelines, CAPEX announcements for single-use bioreactors, and annual therapeutic protein batch counts; these establish the demand pool, which is then pressure-tested through selective bottom-up checks such as sampled reagent ASP × volume data and supplier roll-ups.
Number of new monoclonal antibody IND filings, success rate of stable clone selection, average per-line development fee, regional capacity utilization at CDMOs, and biologics share of total R&D spend.
Five-year forecasts employ multivariate regression combined with scenario analysis around regulatory approval velocity. Gaps in bottom-up evidence are bridged by applying conservative uptake ratios derived from primary interviews.
Data Validation & Update Cycle
Outputs pass anomaly screens, peer review rounds, and variance checks against independent metrics before sign-off. Reports refresh annually; material events trigger interim updates, and a final analyst sweep occurs just prior to client delivery.
How Mordor Intelligence's Cell Line Development Market Size Compares to Other Published Estimates
Published values often diverge because firms pick different service sets, pricing ladders, and refresh cadences. Our disciplined scope and dual-lens modelling temper extremes that can arise from aggressive forward booking or all-inclusive cell-culture counting.
Key gap drivers include: some studies bundle ancillary culture disposables, apply higher average selling prices, or extrapolate a 2024 base with generic biotech CAGRs rather than line-specific indicators. Mordor's annual refresh and variable-level triangulation reduce such drift.
Benchmark comparison
| Market Size | Anonymized source | Primary gap driver |
|---|---|---|
| USD 4.97 B (2025) | Mordor Intelligence | - |
| USD 6.23 B (2025) | Global Consultancy A | Includes consumables beyond line-creation and uses upper-quartile ASPs |
| USD 5.82 B (2024) | Industry Publication B | Starts one year earlier and projects using blanket biotech growth, plus adds cell-bank storage fees |
In sum, the comparison shows that Mordor Intelligence delivers a balanced baseline grounded in clearly defined inclusions, transparent variables, and repeatable steps that decision-makers can trace and stress-test with ease.


Key Questions Answered in the Report
What is the projected value of the cell line development market by 2031?
The market is forecast to reach USD 8.95 billion by 2031, growing at a 10.31% CAGR.
Which product segment holds the largest share today?
Reagents and media lead with 43.55% revenue share because consumables drive recurring demand in cell culture operations.
Why are mammalian cell lines preferred for biologics manufacturing?
They provide human-like post-translational modifications, which are essential for the safety and efficacy of complex proteins.
How will the proposed U.S. BIOSECURE Act impact the market?
If enacted, it may restrict collaborations with certain Chinese suppliers, redirecting outsourcing toward India and Southeast Asia.
What role do AI-guided platforms play in cell line development?
They reduce lab experimentation and improve productivity by predicting optimal gene edits and media formulations from multi-omics data.
Why are CDMOs growing faster than in-house development teams?
Outsourcing offers sponsors flexibility, advanced technologies, and lower upfront capital, driving an 11.17% CAGR for CDMOs through 2031.
Page last updated on:


