Automated Border Control Market Size and Share
Market Overview
| Study Period | 2021 - 2031 |
|---|---|
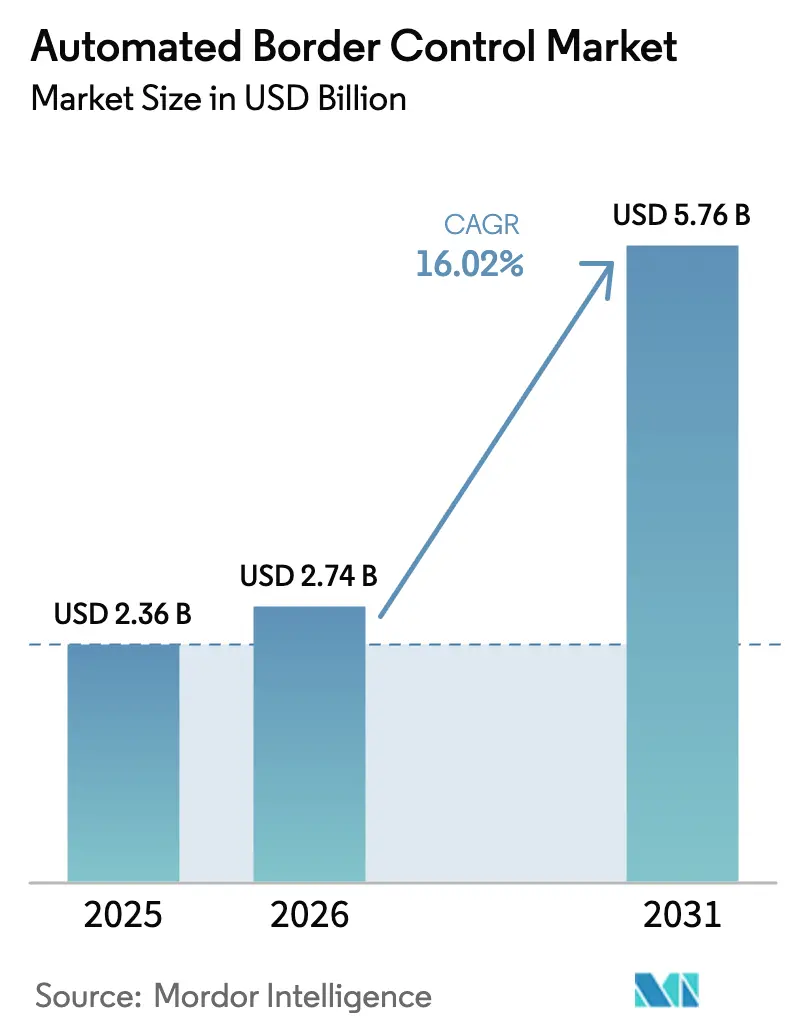
| Market Size (2026) | USD 2.74 Billion |
| Market Size (2031) | USD 5.76 Billion |
| Growth Rate (2026 - 2031) | 16.02% CAGR |
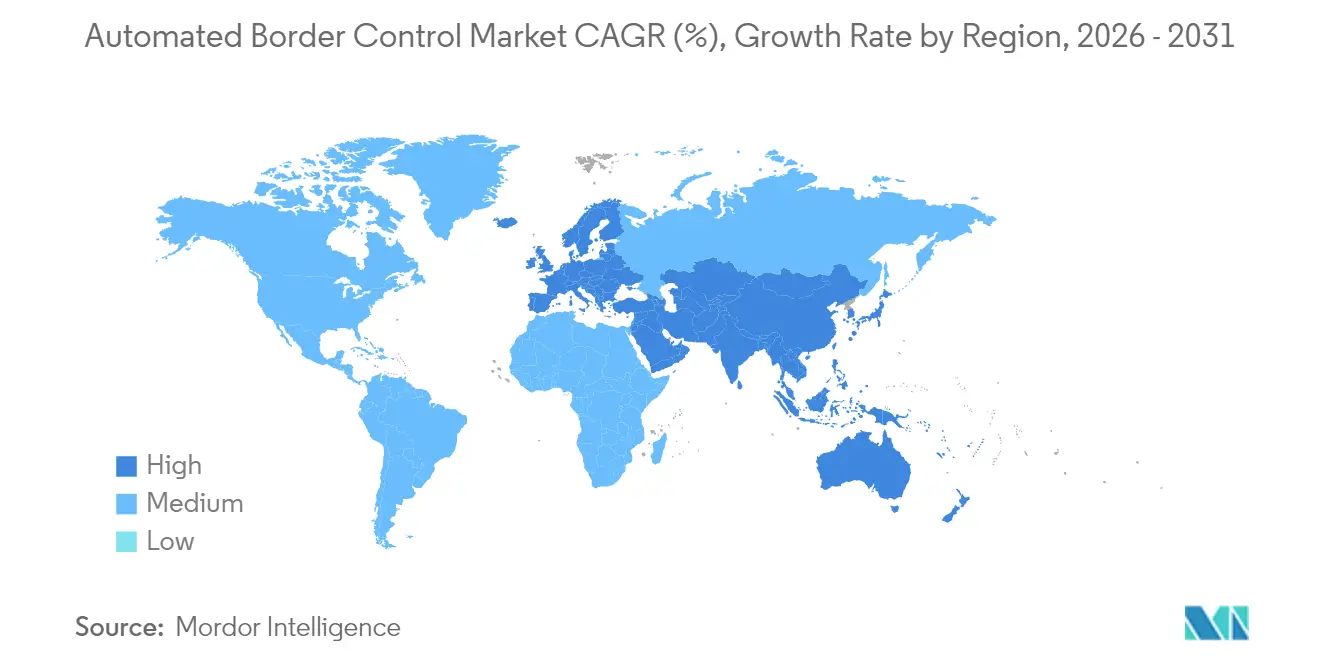
| Fastest Growing Market | Asia |
| Largest Market | Europe |
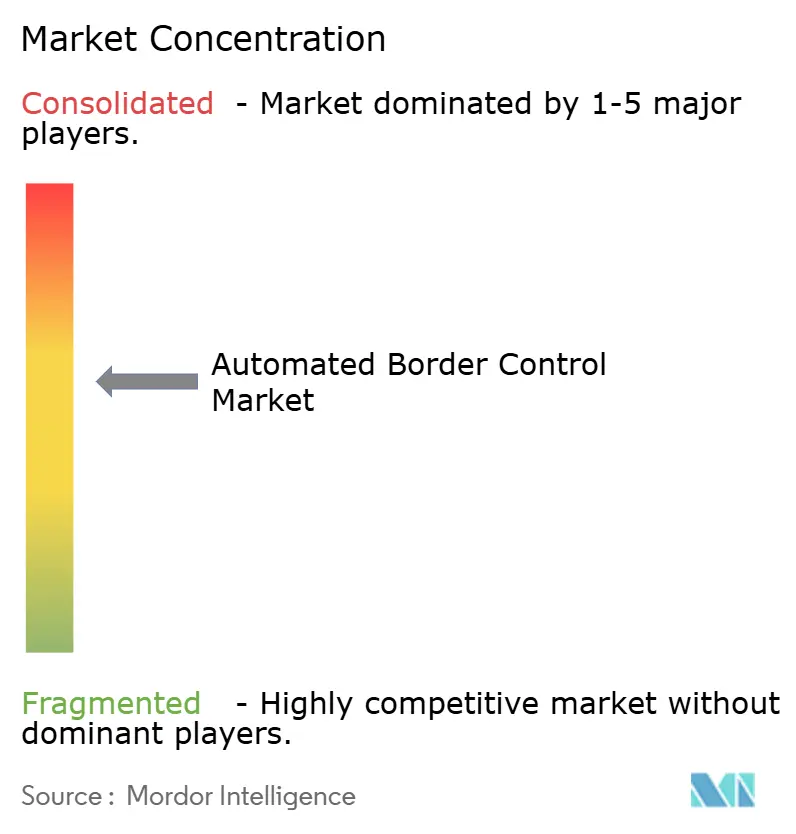
| Market Concentration | Medium |
Major Players *Disclaimer: Major Players sorted in no particular order Image © Mordor Intelligence. Reuse requires attribution under CC BY 4.0. | |
Automated Border Control Market Analysis by Mordor Intelligence
The automated border control market size was valued at USD 2.36 billion in 2025 and estimated to grow from USD 2.74 billion in 2026 to reach USD 5.76 billion by 2031, at a CAGR of 16.02% during the forecast period (2026-2031). Expansion synchronizes with three converging forces: mandatory biometric programs such as the European Entry/Exit System (EES), rising passenger numbers that have returned to pre-pandemic levels, and aggressive public-sector funding earmarked for smarter borders. Governments anchor procurement on systems that shorten processing times, strengthen identity assurance, and plug directly into national watch-list databases. Suppliers that combine hardware, cloud software, and artificial intelligence now win a larger share of multiyear contracts, while modular architectures lower rollout risk for emerging states. Geopolitical unrest continues to raise the threat profile at airports and land ports, accelerating adoption of facial-recognition and analytics engines that can screen travelers in seconds.
Key Report Takeaways
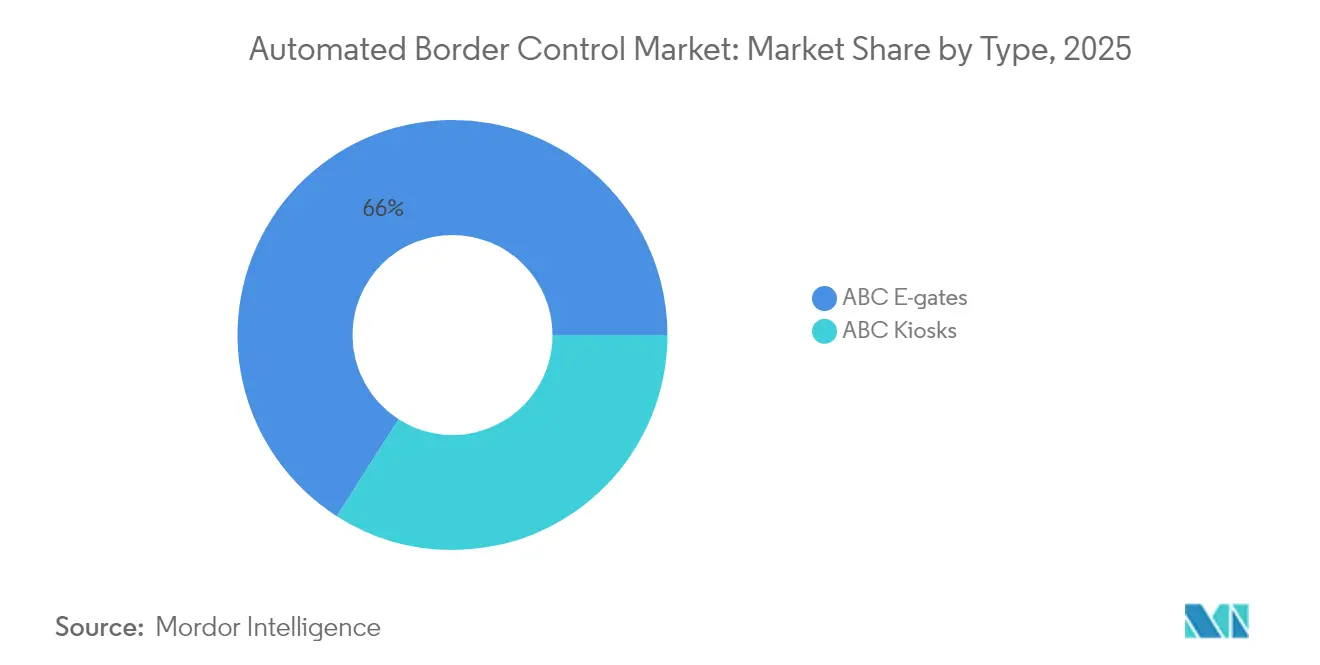
- By type, e-gates led with 65.95% revenue share in 2025; kiosks are projected to expand at a 17.12% CAGR to 2031.
- By offering, hardware captured 60.85% of the automated border control market size in 2025, whereas software is forecast to grow at 16.18% through 2031.
- By solution model, fully automated systems held 70.35% of the automated border control market share in 2025, while semi-automated models are advancing at a 16.46% CAGR.
- By mode of operation, one-step processing commanded 78.20% share of the automated border control market size in 2025; two-step systems will accelerate at 16.12% CAGR.
- By end-use application, airports represented 82.90% of revenue in 2025; land ports show the highest projected CAGR at 17.05% through 2031.
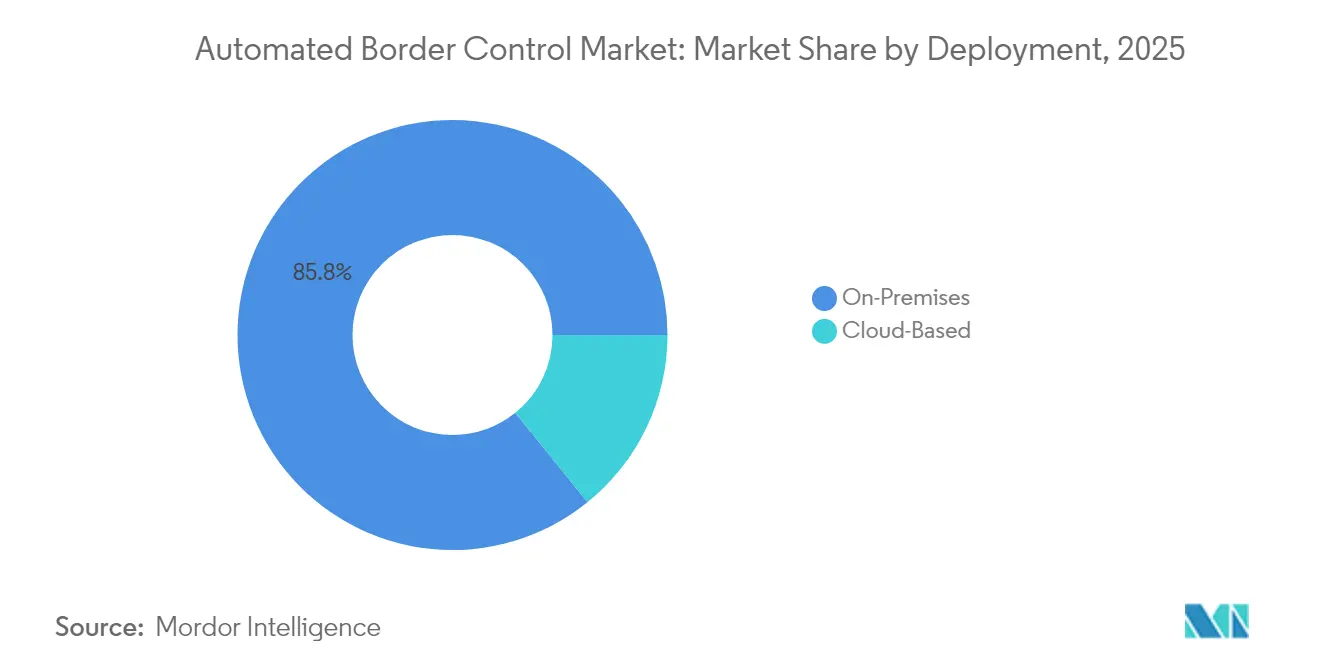
- By deployment, on-premises installations held 85.80% share of the automated border control market size in 2025, yet cloud platforms are growing at 16.62%.
- By throughput capacity, 200-400 passengers per hour systems led with 43.60% share, while >400 passengers per hour systems are forecast to expand at 17.08% CAGR.
- By region, Europe accounted for 42.95% of revenue in 2025, and Asia is the fastest-growing region with an 18.02% CAGR to 2031.
Note: Market size and forecast figures in this report are generated using Mordor Intelligence’s proprietary estimation framework, updated with the latest available data and insights as of 2026.
Global Automated Border Control Market Trends and Insights
Drivers Impact Analysis*
| Driver | (~) % Impact on CAGR Forecast | Geographic Relevance | Impact Timeline |
|---|---|---|---|
| Increasing passenger traffic requiring seamless border processing | +3.2% | Europe and Asia-Pacific core; North America spill-over | Medium term (2-4 years) |
| Heightened government focus on counter-terrorism funding | +2.8% | North America primary; global influence | Short term (≤ 2 years) |
| Rising adoption of contactless biometrics for pandemic-resilient hubs | +2.1% | Global; early gains in Singapore, UAE, Australia | Medium term (2-4 years) |
| Mandatory EU Entry/Exit System roll-out | +4.5% | Europe primary; global standards influence | Short term (≤ 2 years) |
| AI-powered facial recognition throughput gains | +2.3% | Global; mega-airports | Medium term (2-4 years) |
| Airline–airport A-CDM programs in Asia | +1.8% | Asia-Pacific core; Latin America emerging | Long term (≥ 4 years) |
| Source: Mordor Intelligence | |||
Mandatory EU Entry/Exit System Driving ABC Gate Installations
Scheduled for October 2025, the EES obliges 29 Schengen states to enroll third-country nationals’ biometrics through automated kiosks and e-gates. Member states have six months to achieve compliance after European Commission approval, stretching procurement into 2026 and beyond.[1]European Union, “Revised timeline for the EES and ETIAS,” travel-europe.europa.euSuppliers must enable direct integration with eu-LISA databases, prompting rapid upgrades from legacy gates to interoperable smart lanes. The regulation is already influencing adjacent markets as non-EU airports replicate EES technical specifications to maintain visa-waiver reciprocity.
Heightened Government Focus on Counter-Terrorism and Border-Security Funding
The United States allocated USD 60.8 billion in discretionary funding for homeland security in 2025, including USD 127 million channelled to Customs and Border Protection technology.[2]Department of Homeland Security, “Budget in Brief Fiscal Year 2025,” gsa.gov Canada earmarked CAD 355.4 million (USD 262 million) for traveller modernization projects. These budgets prioritise AI-enabled threat detection, cloud analytics, and multi-modal biometrics, underlining how fiscal stimulus accelerates the automated border control market.
AI-Powered Facial Recognition Improving Throughput at Mega-Airports
Singapore’s Changi Airport clears travellers in 10 seconds using advanced facial matching, processing 1.5 million visitors in the first 15 days after launch. NEC’s algorithm, verified at 99.88% accuracy by NIST, now operates in 80 airports.[3]NEC Corporation, “NEC Face Recognition Technology Ranks First,” nec.com Gateless corridors that scan up to 100 passengers per minute enable operators to meet surging traffic without expanding physical footprints.
Rising Adoption of Contactless Biometrics for Pandemic-Resilient Travel Hubs
Zayed International Airport will become the first facility to mandate biometric boarding across all checkpoints in 2025, replacing physical documents and reducing disease-transmission risk. UAE authorities enroll first-time visitors once, then re-use templates for future trips, demonstrating a lifecycle approach that cuts repetitive processing.
Restraints Impact Analysis*
| Restraint | (~) % Impact on CAGR Forecast | Geographic Relevance | Impact Timeline |
|---|---|---|---|
| Biometric data-privacy concerns under GDPR and similar laws | -2.1% | Europe primary; global influence | Medium term (2-4 years) |
| High upfront CAPEX for emerging-nation border points | -1.8% | Africa, Latin America, Southeast Asia | Long term (≥ 4 years) |
| Spoofing and liveness-detection downtime risks | -1.2% | Global | Short term (≤ 2 years) |
| Legacy IT and passport databases | -1.5% | Africa, South America, Caribbean | Medium term (2-4 years) |
| Source: Mordor Intelligence | |||
Biometric Data-Privacy Concerns under GDPR and Similar Laws
Strict retention rules oblige vendors to partition databases and deploy edge masking, inflating development cost and elongating certification cycles. The EU delayed the EES partly to finalise data-protection impact assessments, illustrating regulatory friction. North American agencies now publish privacy impact statements as standard, adding transparency but also administrative overhead. Although compliance raises barriers to entry, it ultimately favours incumbents with proven governance frameworks, shaping competitive dynamics in the automated border control market.
High Up-front CAPEX for Emerging-Nation Border Points
Land crossings in developing economies often lack fibre backbones and secure power, elevating installation budgets. Public-private partnerships are closing the gap, with reimbursable service agreements funding additional officer hours and equipment in the United States and pilot P3s emerging in Latin America. Vendors offering modular, solar-powered kiosks or automated border control as a service lower adoption hurdles, yet the pace remains slower than in developed regions, tempering global growth.
*Our forecasts treat driver/restraint impacts as directional, not additive. The impact forecasts reflect baseline growth, mix effects, and variable interactions.
Segment Analysis
By Type: E-gates Retain Leadership While Kiosks Accelerate
E-gates generated 65.95% of 2025 revenue, anchoring the automated border control market size at major hubs through high throughput and a compact footprint. Standardisation of ICAO compliance and multi-biometric modules has lowered integration risk, encouraging airports to bundle e-gates into terminal refresh programs. Modular designs shorten installation time, letting operators phase works without shutting lanes, a critical advantage during peak travel seasons.
Kiosks, registering a 17.12% CAGR, appeal to operators seeking flexible deployment in space-constrained settings or during leasehold upgrades. Units can be relocated if passenger flows shift, offering agility unmatched by fixed e-gate arrays. Software updates delivered over secure networks extend functionality across the installed base, ensuring continuous alignment with evolving risk models. As more land ports pilot kiosk programs, vendors address ruggedisation and weatherproofing, widening application scope and enlarging the automated border control market.


By Offering: Hardware Dominance Faces Rapid Software Upside
Hardware captured 60.85% of 2025 revenue, reflecting the upfront cost of biometric cameras, document readers, and obstruction-detect sensors. Precision optics and high-durability materials underpin mean-time-between-failure metrics demanded by regulators. Yet software is scaling 16.18% annually, outstripping headline growth. Cloud-native analytics offload heavy computation from edge devices, lowering hardware spec and operating temperature requirements. Authorities value real-time dashboards that correlate traveller risk scores with lane-level performance, letting duty managers re-allocate staff dynamically.
Subscription models are replacing perpetual licences, converting capital outlay into predictable operating expense. SaaS features like continuous threat-intel feeds and AIOps-based predictive maintenance elevate lifecycle performance, reinforcing the strategic gravity of software within the automated border control market.
By Solution Model: Full Automation Dominates, Semi-Automation Gains Traction
Fully automated lanes processed 70.35% of travellers in 2025 by combining document scanning, facial capture, and database checks in one pass. Operators cite labour-cost avoidance and predictable cycle times as core benefits. Semi-automated architectures, however, post a 16.46% CAGR because they let officers intervene when anomalies surface. Malaysia’s forthcoming Automatic Biometric Identification System embeds a human-in-the-loop layer for exceptional vetting.This dual-path strategy supports risk-based operations while sustaining throughput. It also positions vendors to monetise analytics modules that guide inspectors to outlier cases.

By Mode of Operation: One-Step Design Preferred
One-step systems owned 78.20% of 2025 revenue. Singapore’s passport-free corridor shows why: clearance fell from 25 seconds to 10 seconds, translating to higher gate turns and better passenger satisfaction. Two-step processes nevertheless log a 16.12% growth rate due to EES and certain Middle East deployments that separate enrolment from exit checks. The automated border control market now offers modular kits that can reconfigure from two-step to one-step as regulations lift.
Two-step models separate document authentication from biometric verification, erecting layered defences that frustrate sophisticated forgeries. ICAO promotes this architecture for high-risk crossings. Operators deploy dedicated enrolment kiosks followed by e-gates, ensuring complete capture even when traveller familiarity is low. Analytics triggered after the document step can alert officers ahead of the face match, shortening response time.
By End-Use Application: Airport Dominance Meets Land Port Momentum
Airports contributed 82.90% of 2025 revenue, leveraging controlled environments and predictable passenger profiles. Hub operators fold ABC investments into multi-billion terminal expansions, embedding lanes within architectural sightlines that support intuitive way-finding. Integration with airline DCS and bag-drop infrastructure allows kerb-to-gate biometrics, elevating dwell-time monetisation in retail concessions.
Land ports are advancing at 17.05% CAGR as cross-border commerce lifts vehicle and pedestrian volumes. Modernisation programs bundle biometric lanes with non-intrusive inspection to cut smuggling while maintaining flow. Seasonal traffic spikes around public holidays highlight the resilience benefits of automation. Combined, these trends extend the automated border control market well beyond aviation.
By Deployment: On-Premises Systems Preserve Security Sovereignty
On-premises arrays safeguarded 85.80% of 2025 installations because many states still require physical control over citizen data. Cloud, though, advances at 16.62% CAGR as encryption, sovereignty zones, and edge gateways ease security concerns. SAIC’s hybrid rollout fuses cloud analytics with local biometric caches for US border checkpoints, cutting maintenance visits while retaining data sovereignty.Commercial models now bundle software licences with usage-based fees, making cloud attractive for smaller states that lack data centres. This evolution widens market access and underpins future demand for continuous-delivery updates across the automated border control market.
By Throughput Capacity: High-Volume Lanes Gain Momentum
Systems rated for 200-400 passengers per hour accounted for 43.60% of demand in 2025, fitting most terminal footprints. However, >400 passengers per hour platforms rise at 17.08% CAGR. NEC’s gateless corridor authenticates 100 people a minute, cutting queue length by half. Operators chasing mega-hub status view such performance as a prerequisite for slot additions and airline partnerships.Lower-capacity options remain relevant at secondary airports and ferry terminals, maintaining diversity in vendor portfolios and sustaining total automated border control market growth.
Geography Analysis
Europe held 42.95% of 2025 revenue. Member states pour capital into EES-compliant kiosks and gates to avoid fines and passenger disruption. The Czech Republic alone ordered 58 kiosks and 94 e-towers from secunet for airport and land checks secunet. The UK allocated GBP 3.5 million (USD 4.7 million) to retrofit port lanes.Germany, France, Italy, and Spain each launched multiyear tenders, compelling vendors to ramp European assembly lines and local support teams.
Asia registers an 18.02% CAGR and will surpass Europe on annual installations by 2028. Singapore moved all checkpoints to automated lanes, processing 1.5 million travellers in 15 days. China’s Gongbei Port added 20 “card-free” channels for Guangdong-Hong Kong-Macao integration. India scaled Fast-Track Immigration to 21 airports after a successful Delhi pilot that enrolled 18,400 users. Japan commissioned NEC kiosks at Haneda to support 60 million-visitor targets.North America ranks third by spend but leads in per-site budgets. The Infrastructure Investment and Jobs Act funds 50 land-port modernisations. Canada invests CAD 1.3 billion (USD 959 million) in border security, including CAD 355.4 million for traveller modernisation. The automated border control market thus benefits from stable federal appropriations that guarantee contract visibility for prime contractors and niche biometric firms.

Competitive Landscape
The market shows moderate concentration. Thales, IDEMIA, NEC, and Vision-Box anchor global share by offering vertically integrated stacks covering enrolment, verification, and orchestration. IN Groupe’s planned acquisition of IDEMIA’s Smart Identity division would lift combined sales above EUR 1 billion (USD 1.06 billion), reinforcing the strategic premium on scale for sovereign-ID tenders. Consolidation allows portfolio cross-selling, including travel documents, civil IDs, and e-gate hardware, strengthening lock-in with government clients.
Differentiation shifts toward AI accuracy, liveness detection, and cloud orchestration. Smaller specialists such as Secunet exploit high-assurance software certifications to win EU public-sector contracts. Meanwhile, travel-tech giant Amadeus entered the space through its Vision-Box purchase, reflecting convergence between passenger-processing and border-control ecosystems. Supplier success increasingly depends on lifecycle support, data-governance compliance, and the ability to orchestrate heterogeneous fleets of kiosks and gates, shaping future rivalry inside the automated border control market.
White-space remains in emerging regions where funding gaps curb adoption. Vendors collaborate with development banks and infrastructure funds to structure availability-payment models that bundle maintenance and capacity-building. Such financing innovation can unlock latent demand, offering new revenue frontiers across the automated border control market.
Automated Border Control Industry Leaders
Atos SE
Veridos GmbH
Cognitec Systems GmbH
Magnetic Autocontrol GmbH
NEC Corporation
- *Disclaimer: Major Players sorted in no particular order

Recent Industry Developments
- May 2025: Amadeus completed the acquisition of Vision-Box, integrating biometric border solutions into its travel portfolio to deepen end-to-end passenger journey control.
- April 2025: SITA led Indicio’s Series A round to scale digital travel credentials, aligning with its strategy to embed identity wallets into airline and border workflows
- April 2025: Otay Mesa East Port of Entry won a USD 150 million federal grant, including USD 36 million for biometric technology, supporting SANDAG’s integrated smart-port blueprint
- January 2025: Thales partnered with Lebanon to upgrade Beirut Airport with end-to-end biometric corridors, illustrating market entry via sovereignty partnerships


Research Methodology Framework and Report Scope
Market Definitions and Key Coverage
Our study treats the automated border control (ABC) market as all self-service e-gates and kiosks that authenticate travelers by reading electronic travel documents and matching live biometrics, face, fingerprint, or iris, to chip-stored templates at regulated border checkpoints.
Scope Exclusions: Solutions limited to manual document inspection booths or non-biometric surveillance radars lie outside this assessment.
Segmentation Overview
- By Type
- ABC E-gates
- ABC Kiosks
- By Offerings
- Hardware
- Document Authentication System (DAS)
- Biometric Verification System (BVS)
- Face Recognition
- Fingerprint Recognition
- Iris Recognition
- Palm and Vein Recognition
- Software
- Border Management Software
- Middleware and SDKs
- Analytics and Reporting
- Services
- Installation and Integration
- Maintenance and Support
- Consultancy and Training
- Hardware
- By Solution Model
- Fully Automated
- Semi-Automated
- By Mode of Operation
- One-Step Process
- Two-Step Process
- By End-Use Application
- Airports
- Land Ports
- Seaports
- Rail Terminals
- By Deployment
- On-Premises
- Cloud-Based
- By Throughput Capacity
- Less than 200 Passengers/Hour
- 200-400 Passengers/Hour
- Above 400 Passengers/Hour
- By Geography
- North America
- United States
- Canada
- Mexico
- South America
- Brazil
- Argentina
- Rest of South America
- Europe
- United Kingdom
- Germany
- France
- Italy
- Spain
- Rest of Europe
- Asia Pacific
- China
- Japan
- South Korea
- India
- Australia and New Zealand
- Rest of Asia Pacific
- Middle East
- Saudi Arabia
- United Arab Emirates
- Turkey
- Rest of Middle East
- Africa
- South Africa
- Egypt
- Kenya
- Rest of Africa
- North America
Detailed Research Methodology and Data Validation
Primary Research
Mordor analysts conducted structured interviews with airport IT managers, homeland-security planners, biometric device makers, and regional system integrators across Europe, Asia, and North America. These discussions validated typical gate throughput, average selling prices, adoption hurdles, and the timing of EU-EES compliance, allowing us to refine desk-derived assumptions.
Desk Research
We started by reviewing open datasets from bodies such as Eurostat, ICAO, TSA, and the UNWTO to anchor passenger volumes, border-crossing counts, and regional infrastructure pipelines. Government procurement portals, for example, Tenders Electronic Daily, revealed average e-gate contract values that informed equipment pricing curves. Our team also inspected white papers from industry associations like the Biometrics Institute and Airports Council International, customs shipment records on Volza, and patent families via Questel to judge the technology refresh cycle. Subscription databases, D&B Hoovers for vendor revenues and Dow Jones Factiva for deal flow, added company-level context. The sources listed illustrate our approach; many other publications, filings, and datasets were additionally consulted.
Market-Sizing & Forecasting
A top-down build began with international passenger traffic, cross-border land trips, and seaport embarkations, which are then mapped to ABC adoption rates by port category. Results are checked with selective bottom-up roll-ups of installed e-gate counts and sampled ASP × unit volumes for major terminals. Key variables include EU Entry/Exit System deadlines, airport capital-expenditure pipelines, biometric hardware cost deflation, yearly traveler growth, and average gate life cycles. For forecasting, a multivariate regression blends passenger growth with biometric adoption indices and regulatory triggers; scenario overlays adjust for pandemic recovery lags or funding delays. Gaps where bottom-up evidence is thin are bridged by regional analogs vetted in expert calls.
Data Validation & Update Cycle
Outputs pass a three-layer review, analyst, senior peer, and research quality desk, with variance thresholds flagged for re-check. We benchmark model totals against independent indicators such as European e-gate shipments and APAC smart-airport budgets, revisiting sources when discrepancies exceed five percent. Reports refresh yearly, and we trigger interim updates after material events like new biometric mandates.
Why Mordor's Automated Border Control Baseline Inspires Confidence
Published numbers often differ because firms pick dissimilar product mixes, price assumptions, and refresh cadences. Our disciplined scope selection and annual recalibration keep figures aligned with on-ground roll-outs.
Key gap drivers include the inclusion of software-only maintenance contracts by some publishers, the use of unverified list prices instead of delivered ASPs, and forecast models that extend pre-pandemic passenger growth straight through recovery years without moderation.
Benchmark comparison
| Market Size | Anonymized source | Primary gap driver |
|---|---|---|
| USD 2.36 B | Mordor Intelligence | - |
| USD 2.56 B | Global Consultancy A | Assumes full software and services revenue plus kiosk retrofits not yet tendered |
| USD 1.88 B | Trade Journal B | Applies conservative passenger rebound and omits Asia land-port installations |
These contrasts show that Mordor's balanced mix of validated traffic data, realistic ASP curves, and frequent refresh cadence delivers a dependable baseline that decision-makers can trace back to clear variables and repeatable steps.


Key Questions Answered in the Report
What is the current size of the automated border control market?
The market is valued at USD 2.74 billion in 2026 and is forecast to reach USD 5.76 billion by 2031.
Which region commands the largest share of automated border control installations?
Europe holds 42.95% of revenue due to mandatory EES compliance across 29 Schengen states.
Why are kiosks growing faster than e-gates?
Kiosks fit land ports and budget-constrained projects, posting a 17.12% CAGR compared with e-gates’ mature base.
How will cloud deployment affect adoption?
Cloud platforms grow at 16.62% CAGR by lowering maintenance costs and enabling centralized analytics, despite sovereignty hurdles.
What are the main barriers for emerging markets?
High upfront CAPEX and complex integration with legacy systems delay large-scale projects in Africa and Latin America.
How do privacy regulations influence technology choices in Europe?
GDPR and the EU AI Act drive demand for on-premises storage, encryption, and consent mechanisms, increasing system complexity and cost.
Page last updated on:


