Market Overview
| Study Period | 2020 - 2031 |
|---|---|
| Forecast Data Period | 2026 - 2031 |
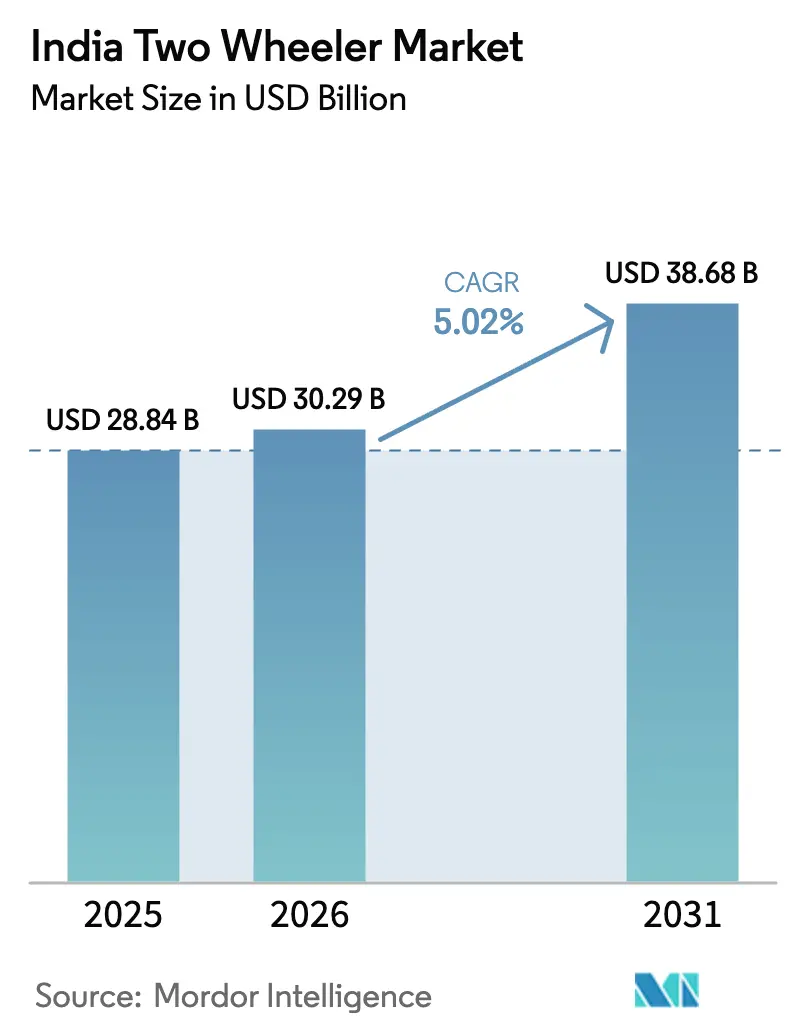
| Base Year Market Size (2025) | USD 28.84 Billion |
| Market Size (2026) | USD 30.29 Billion |
| Market Size (2031) | USD 38.68 Billion |
| Growth Rate (2026 - 2031) | 5.02% CAGR |
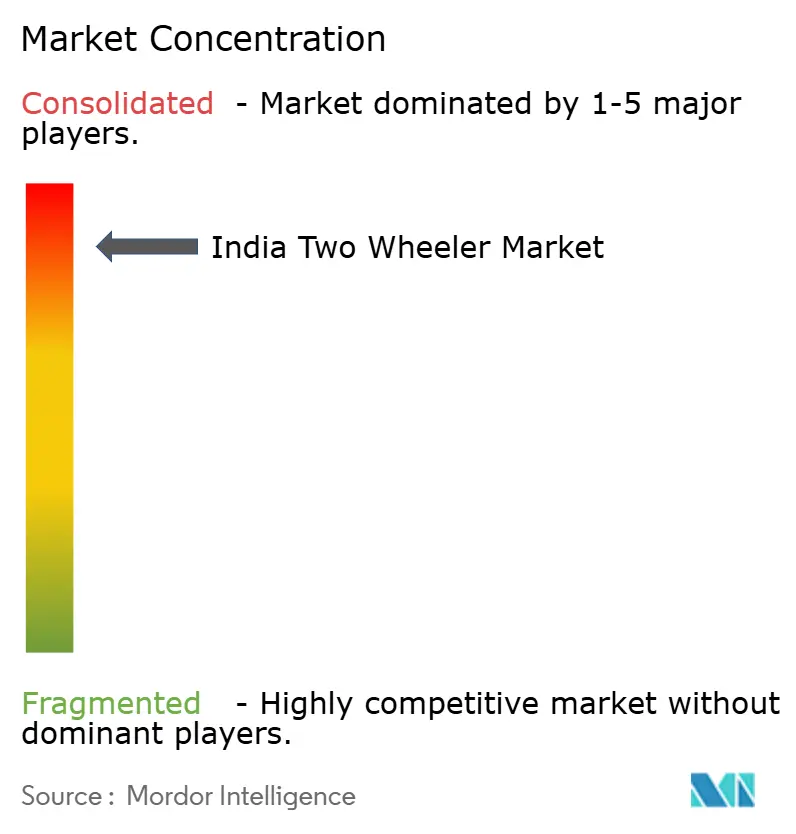
| Market Concentration | High |
Major Players *Disclaimer: Major Players sorted in no particular order Image © Mordor Intelligence. Reuse requires attribution under CC BY 4.0. | |
India Two Wheeler Market Analysis by Mordor Intelligence
The India two-wheeler market size was valued at USD 28.84 billion in 2025 and estimated to grow from USD 30.29 billion in 2026 to reach USD 38.68 billion by 2031, at a CAGR of 5.02% during the forecast period (2026-2031). Strong policy backing for electrification, export demand recovery, and widening digital retail channels underpin this trajectory. Preference for agile transport in congested cities, the return of disposable incomes after the pandemic, and growing logistics fleets reinforce volume growth. Electric vehicle uptake is amplified by battery swapping economics, while scale benefits from ICE exports allow manufacturers to fund electrification without eroding margins. Intensifying competition among legacy brands and EV specialists encourages faster model refresh cycles, added connectivity features, and aggressive pricing strategies that keep the India two-wheeler market attractive for both mass and premium buyers.
Key Report Takeaways
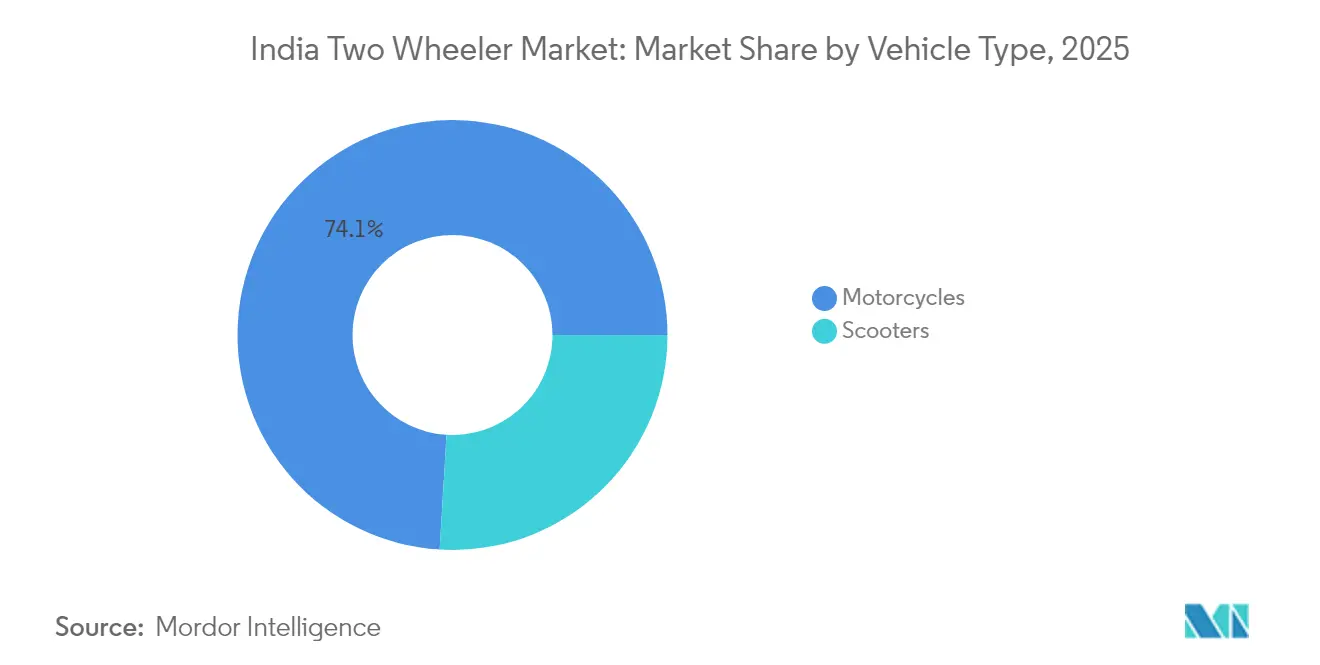
- By vehicle type, Motorcycles commanded 74.05% of the India two-wheeler market share by vehicle type in 2025, whereas scooters are forecast to advance at a 6.05% CAGR through 2031.
- By propulsion, ICE models held 88.15% of the India two-wheeler market in 2025, while electric variants are projected to rise at a 7.02% CAGR to 2031.
- By engine capacity/motor power, the up to 110 cc band accounted for 43.75% of the India two-wheeler market size in 2025; the 1.1-3.0 kW electric class is expanding at a 7.16% CAGR during the forecast period.
- By price band, sub-USD 1,000 units led with 48.25% of the India two-wheeler market share in 2025, and the USD 1,501-2,000 tier is expected to grow at a 7.45% CAGR to 2031.
- By end user, B2C purchases formed 91.25% of the India two-wheeler market size in 2025, though delivery and logistics fleets are growing at a 6.55% CAGR through 2031.
- By sales channel, offline outlets retained 95.35% of the India two-wheeler market share in 2025, yet online platforms will climb at a 7.04% CAGR over the forecast horizon.
- By state, Uttar Pradesh captured a 12.18% share of the India two-wheeler market in 2025, whereas Tamil Nadu is forecast to expand at an 7.96% CAGR to 2031.
Note: Market size and forecast figures in this report are generated using Mordor Intelligence’s proprietary estimation framework, updated with the latest available data and insights as of 2026.
India Two Wheeler Market Trends and Insights
Drivers Impact Analysis*
| Driver | (~) % Impact on CAGR Forecast | Geographic Relevance | Impact Timeline |
|---|---|---|---|
| FAME-II and State EV Incentives | +1.2% | Maharashtra, Karnataka, Tamil Nadu, pan-India | Medium term (2-4 years) |
| Urban Congestion Drives 2W Demand | +0.8% | Metro and tier-I cities | Short term (≤ 2 years) |
| Swappable Batteries Lower TCO | +0.9% | Urban delivery hubs | Medium term (2-4 years) |
| Tier-II/III E-Commerce Growth | +0.7% | Smaller cities nationwide | Long term (≥ 4 years) |
| Digital Lending for Informal Riders | +0.5% | Informal hubs nationwide | Medium term (2-4 years) |
| ICE Exports Sustain Scale | +0.6% | Manufacturing states | Short term (≤ 2 years) |
| Source: Mordor Intelligence | |||


FAME-II Subsidy Extension and State EV Incentives
Government incentives are driving the swift adoption of electric two-wheelers. National initiatives offer purchase subsidies and invest in infrastructure, guaranteeing sustained demand and establishing a comprehensive charging and swapping network. On the state level, programs boost affordability with cash incentives and capital subsidies. Additionally, the establishment of dedicated EV parks underscores a long-term commitment. This cohesive strategy bolsters OEM business cases and sets the stage for a significant move towards electrification in the market[1]“Electric Mobility Promotion Scheme 2024,”, Ministry of Heavy Industries, mhi.gov.in.
Urban Congestion Driving 2W Preference
Peak-hour speeds in Delhi and Mumbai fall below 20 km/h, yet a two-wheeler completes typical cross-town trips 40% quicker than a car while occupying 85% less parking space. Innovative city projects now earmark dedicated lanes and secure parking for two-wheelers, institutionalizing their role in reducing traffic congestion. Delivery fleets further validate the advantage by meeting 30-minute delivery promises via scooters and small motorcycles, reinforcing consumer perception that two-wheelers are the pragmatic mobility choice in urban India[2]“Traffic Speeds Report 2024,”, Transport Department, Government of Delhi, transport.delhi.gov.in.
Swappable-battery Business Models Lowering TCO
By eliminating the battery from upfront pricing, acquisition costs for electric two-wheelers have decreased significantly, thereby enhancing their accessibility. Energy and mobility companies, with ambitions to roll out thousands of swap stations, are capitalizing on established fuel retail networks, guaranteeing extensive urban coverage. Moreover, subscription-based models are slashing operating costs compared to gasoline, catalyzing a surge in commercial fleet adoption and heralding a significant shift towards widespread electrification.
Digital Lending Expanding Credit to Informal Riders
Digital lending platforms are transforming credit access for riders without formal financial histories. Account-Aggregator systems enable rapid consent-based data sharing, allowing banks to underwrite informal earners. Products like HDFC’s GIGA bundle offer flexible repayment and insurance, making loans accessible within hours. With informal labor dominating India’s workforce, these innovations significantly broaden the addressable base for electric two-wheelers and strengthen market growth potential.
Restraints Impact Analysis*
| Restraint | (~) % Impact on CAGR Forecast | Geographic Relevance | Impact Timeline |
|---|---|---|---|
| Battery Price Volatility | -0.8% | Global supply chains, domestic manufacturing | Short term (≤ 2 years) |
| Sparse Charging/Swapping Infra | -0.6% | Tier-II, tier-III cities, rural areas | Medium term (2-4 years) |
| Policy Uncertainty on GST & Duties | -0.5% | Nationwide | Short term (≤ 2 years) |
| Rising Insurance Costs | -0.4% | Nationwide | Medium term (2-4 years) |
| Source: Mordor Intelligence | |||
Battery-Raw-Material Price Volatility
Domestic battery manufacturers face currency risks and supply disruptions due to extreme swings in lithium prices and a heavy reliance on imported lithium and cobalt. These pressures compress profit margins, which in turn influence OEM pricing. As a result, the cost gap between electric vehicles and internal combustion vehicles occasionally widens, stalling purchase decisions even with subsidy support [3]“Global Critical Minerals Outlook 2024,”, International Energy Agency, iea.org.
Sparse Charging and Swapping Infrastructure Outside Metros
Public charging infrastructure remains heavily concentrated in major cities, leaving smaller towns and rural areas underserved. This imbalance sustains range anxiety and delays adoption, even when electric vehicles meet typical travel needs. Ambitious government targets for highway coverage face hurdles from complex approvals and limited private investment, making infrastructure expansion a critical enabler for mass-market electrification.
*Our forecasts treat driver/restraint impacts as directional, not additive. The impact forecasts reflect baseline growth, mix effects, and variable interactions.
Segment Analysis
By Vehicle Type: Scooters Gain Urban Traction
Motorcycles sustained 74.05% of the India two-wheeler market share in 2025, owing to their versatility across city and rural roads. Yet scooters are growing faster at a 6.05% CAGR through 2031, aided by automatic transmissions that suit stop-start traffic and rising female ridership. Commercial delivery firms value the flat floorboard and under-seat storage, adding corporate volumes that further widen scooter demand. Electric technology also fits scooters well because lower power needs align with smaller battery packs, ensuring reasonable prices and curb weights. In response, legacy brands unveil electric scooter lines while doubling down on 100-125 cc motorcycle refreshes to defend share in hinterland districts.
Risks for scooters lie in limited high-speed stability, which restricts appeal for highway users and rural commuters travelling longer distances. Motorcycles dominate semi-urban zones where mixed road surfaces require higher ground clearance and robust suspension. Tourer and adventure sub-segments anchor motorcycle volumes, as hobby and leisure riding are popular among affluent youth segments. Overall, the India two-wheeler market thus balances scooter momentum with motorcycle incumbency, leaving room for both formats to co-exist across geographies.


By Propulsion: Electric Momentum Builds
Internal combustion engine platforms accounted for 88.15% of the India two-wheeler market size in 2025, reflecting entrenched fuel stations and lower purchase costs. Subsidized pricing, battery-as-a-service, and cheaper renewables electricity push electric volumes forward, delivering a robust 7.02% CAGR to 2031. Fleet operators with 80-100 km daily realize break-even within 18-24 months, accelerating conversions. OEM portfolios now straddle both powertrains; Hero MotoCorp and TVS Motor invest in 48 V architecture scooters while upgrading BS-VI engines to meet tightening emission rules. Strategic hedging ensures relevance across the technology divide and shields revenues as the India two-wheeler market gradually electrifies.
Challenges remain: battery disposal norms, grid capacity in tier-III regions, and consumer awareness of real-world range. ICE continues to enjoy near-instant refueling advantages. However, pack prices fall at a 20% annual clip, and domestic cell manufacturing under India’s PLI-ACC scheme will narrow cost gaps further. Long-term, converging economics and improved infrastructure suggest a tipping point around 2028 when urban sales tilt materially toward electric.
By Engine Capacity: Mass Preferences Shape Demand
Entry-level engines, ranging from 50 to 110 cc, accounted for 43.75% of the Indian two-wheeler market size in 2025, reflecting the salary and fuel-efficiency priorities of millions who treat vehicles as basic mobility tools. Licensing norms favor these displacements, and maintenance costs remain low due to the abundance of local workshops. Electric equivalents in the 1.1-3.0 kW band post the fastest 7.16% CAGR since they balance usable speed with affordable battery capacity. Delivery fleets prefer the class because it can handle 25-30 multi-stop trips daily without requiring mid-shift charging.
Mid-displacement 126-150 cc motorcycles continue to maintain popularity among college students and highway commuters seeking more power. Above 200 cc, the leisure cohort grows from rising aspirational spending, yet remains niche. For electric powertrains beyond 5 kW, chase early adopters at premium price points. Expect a gradual shift of enthusiast riders toward high-performance e-motorcycles as battery energy density improves, especially once charge times are reduced to under 30 minutes at fast-charging stations.
By Price Band: Affordability Leads, Premiumization Appears
Vehicles priced below USD 1,000 secured 48.25% of the 2025 India two-wheeler market share. They dominate rural tradespeople and first-time buyers seeking dependable mobility with no frills. Despite inflation, cost discipline through modular platform sharing and localization allows OEMs to refresh styling and compliance features without steep price hikes.
The USD 1,501-2,000 tier shows the quickest 7.45% CAGR through 2031. Consumers in tier I and II cities value Bluetooth dashboards, LED lighting, and connected diagnostics, accepting higher prices that are partly cushioned by EV subsidies. Premium ICE tourers in the USD 3,001-5,000 range cater to hobby riders and export homologations for developed markets. Continuous income growth, credit access, and product differentiation mean India's two-wheeler market will gradually premiumize while preserving its core affordability.

By End User: Commercial Fleets Accelerate
B2C users still absorb 91.25% of the India two-wheeler market size in 2025, but commercial demand scales faster. Last-mile delivery, bike taxis, and corporate mobility subscriptions seek predictable operating costs and low downtime, nudging adoption of electric formats and battery swapping. Regulatory proposals to legalize two-wheeler ride-hail services nationwide could unlock millions of incremental units. Corporate CSR targets add momentum, as firms commit to electrify logistics fleets in alignment with net-zero pledges.
Delivery and logistics fleets are growing at a 6.55% CAGR through 2031. Personal buyers weigh brand assurance, resale value, and dealer coverage. EV penetration in personal use hinges on awareness campaigns and financing schemes that neutralize price gaps. Digital marketplaces now feature total ownership cost calculators that make electric vehicle economics transparent, a trend poised to boost adoption across both private and fleet segments in the Indian two-wheeler market.
By Sales Channel: Digital Transformation Picks Up
Offline outlets retained 95.35% of the India two-wheeler market share in 2025, offering touch-and-feel reassurance and bundled financing. Yet online-first brands such as Ola Electric shift the narrative to e-commerce, promising doorstep test rides and direct delivery. Online platforms are expected to grow at a 7.04% CAGR through 2031. Even legacy OEMs are introducing hybrid models, featuring online booking with price locks, followed by showroom delivery. Dealers respond with experiential zones and quick-service kiosks to keep foot traffic. Over time, digital journeys will shorten discovery and paperwork cycles, allowing volume scalability without proportional network expansion.
Rural e-commerce remains nascent due to patchy internet connectivity, but growing smartphone adoption suggests a rising openness to online research, even if final payment occurs at the nearest dealer. This omnichannel blend keeps the India two-wheeler market vibrant and accessible.
Geography Analysis
Uttar Pradesh captured 12.18% of India two two-wheeler market share in 2025, thanks to its large population and expanding peri-urban corridors. Motorcycles remain the workhorse across agrarian districts, while Noida-Ghaziabad’s service economies lift scooter penetration. The state’s EV manufacturing policy offers capital subsidies and SGST refunds, aiming to add assembly plants that shorten supply chains. However, the limited number of charging points outside the NCR still hinders widespread electrification.
Tamil Nadu is the fastest riser with an 7.96% CAGR to 2031, anchored by Chennai’s deep automotive base. Cluster synergies, a skilled labor pool, and the state’s target of 1 million electric two-wheelers by 2030 are attracting new investment. Ather Energy expanded its capacity in Hosur, and global suppliers have located battery and motor plants nearby, reinforcing the southern hub of the Indian two-wheeler market. Dedicated EV corridors and planned 20,000 chargers promise to dissipate range concerns quickly.
Maharashtra and Karnataka follow suit due to their metros, which favor nimble commuting modes. Mumbai’s parking premiums tilt commuters toward scooters, while Pune’s engineering colleges supply R&D talent to Bajaj and emerging EV ventures. Karnataka’s Bengaluru tech economy fuels premium motorcycle and electric scooter demand, and the state offers 15% capital subsidy for new EV plants, luring both domestic and overseas brands seeking India entry.
Competitive Landscape
The market strikes a balance between established scale and emerging innovation. Leading brands such as Hero MotoCorp, Honda, and TVS Motor dominate the market, leveraging extensive dealer networks and offering affordable parts. At the same time, they are investing heavily in electric R&D to defend leadership positions. Recent product launches, such as Honda’s Activa Electric and TVS’s iQube refresh, illustrate this strategic pivot, even as traditional ICE models generate strong cash flows.
New-age players Ola Electric and Ather Energy exploit software-defined vehicles, OTA updates, and subscription batteries to lure tech-savvy buyers. Ola’s move to own battery cell plants aims for cost parity, while Ather bundles fast-charging grids to lock users into proprietary networks. Battery Smart and SUN Mobility extend their reach beyond manufacturing to include swapping infrastructure, positioning themselves as ecosystem orchestrators rather than pure hardware sellers.
International brands like Yamaha and Suzuki refresh mid-premium segments, and Royal Enfield readies an electric classic line for 2026. Meanwhile, fintech tie-ups such as HDFC’s GIGA create embedded credit, binding buyers to specific OEMs at the financing stage. Competitive intensity will thus hinge on technology stack control, distribution agility, and the ability to offer integrated energy and financing solutions across the urban and rural two-wheeler market zones in India.
India Two Wheeler Industry Leaders
Bajaj Auto Ltd.
Hero MotoCorp Ltd.
Suzuki Motorcycle India Pvt. Ltd.
TVS Motor Company Limited
Honda Motorcycle and Scooter India Pvt. Ltd.
- *Disclaimer: Major Players sorted in no particular order

Recent Industry Developments
- October 2025: Tata Motors is set to unveil a new 125cc motorcycle. If this launch proceeds, it could significantly alter India's commuter motorcycle market, intensifying competition with established giants such as Hero MotoCorp, Honda Motorcycle & Scooter India, and Bajaj Auto.
- November 2024: By March 2026, Honda Power Pack Energy India Pvt Ltd (HEID), Honda Motor's battery-swapping service subsidiary, aims to establish 500 battery-swapping stations in Bangalore, Delhi, and Mumbai. This initiative is part of Honda's broader strategy to promote electric mobility and address the growing demand for efficient energy solutions in urban areas. The battery-swapping stations will cater to electric two-wheelers and three-wheelers, providing a convenient and time-saving alternative to traditional charging methods.
- August 2024: Mooving, a smart swapping network powered by Livguard and a brand under the SAR Group, has partnered with Hindustan Petroleum to establish battery swapping stations at more than 22,000 HPCL retail outlets nationwide. This collaboration aims to enhance the electric vehicle (EV) ecosystem in India by providing a convenient and efficient solution for EV users. The initiative is expected to support the growing demand for EV infrastructure and contribute to the country's transition toward sustainable mobility.


India Two Wheeler Market Report Scope
The India Two-Wheeler Market Report is Segmented by Vehicle Type (Motorcycles and Scooters), Propulsion (ICE and Electric), Engine Capacity/Motor Power (Up To 110cc, and More), Price Band (Up To USD 1, 000, and More), End User (B2C and B2B), Sales Channel (Online and Offline), and by State. The Market Forecasts are Provided in Terms of Value (USD) and Volume (Units).
By Vehicle Type
| Motorcycles |
| Scooters |
By Propulsion
| Internal Combustion Engine |
| Electric |
By Engine Capacity / Motor Power
| Internal Combustion Engine | Up to110 cc |
| 111-125 cc | |
| 126-150 cc | |
| 151-200 cc | |
| 201-250 cc | |
| 250-350 cc | |
| 350-500 cc | |
| Above 500 cc | |
| Electric | Up to 1.0 kW |
| 1.1-3.0 kW | |
| 3.1-5.0 kW | |
| Above 5.0 kW |
By Price Band
| Up to USD 1,000 |
| USD 1,000-1,500 |
| USD 1,501-2,000 |
| USD 2,001-3,000 |
| USD 3,001-5,000 |
| Above USD 5,000 |
By End User
| B2C | |
| B2B | Ride-hail / Bike-Taxi / Rental / Tourism |
| Delivery and Logistics | |
| Corporate and SME Fleets | |
| Others (Govt, Institutional, NGO) |
Sales Channel
| Online |
| Offline |
By State
| Uttar Pradesh |
| Maharashtra |
| Tamil Nadu |
| Karnataka |
| Gujarat |
| Rajasthan |
| Andhra Pradesh |
| Bihar |
| West Bengal |
| Telangana |
| Kerala |
| Madhya Pradesh |
| Haryana |
| Punjab |
| Delhi |
| Rest of India |
| By Vehicle Type | Motorcycles | |
| Scooters | ||
| By Propulsion | Internal Combustion Engine | |
| Electric | ||
| By Engine Capacity / Motor Power | Internal Combustion Engine | Up to110 cc |
| 111-125 cc | ||
| 126-150 cc | ||
| 151-200 cc | ||
| 201-250 cc | ||
| 250-350 cc | ||
| 350-500 cc | ||
| Above 500 cc | ||
| Electric | Up to 1.0 kW | |
| 1.1-3.0 kW | ||
| 3.1-5.0 kW | ||
| Above 5.0 kW | ||
| By Price Band | Up to USD 1,000 | |
| USD 1,000-1,500 | ||
| USD 1,501-2,000 | ||
| USD 2,001-3,000 | ||
| USD 3,001-5,000 | ||
| Above USD 5,000 | ||
| By End User | B2C | |
| B2B | Ride-hail / Bike-Taxi / Rental / Tourism | |
| Delivery and Logistics | ||
| Corporate and SME Fleets | ||
| Others (Govt, Institutional, NGO) | ||
| Sales Channel | Online | |
| Offline | ||
| By State | Uttar Pradesh | |
| Maharashtra | ||
| Tamil Nadu | ||
| Karnataka | ||
| Gujarat | ||
| Rajasthan | ||
| Andhra Pradesh | ||
| Bihar | ||
| West Bengal | ||
| Telangana | ||
| Kerala | ||
| Madhya Pradesh | ||
| Haryana | ||
| Punjab | ||
| Delhi | ||
| Rest of India | ||


Market Definition
- Vehicle Type - The category covers motorized two-wheelers.
- Vehicle Body Type - This includes Scooters and Motorcycles, while Kick-scooters and Bicycles are excluded.
- Fuel Category - Coverage extends to vehicles powered by Internal Combustion Engines (ICE) and electric propulsion systems.
| Keyword | Definition |
|---|---|
| Electric Vehicle (EV) | A vehicle which uses one or more electric motors for propulsion. Includes cars, buses, and trucks. This term includes all-electric vehicles or battery electric vehicles and plug-in hybrid electric vehicles. |
| BEV | A BEV relies completely on a battery and a motor for propulsion. The battery in the vehicle must be charged by plugging it into an outlet or public charging station. BEVs do not have an ICE and hence are pollution-free. They have a low cost of operation and reduced engine noise as compared to conventional fuel engines. However, they have a shorter range and higher prices than their equivalent gasoline models. |
| PEV | A plug-in electric vehicle is an electric vehicle that can be externally charged and generally includes all-electric vehicles as well as plug-in hybrids. |
| Plug-in Hybrid EV | A vehicle that can be powered either by an ICE or an electric motor. In contrast to normal hybrid EVs, they can be charged externally. |
| Internal combustion engine | An engine in which the burning of fuels occurs in a confined space called a combustion chamber. Usually run with gasoline/petrol or diesel. |
| Hybrid EV | A vehicle powered by an ICE in combination with one or more electric motors that use energy stored in batteries. These are continually recharged with power from the ICE and regenerative braking. |
| Commercial Vehicles | Commercial vehicles are motorized road vehicles designed for transporting people or goods. The category includes light commercial vehicles (LCVs) and medium and heavy-duty vehicles (M&HCV). |
| Passenger Vehicles | Passenger cars are electric motor– or engine-driven vehicles with at least four wheels. These vehicles are used for the transport of passengers and comprise no more than eight seats in addition to the driver’s seat. |
| Light Commercial Vehicles | Commercial vehicles that weigh less than 6,000 lb (Class 1) and in the range of 6,001–10,000 lb (Class 2) are covered under this category. |
| M&HDT | Commercial vehicles that weigh in the range of 10,001–14,000 lb (Class 3), 14,001–16,000 lb (Class 4), 16,001–19,500 lb (Class 5), 19,501–26,000 lb (Class 6), 26,001–33,000 lb (Class 7) and above 33,001 lb (Class 8) are covered under this category. |
| Bus | A mode of transportation that typically refers to a large vehicle designed to carry passengers over long distances. This includes transit bus, school bus, shuttle bus, and trolleybuses. |
| Diesel | It includes vehicles that use diesel as their primary fuel. A diesel engine vehicle have a compression-ignited injection system rather than the spark-ignited system used by most gasoline vehicles. In such vehicles, fuel is injected into the combustion chamber and ignited by the high temperature achieved when gas is greatly compressed. |
| Gasoline | It includes vehicles that use gas/petrol as their primary fuel. A gasoline car typically uses a spark-ignited internal combustion engine. In such vehicles, fuel is injected into either the intake manifold or the combustion chamber, where it is combined with air, and the air/fuel mixture is ignited by the spark from a spark plug. |
| LPG | It includes vehicles that use LPG as their primary fuel. Both dedicated and bi-fuel LPG vehicles are considered under the scope of the study. |
| CNG | It includes vehicles that use CNG as their primary fuel. These are vehicles that operate like gasoline-powered vehicles with spark-ignited internal combustion engines. |
| HEV | All the electric vehicles that use batteries and an internal combustion engine (ICE) as their primary source for propulsion are considered under this category. HEVs generally use a diesel-electric powertrain and are also known as hybrid diesel-electric vehicles. An HEV converts the vehicle momentum (kinetic energy) into electricity that recharges the battery when the vehicle slows down or stops. The battery of HEV cannot be charged using plug-in devices. |
| PHEV | PHEVs are powered by a battery as well as an ICE. The battery can be charged through either regenerative breaking using the ICE or by plugging into some external charging source. PHEVs have a better range than BEVs but are comparatively less eco-friendly. |
| Hatchback | These are compact-sized cars with a hatch-type door provided at the rear end. |
| Sedan | These are usually two- or four-door passenger cars, with a separate area provided at the rear end for luggage. |
| SUV | Popularly known as SUVs, these cars come with four-wheel drive, and usually have high ground clearance. These cars can also be used as off-road vehicles. |
| MPV | These are multi-purpose vehicles (also called minivans) designed to carry a larger number of passengers. They carry between five and seven people and have room for luggage too. They are usually taller than the average family saloon car, to provide greater headroom and ease of access, and they are usually front-wheel drive. |


Research Methodology
Mordor Intelligence follows a four-step methodology in all its reports.
- Step-1: Identify Key Variables: To build a robust forecasting methodology, the variables and factors identified in Step-1 are tested against available historical market numbers. Through an iterative process, the variables required for market forecast are set and the model is built based on these variables.
- Step-2: Build a Market Model: Market-size estimations for the historical and forecast years have been provided in revenue and volume terms. Market revenue is calculated by multiplying the sales volume with their respective average selling price (ASP). While estimating ASP factors like average inflation, market demand shift, manufacturing cost, technological advancement, and varying consumer preference, among others have been taken into account.
- Step-3: Validate and Finalize: In this important step, all market numbers, variables, and analyst calls are validated through an extensive network of primary research experts from the market studied. The respondents are selected across levels and functions to generate a holistic picture of the market studied.
- Step-4: Research Outputs: Syndicated Reports, Custom Consulting Assignments, Databases & Subscription Platforms.


