Market Overview
| Study Period | 2020 - 2031 |
|---|---|
| Forecast Data Period | 2026 - 2031 |
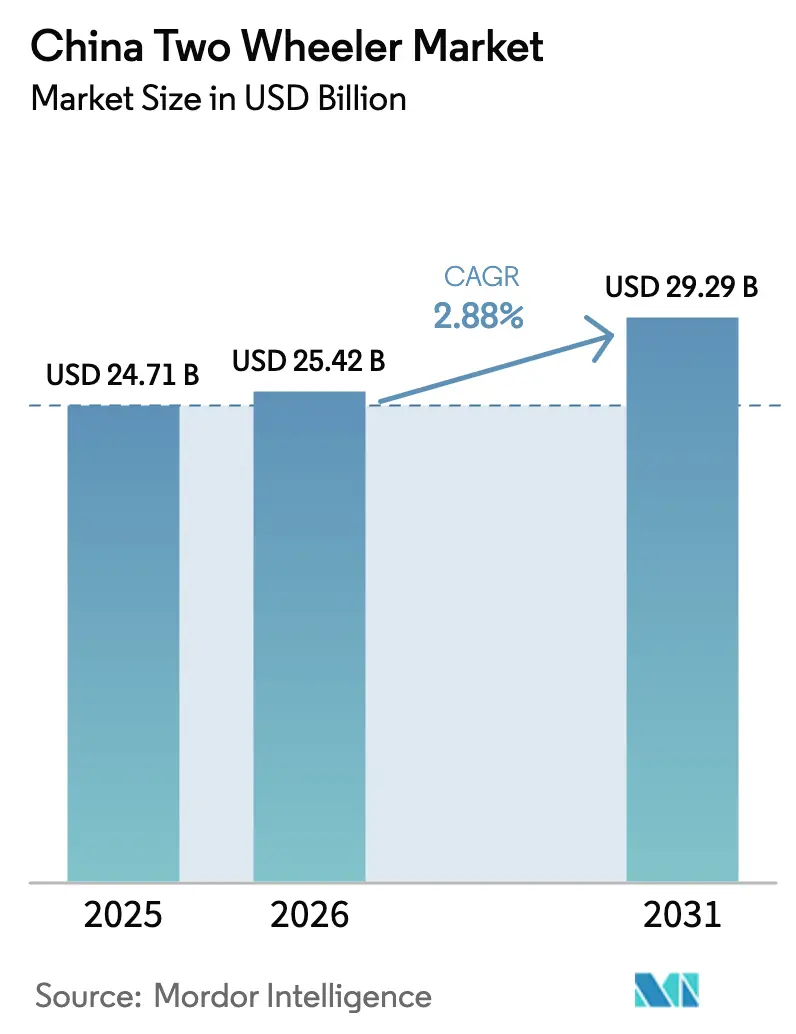
| Base Year Market Size (2025) | USD 24.71 Billion |
| Market Size (2026) | USD 25.42 Billion |
| Market Size (2031) | USD 29.29 Billion |
| Growth Rate (2026 - 2031) | 2.88% CAGR |
| Market Concentration | Medium |
Major Players *Disclaimer: Major Players sorted in no particular order Image © Mordor Intelligence. Reuse requires attribution under CC BY 4.0. | |
China Two Wheeler Market Analysis by Mordor Intelligence
China two-wheeler market size in 2026 is estimated at USD 25.42 billion, growing from 2025 value of USD 24.71 billion with 2031 projections showing USD 29.29 billion, growing at 2.88% CAGR over 2026-2031. Expansion is driven mainly by owners upgrading to safer, more capable machines, while electrification and tighter safety rules reshape competitive strategy[1]“China Two-Wheeler Production and Sales Bulletin 2025,”, Ministry of Industry and Information Technology, miit.gov.cn. East China retains the most extensive customer base because of dense cities and mature supply chains. Yet, Southwest China posts the fastest volume gains as infrastructure investments open hilly terrain to electric mobility. Motorcycles stay dominant for mixed-use transport, but scooters and electric variants outpace them in growth as commuters favor compact frames and subsidy-eligible batteries. Price sensitivity remains acute—three-quarters of deliveries are still below USD 1,000—but gradual premiumization is visible in the USD 1,501-2,000 bracket where riders pay for lithium packs, connected dashboards, and brand reliability.
Key Report Takeaways
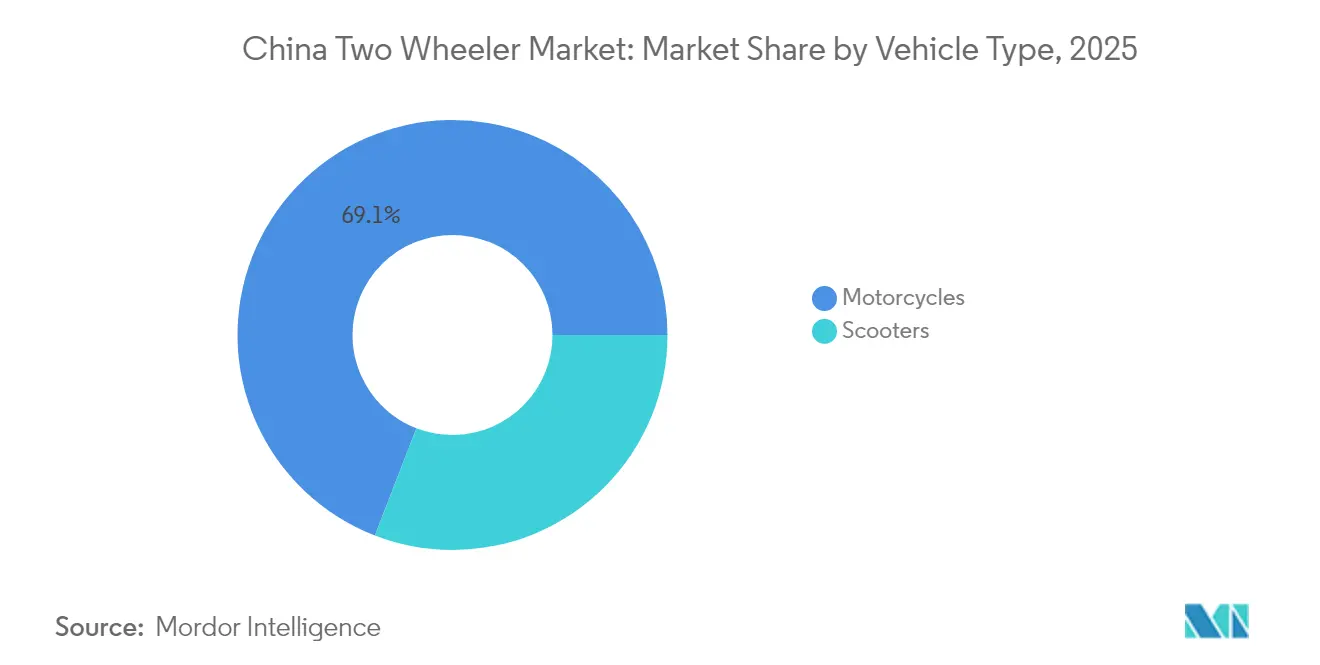
- By vehicle type, motorcycles led the China two-wheeler market, accounting for 69.12% of the market size in 2025; scooters are forecast to grow at a 4.12% CAGR through 2031.
- By propulsion, ICE models accounted for 71.84% of the China two-wheeler market size in 2025, and electric variants are set to rise at a 7.05% CAGR during 2026-2031.
- By engine capacity/motor power, up-to-110 cc models held 43.78% of the China two-wheeler market size in 2025, whereas the above-5.0 kW electric category is expected to advance at a 4.29% CAGR to 2031.
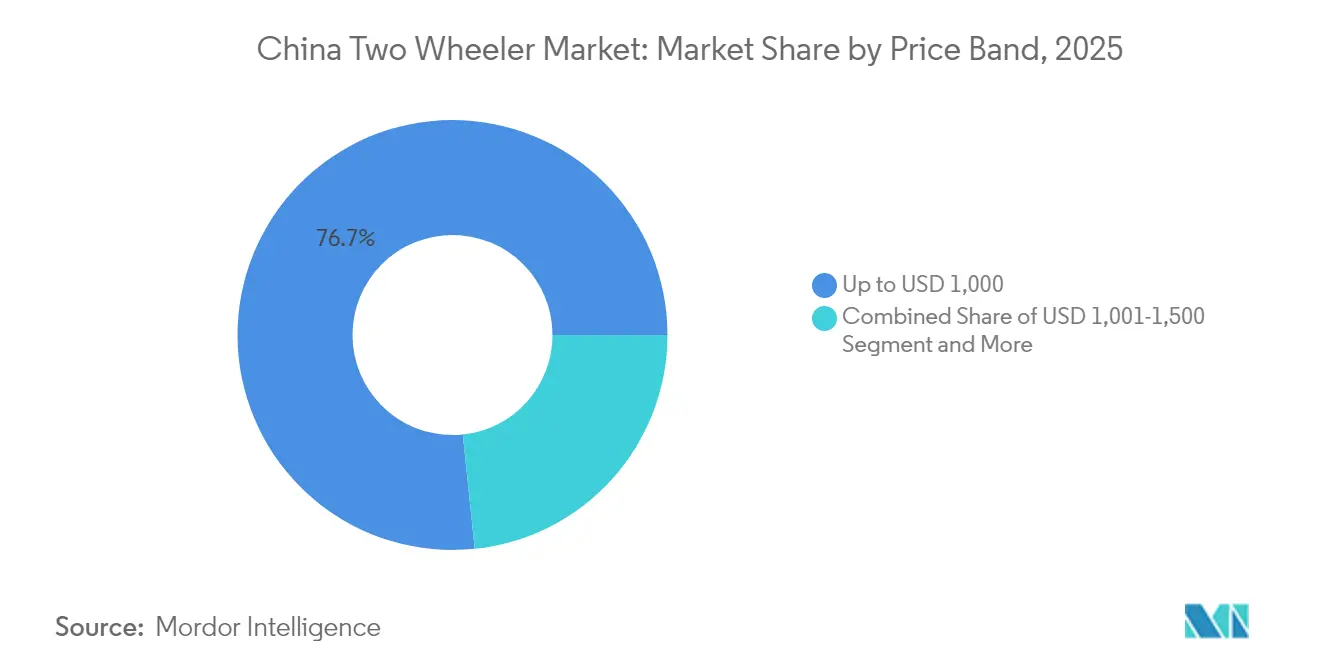
- By price band, sub-USD 1,000 units accounted for 76.65% of the China two-wheeler market size in 2025, while the USD 1,501-2,000 bracket is expected to grow at a 4.55% CAGR over the forecast period.
- By end user, B2C riders captured 68.73% of the China two-wheeler market size in 2025, and delivery fleets are projected to grow at a 3.84% CAGR through 2031.
- By sales channel, offline showrooms controlled 83.62% of the China two-wheeler market size in 2025, whereas online platforms are poised for a 4.15% CAGR through 2031.
- By region, East China accounted for 31.05% of the China two-wheeler market size in 2025, while Southwest China is projected to expand at a 3.66% CAGR through 2031.
Note: Market size and forecast figures in this report are generated using Mordor Intelligence’s proprietary estimation framework, updated with the latest available data and insights as of 2026.
China Two Wheeler Market Trends and Insights
Drivers Impact Analysis*
| Driver | (~) % Impact on CAGR Forecast | Geographic Relevance | Impact Timeline |
|---|---|---|---|
| Government E-2W Subsidies and Tax Exemptions | +1.2% | National, with concentrated benefits in tier-1 and tier-2 cities | Medium term (2-4 years) |
| Urban Congestion Boosting Last-Mile Demand | +0.8% | East China, South-Central China, North China urban centers | Long term (≥ 4 years) |
| E-Commerce Delivery Surge | +0.7% | National, with highest impact in East China and South-Central China | Medium term (2-4 years) |
| Low TCO Compared to Cars and Public Transit | +0.5% | National, particularly tier-3 and tier-4 cities | Long term (≥ 4 years) |
| Battery-Swapping Expansion in Tier-3/4 Cities | +0.4% | Southwest China, Northwest China, Northeast China | Long term (≥ 4 years) |
| AI Telematics Enhancing Fleet Utilization | +0.3% | National, concentrated in commercial fleet applications | Medium term (2-4 years) |
| Source: Mordor Intelligence | |||


Government e-2W Subsidies and Purchase-Tax Exemption
Incentive programs have slashed the retail prices of electric bikes, positioning them as a competitive alternative to internal combustion engine (ICE) vehicles, and doing so much sooner than fuel savings would allow. A spring 2024 trade-in initiative, embraced by numerous cities, is nudging consumers towards upgrading to newer, safer bike models. Meanwhile, regulatory shifts, especially the updated national battery safety standards, alter subsidy eligibility criteria[2]“Implementation of GB 43854-2024 Battery Standard,”, Beijing Legal Daily, bjlegaldaily.com. These revisions prioritize safety and compliance, redirecting financial support from generalized incentives to a more targeted approach, focusing on replacing outdated or non-compliant units.
Sensing the urgency as the window for government aid tightens, manufacturers are ramping up operations. However, regional policy rollout disparities mean companies strategically timing product launches to coincide with local funding windows. This has led to a quicker dissemination of technological advancements in the economically vibrant coastal regions, setting a benchmark for national adoption.
Urban Congestion Driving Last-mile Demand
In bustling cities such as Shanghai and Shenzhen, peak-hour traffic congestion has brought average vehicle speeds to a standstill. Amidst this backdrop, two-wheelers—particularly electric motorcycles and scooters—have emerged as the preferred choice for short-distance travel, often leaving vans in the dust. Their edge is heightened by policies exempting motorcycles from congestion charges, making them swifter and more economical. The surging instant-delivery sector, a linchpin of urban logistics, heavily leans on two-wheelers for their speed and adaptability. Moreover, the rising popularity of battery-swap services ensures riders enjoy seamless service throughout the day, sidestepping the hassle of home charging and boosting productivity.
Urban infrastructure is adapting to this two-wheeler dominance. Initiatives like dedicated curbside parking and exclusive lane pilot programs underscore the pivotal role of two-wheelers in last-mile delivery. Yet, while shared mobility solutions, such as dockless bikes, have made waves, they've fallen short for professional couriers. These couriers, needing greater payload capacity and reliability, find dockless bikes lacking.
E-commerce Delivery Boom
Parcel flow climbed in the first three quarters of 2025, creating structural demand for fleet-grade two-wheelers with reinforced frames and larger racks. Commercial buyers prioritize uptime, prompting the installation of battery-swap cabinets at merchant storefronts that reduce rider wait time to under one minute. Express operators specify Bluetooth locks and telematics for route optimization, while municipal incentives for zero-emission couriers give electric platforms preferred curb access. Autonomous robots remain in pilot scale, so human riders keep the edge on complex urban routes.
Low Total Cost of Ownership
Electric two-wheelers are rapidly gaining traction in China’s urban mobility landscape due to their cost efficiency, supportive policies, and evolving infrastructure. Incentive programs make them more affordable than internal combustion vehicles, while updated safety regulations steer subsidies toward compliant models, encouraging manufacturers to scale up quickly. In congested cities like Shanghai and Shenzhen, two-wheelers offer a speed advantage for short trips and are exempt from congestion charges. The booming instant-delivery sector relies on these vehicles, supported by battery-swap services that eliminate charging downtime. Infrastructure upgrades, such as curbside bays and dedicated lanes, reinforce their dominance, though shared fleets are less relevant for couriers with higher payload needs. Operational costs are lower than cars due to minimal servicing, waived registration for low-speed models, and subsidized electricity. Even with potential safety-related surcharges, such as helmet mandates and insurance, electric two-wheelers are expected to retain a cost advantage, appealing to both individual riders and commercial users.
Restraints Impact Analysis*
| Restraint | (~) % Impact on CAGR Forecast | Geographic Relevance | Impact Timeline |
|---|---|---|---|
| High Rider Accident and Fatality Rates | -0.6% | National, with highest impact in tier-1 and tier-2 cities | Short term (≤ 2 years) |
| Stricter Rules for Low-Speed E-Bike Classification | -0.5% | National, particularly affecting sub-25 km/h segment | Short term (≤ 2 years) |
| Lithium and Graphite Supply Chain Volatility | -0.4% | National manufacturing and import-dependent regions | Medium term (2-4 years) |
| Competition from Shared Micromobility Platforms | -0.3% | East China, South-Central China urban centers | Medium term (2-4 years |
| Source: Mordor Intelligence | |||
High Accident and Fatality Rates among Riders
Fire incidents linked to indoor battery charging topped 21,000 cases in 2023, prompting tougher inspections and CCC certification for every new e-bike system from November 2024. Injury rates remain 15-20 times higher than car occupants per kilometer. Municipal governments are piloting helmet mandates and dedicated lanes for electric two-wheelers, marking a move towards heightened safety oversight. Insurance firms are rolling out third-party coverage options, marginally bumping costs for swifter models. Manufacturers are shouldering increased production costs to align with new national standards on vehicle frames and battery safety. Although these adjustments increase expenses, they enhance consumer trust and underscore a market shift prioritizing safety and reliability.
Lithium and Graphite Supply-chain Volatility
Domestic manufacturers are taking strategic steps to counteract the volatility of lithium carbonate prices, which heavily influence the costs of battery packs and, consequently, electric vehicle production[3]“Lithium Price Volatility and OEM Countermeasures,”, Economic Observer, eeo.com.cn. These strategies include forming joint ventures for raw material extraction and exploring alternative technologies, such as sodium-ion batteries. While sodium-ion batteries reduce dependence on lithium, they present challenges in terms of energy performance. To shield themselves from the unpredictable swings of the spot market, manufacturers are turning to long-term supply contracts. However, they still grapple with disruptions caused by geopolitical tensions and logistical hurdles. While maintaining inventory buffers can offer some protection, it also ties up financial resources. This situation poses challenges for smaller players and accelerates market consolidation.
*Our forecasts treat driver/restraint impacts as directional, not additive. The impact forecasts reflect baseline growth, mix effects, and variable interactions.
Segment Analysis
By Vehicle Type: Motorcycles Hold Share, Scooters Gain Pace
Motorcycles account for 69.12% of the China two-wheeler market size in 2025, yet scooters are surging ahead at a 4.12% CAGR through 2031, thanks to step-through ergonomics that are favored in crowded streets. Large-displacement leisure bikes are expected to experience significant growth in early 2024, as rising incomes add weekend touring to the use-case mix. Digital clusters with AI voice assistants and OTA updates are now standard on mid-tier models, mirroring car dashboards. Rural riders keep motorcycles in front through fuel-tank range and robust frames, but in downtown cores, scooter parking privileges and automatic gearboxes are winning commuters.
Urban scooter uptake also benefits from local rules barring full-size motorcycles from central districts, tilting replacement cycles toward lighter frames. Brands package under-seat lithium packs and NFC start keys, pushing ASPs into the USD 1,501-2,000 band. Accessory revenue—from smart helmets to app subscriptions—deepens margins even as unit growth moderates in the mature motorcycle segment.


By Propulsion: Electric Momentum Builds
Internal combustion engines still account for 71.84% of the China two-wheeler market size in 2025, but electric vehicles are growing at a compound annual rate of 7.05% to 2031, as subsidies, charging networks, and emission zones expand. Sodium-ion prototypes from Yadea and Tailg debuted in 2024, offering 3,000-cycle life while trimming 10-15% off pack cost. Coastal cities are witnessing a rapid expansion of electric delivery fleets, driven by low operating costs and improved urban access. Meanwhile, rural regions rely heavily on gasoline vehicles, hindered by limited infrastructure and the need for further reductions in battery prices. This urban-rural disparity underscores the progress in electrification and the hurdles that still need to be addressed for a nationwide shift.
Electric vehicle manufacturers are addressing range anxiety by deploying battery swap stations and integrating real-time location tracking into their apps. Traditional internal combustion engine (ICE) makers are improving fuel efficiency and updating engines to meet stricter emissions standards, though tightening carbon regulations are shrinking their market. Hybrid vehicles remain a niche market due to their added complexity and the lack of subsidies.
By Engine Capacity/Motor Power: Entry-Level Still Rules
Units below 110 cc or 400 W hold 43.78% of the China two-wheeler market size in 2025, as first-time buyers and rural users seek low sticker prices and simple maintenance. However, the above 5 kW electric tier is the fastest climber, with a 4.29% CAGR through 2031, driven by performance enthusiasts and ride-hailing pilots. Sub-400 W e-bikes enjoy license-free status, sustaining volume, but premium commuters now pay for 5-kW hub motors that sprint to 80 km/h and integrate ABS.
Platform chassis enable factories to share frames and swing arms across output tiers, keeping costs down while tailoring motors and packs to local regulations. ICE engines in the 126-150 cc band remain popular for farm and small-business haulage, where torque and fuel range are more important than emissions or acceleration.
By Price Band: Budget Dominates, Mid-Market Blossoms
Up to USD 1,000 models captured 76.65% of the China two-wheeler market size in 2025 because volume from city buyers and rural households remains price-focused. Nonetheless, the USD 1,501-2,000 tier is experiencing a 4.55% CAGR as lithium packs and bright clusters drive ASPs higher. Trade-in vouchers encourage riders to retire non-compliant lead-acid bikes and step into safety-certified lithium-ion successors, typically priced above USD 1,200, thereby increasing the spending curve.
Premium brackets above USD 3,000 remain small, mainly comprising luxury gasoline tourers and imported electrics, but social media marketing is widening their aspirational appeal. Financing apps from leading OEMs deliver 12-month no-interest packages, easing budget riders into mid-market products without price sticker shock.
By End User: B2C Leads, B2B Surges
Personal ownership held 68.73% of the China two-wheeler market size in 2025; yet parcel couriers and food delivery fleets are projected to climb at a 3.84% CAGR through 2031. Fleet buyers demand rugged racks, theft-proof IoT locks, and swap-ready battery bays. In contrast, value, ease of parking, and smartphone integration continue to be consumer priorities.
Corporate HR programs now subsidize employee e-bike commuting as cities restrict car access, providing OEMs with volume orders and consistent specifications. Bike-taxi pilots in Hainan and Guangxi add another commercial slice but await regulatory clarity. Insurance bundling and predictive-maintenance software provide fleet managers with lifecycle cost control, solidifying electric vehicle preference in B2B procurement.
By Sales Channel: Showrooms Rule, Digital Scales
Dealerships still account for 83.62% of the China two-wheeler market size in 2025, as customers prefer physical test rides, finance counseling, and local service. Yet livestream-driven e-commerce is projected to post a 4.15% CAGR through 2031, led by NIU dealers who tripled their monthly sales after receiving training on Douyin and Kuaishou broadcasts in 2024. Manufacturers now feed real-time inventory to online storefronts, allowing buyers to lock in a VIN and pick up in-store, thereby merging digital convenience with after-sales confidence.
Urban digital-first buyers welcome doorstep delivery and on-site servicing vans, whereas rural customers rely on familiar shop owners for trust and parts stock. The hybrid model consolidates as OEMs equip dealers with CRM apps, online credit approval, and same-day fulfillment.
Geography Analysis
East China contributed 31.05% of the China two-wheeler market size in 2025, buoyed by clustered factories around Jiangsu, Zhejiang, and Shanghai that shorten lead times and cut logistics costs. Dense conurbations generate steady replacement demand, and stringent local standards prompt riders to opt for compliant electric models with connected features. Mature swap networks now cover over 90% of Shanghai’s downtown grid, reinforcing electric uptake.
South-Central China ranks second overall thanks to Guangdong’s export-oriented plants and 4,500 km of cycleways that lower riding barriers. Guangzhou aims to develop 6,000 km of greenways by 2025, and its port streamlines component imports, enabling OEMs to maintain low buffer stocks. The region also hosts major third-party battery assemblers, sustaining competitive pack pricing.
North China retains a significant slice through Beijing’s policy leadership and Tianjin’s component base, yet growth lags because winter temperatures cut battery range and tighter downtown motorcycle bans restrict usage. Subsidized heated battery enclosures are being trialed to address cold-weather degradation; however, ICE machines continue to maintain a share during cold months.
Southwest China is the fastest-growing region, with a 3.66% CAGR through 2031, as the Chongqing-Chengdu clusters attract investment in lightweight frame production suitable for mountainous roads. Provincial schemes finance swap cabinets in tier-3 cities where grid upgrade costs are lower than installing fast chargers. Two-wheeler ownership in this region still lags behind national averages, leaving ample room for growth.
The Northeast and Northwest provinces are smaller but strategically located. Rugged terrain favors high-torque ICE units for farm logistics, while regional governments use rural revitalization funds to subsidize e-bike purchases that connect villagers to township markets. Cold-proof battery chemistries under joint development with local universities could unlock latent demand.
Competitive Landscape
China's two-wheeler industry is consolidating, with a handful of dominant players emerging. Rising safety certification costs and the need for scale have made it increasingly challenging for smaller manufacturers to remain competitive. As a result, many have either exited the market or merged, significantly reshaping the competitive landscape. Leading companies have advanced, vertically integrated factories equipped with robotic welding and automated painting, which enable them to reduce labor costs significantly. Furthermore, by in-house assembly of battery packs, these companies strengthen their supply chains and enhance production efficiency, thereby solidifying their position in an ever-tightening market.
International expansion is now a key strategic move. Aima operates satellites in Vietnam and Thailand, hedging against trade barriers and diversifying FX revenue. NIU, a smaller yet highly digital company, boosts its gross margin with software subscriptions and remote diagnostics.
Technological arms races center on telematics chips, battery chemistries, and OTA firmware. Partnerships with domestic AI startups bring voice control and theft alerts, while joint labs with cell suppliers aim to commercialize sodium-ion packs before 2026. Capital intensity is rising; battery-swap operator Yugukejia delayed its IPO after margin erosion underscored payback-period risks.
China Two Wheeler Industry Leaders
Loncin Motor Co. Ltd.
Sundiro Honda Motorcycle Co., Ltd.
Chongqing Zongshen Industrial Group Co., Ltd.
Yadea Group Holdings Ltd.
Jiangmen Dachangjiang Group Co., Ltd. (Haojue)
- *Disclaimer: Major Players sorted in no particular order


Recent Industry Developments
- May 2025: Honda, in collaboration with its local partner Wuyang-Honda, has officially unveiled the E-VO, its inaugural electric motorcycle, in the Chinese market. The E-VO seamlessly merges the classic aesthetics of a retro cafe racer with cutting-edge technology and performance.
- January 2025: Yadea, a global frontrunner in electric two-wheelers, recently held a major launch event in Hangzhou, China. At the event, Yadea unveiled its latest electric two-wheeler, now powered by the company's pioneering sodium battery technology. This new electric two-wheeler, featuring the advanced sodium battery, marks a significant leap in battery innovation, steering the industry closer to enhanced efficiency and sustainability.


China Two Wheeler Market Report Scope
The China Two-Wheeler Market Report is Segmented by Vehicle Type (Motorcycles and Scooters), Propulsion (ICE and Electric), Engine Capacity/Motor Power (Up To 110cc, and More), Price Band (Up To USD 1, 000, and More), End User (B2C and B2B), Sales Channel (Online and Offline), and by Region. The Market Forecasts are Provided in Terms of Value (USD) and Volume (Units).
By Vehicle Type
| Motorcycles |
| Scooters |
By Propulsion
| Internal Combustion Engine |
| Electric |
By Engine Capacity / Motor Power
| Internal Combustion Engine | Up to 110 cc |
| 111-125 cc | |
| 126-150 cc | |
| 151-200 cc | |
| 201-250 cc | |
| 250-350 cc | |
| 350-500 cc | |
| Above 500 cc | |
| Electric | Up to 1.0 kW |
| 1.1-3.0 kW | |
| 3.1-5.0 kW | |
| Above 5.0 kW |
By Price Band
| Up to USD 1,000 |
| USD 1,000-1,500 |
| USD 1,501-2,000 |
| USD 2,001-3,000 |
| USD 3,001-5,000 |
| Above USD 5,000 |
By End User
| B2C | |
| B2B | Ride-hail / Bike-Taxi / Rental / Tourism |
| Delivery and Logistics | |
| Corporate and SME Fleets | |
| Others (Govt., NGO, Institutional) |
Sales Channel
| Online |
| Offline |
By Region
| East China |
| South-Central China |
| North China |
| Northeast China |
| Southwest China |
| Northwest China |
| By Vehicle Type | Motorcycles | |
| Scooters | ||
| By Propulsion | Internal Combustion Engine | |
| Electric | ||
| By Engine Capacity / Motor Power | Internal Combustion Engine | Up to 110 cc |
| 111-125 cc | ||
| 126-150 cc | ||
| 151-200 cc | ||
| 201-250 cc | ||
| 250-350 cc | ||
| 350-500 cc | ||
| Above 500 cc | ||
| Electric | Up to 1.0 kW | |
| 1.1-3.0 kW | ||
| 3.1-5.0 kW | ||
| Above 5.0 kW | ||
| By Price Band | Up to USD 1,000 | |
| USD 1,000-1,500 | ||
| USD 1,501-2,000 | ||
| USD 2,001-3,000 | ||
| USD 3,001-5,000 | ||
| Above USD 5,000 | ||
| By End User | B2C | |
| B2B | Ride-hail / Bike-Taxi / Rental / Tourism | |
| Delivery and Logistics | ||
| Corporate and SME Fleets | ||
| Others (Govt., NGO, Institutional) | ||
| Sales Channel | Online | |
| Offline | ||
| By Region | East China | |
| South-Central China | ||
| North China | ||
| Northeast China | ||
| Southwest China | ||
| Northwest China | ||


Market Definition
- Vehicle Type - The category covers motorized two-wheelers.
- Vehicle Body Type - This includes Scooters and Motorcycles, while Kick-scooters and Bicycles are excluded.
- Fuel Category - Coverage extends to vehicles powered by Internal Combustion Engines (ICE) and electric propulsion systems.
| Keyword | Definition |
|---|---|
| Electric Vehicle (EV) | A vehicle which uses one or more electric motors for propulsion. Includes cars, buses, and trucks. This term includes all-electric vehicles or battery electric vehicles and plug-in hybrid electric vehicles. |
| BEV | A BEV relies completely on a battery and a motor for propulsion. The battery in the vehicle must be charged by plugging it into an outlet or public charging station. BEVs do not have an ICE and hence are pollution-free. They have a low cost of operation and reduced engine noise as compared to conventional fuel engines. However, they have a shorter range and higher prices than their equivalent gasoline models. |
| PEV | A plug-in electric vehicle is an electric vehicle that can be externally charged and generally includes all-electric vehicles as well as plug-in hybrids. |
| Plug-in Hybrid EV | A vehicle that can be powered either by an ICE or an electric motor. In contrast to normal hybrid EVs, they can be charged externally. |
| Internal combustion engine | An engine in which the burning of fuels occurs in a confined space called a combustion chamber. Usually run with gasoline/petrol or diesel. |
| Hybrid EV | A vehicle powered by an ICE in combination with one or more electric motors that use energy stored in batteries. These are continually recharged with power from the ICE and regenerative braking. |
| Commercial Vehicles | Commercial vehicles are motorized road vehicles designed for transporting people or goods. The category includes light commercial vehicles (LCVs) and medium and heavy-duty vehicles (M&HCV). |
| Passenger Vehicles | Passenger cars are electric motor– or engine-driven vehicles with at least four wheels. These vehicles are used for the transport of passengers and comprise no more than eight seats in addition to the driver’s seat. |
| Light Commercial Vehicles | Commercial vehicles that weigh less than 6,000 lb (Class 1) and in the range of 6,001–10,000 lb (Class 2) are covered under this category. |
| M&HDT | Commercial vehicles that weigh in the range of 10,001–14,000 lb (Class 3), 14,001–16,000 lb (Class 4), 16,001–19,500 lb (Class 5), 19,501–26,000 lb (Class 6), 26,001–33,000 lb (Class 7) and above 33,001 lb (Class 8) are covered under this category. |
| Bus | A mode of transportation that typically refers to a large vehicle designed to carry passengers over long distances. This includes transit bus, school bus, shuttle bus, and trolleybuses. |
| Diesel | It includes vehicles that use diesel as their primary fuel. A diesel engine vehicle have a compression-ignited injection system rather than the spark-ignited system used by most gasoline vehicles. In such vehicles, fuel is injected into the combustion chamber and ignited by the high temperature achieved when gas is greatly compressed. |
| Gasoline | It includes vehicles that use gas/petrol as their primary fuel. A gasoline car typically uses a spark-ignited internal combustion engine. In such vehicles, fuel is injected into either the intake manifold or the combustion chamber, where it is combined with air, and the air/fuel mixture is ignited by the spark from a spark plug. |
| LPG | It includes vehicles that use LPG as their primary fuel. Both dedicated and bi-fuel LPG vehicles are considered under the scope of the study. |
| CNG | It includes vehicles that use CNG as their primary fuel. These are vehicles that operate like gasoline-powered vehicles with spark-ignited internal combustion engines. |
| HEV | All the electric vehicles that use batteries and an internal combustion engine (ICE) as their primary source for propulsion are considered under this category. HEVs generally use a diesel-electric powertrain and are also known as hybrid diesel-electric vehicles. An HEV converts the vehicle momentum (kinetic energy) into electricity that recharges the battery when the vehicle slows down or stops. The battery of HEV cannot be charged using plug-in devices. |
| PHEV | PHEVs are powered by a battery as well as an ICE. The battery can be charged through either regenerative breaking using the ICE or by plugging into some external charging source. PHEVs have a better range than BEVs but are comparatively less eco-friendly. |
| Hatchback | These are compact-sized cars with a hatch-type door provided at the rear end. |
| Sedan | These are usually two- or four-door passenger cars, with a separate area provided at the rear end for luggage. |
| SUV | Popularly known as SUVs, these cars come with four-wheel drive, and usually have high ground clearance. These cars can also be used as off-road vehicles. |
| MPV | These are multi-purpose vehicles (also called minivans) designed to carry a larger number of passengers. They carry between five and seven people and have room for luggage too. They are usually taller than the average family saloon car, to provide greater headroom and ease of access, and they are usually front-wheel drive. |


Research Methodology
Mordor Intelligence follows a four-step methodology in all its reports.
- Step-1: Identify Key Variables: To build a robust forecasting methodology, the variables and factors identified in Step-1 are tested against available historical market numbers. Through an iterative process, the variables required for market forecast are set and the model is built based on these variables.
- Step-2: Build a Market Model: Market-size estimations for the historical and forecast years have been provided in revenue and volume terms. Market revenue is calculated by multiplying the sales volume with their respective average selling price (ASP). While estimating ASP factors like average inflation, market demand shift, manufacturing cost, technological advancement, and varying consumer preference, among others have been taken into account.
- Step-3: Validate and Finalize: In this important step, all market numbers, variables, and analyst calls are validated through an extensive network of primary research experts from the market studied. The respondents are selected across levels and functions to generate a holistic picture of the market studied.
- Step-4: Research Outputs: Syndicated Reports, Custom Consulting Assignments, Databases & Subscription Platforms.


