Europe Two-Wheeler Market Size and Share
Market Overview
| Study Period | 2019 - 2031 |
|---|---|
| Forecast Data Period | 2026 - 2031 |
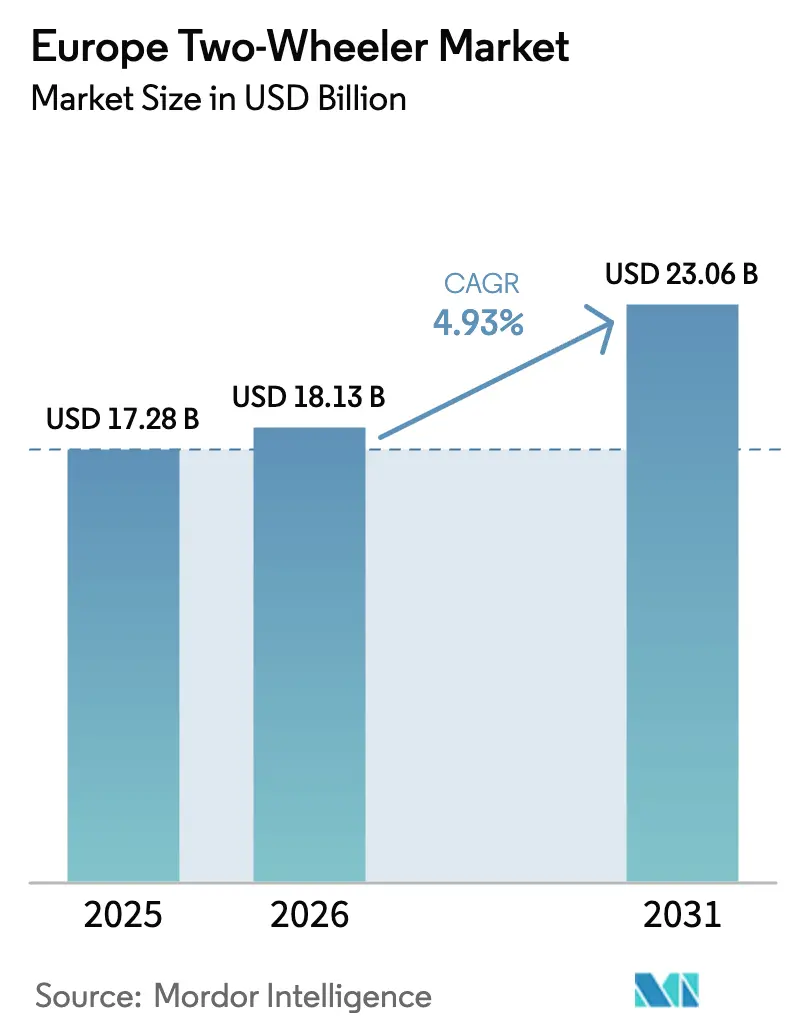
| Base Year Market Size (2025) | USD 17.28 Billion |
| Market Size (2026) | USD 18.13 Billion |
| Market Size (2031) | USD 23.06 Billion |
| Growth Rate (2026 - 2031) | 4.93% CAGR |
| Market Concentration | Medium |
Major Players *Disclaimer: Major Players sorted in no particular order Image © Mordor Intelligence. Reuse requires attribution under CC BY 4.0. | |
Europe Two-Wheeler Market Analysis by Mordor Intelligence
The European two-wheeler Market size was valued at USD 17.28 billion in 2025 and is estimated to grow from USD 18.13 billion in 2026 to reach USD 23.06 billion by 2031, at a CAGR of 4.93% during the forecast period (2026-2031). After a surge in purchases due to the Euro 5+ pre-buy wave, demand is recalibrating. This surge, which pulled purchases forward, has temporarily softened volumes. However, as premiumization and electrification continue to rise, average selling prices are rising. Factors such as stringent urban low-emission regulations, the growth of last-mile e-commerce, and the establishment of battery-swap infrastructure are influencing shifts in both product mix and powertrain choices. Established brands are adapting with modular platforms and electronics ready for over-the-air updates. Meanwhile, new Chinese electric entrants are intensifying price competition. While fluctuations in lithium prices, rising insurance costs for younger riders, and caps on shared scooters present challenges, they haven't derailed the industry's steady progression towards a future of connected and service-oriented mobility.
Key Report Takeaways
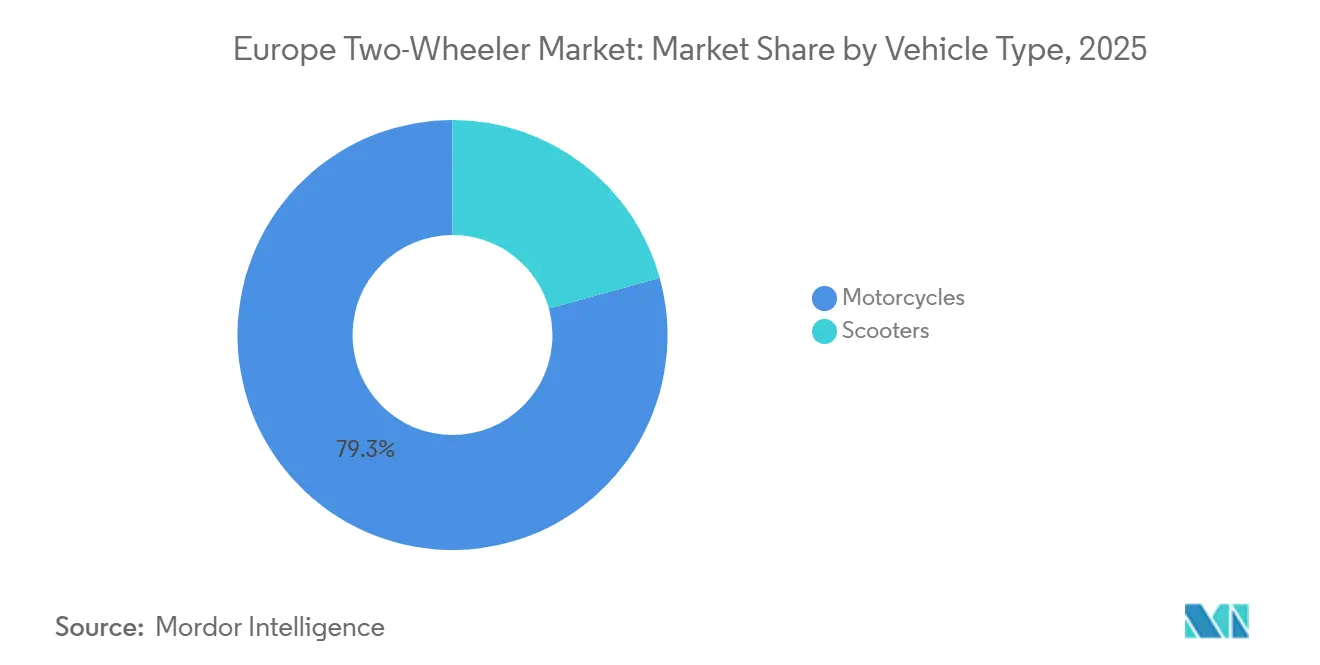
- By vehicle type, motorcycles led with 79.28% of the European two-wheeler market share in 2025, while scooters are forecast to post the fastest 7.32% CAGR through 2031.
- By propulsion, internal-combustion units dominated at 89.21% in 2025, yet electric two-wheelers will expand at an 8.13% CAGR to 2031.
- By engine capacity/motor power, the 126-150 cc bracket captured 30.02% of 2025 revenue; the 1.1–3.0 kW electric class is advancing at a 7.31% CAGR.
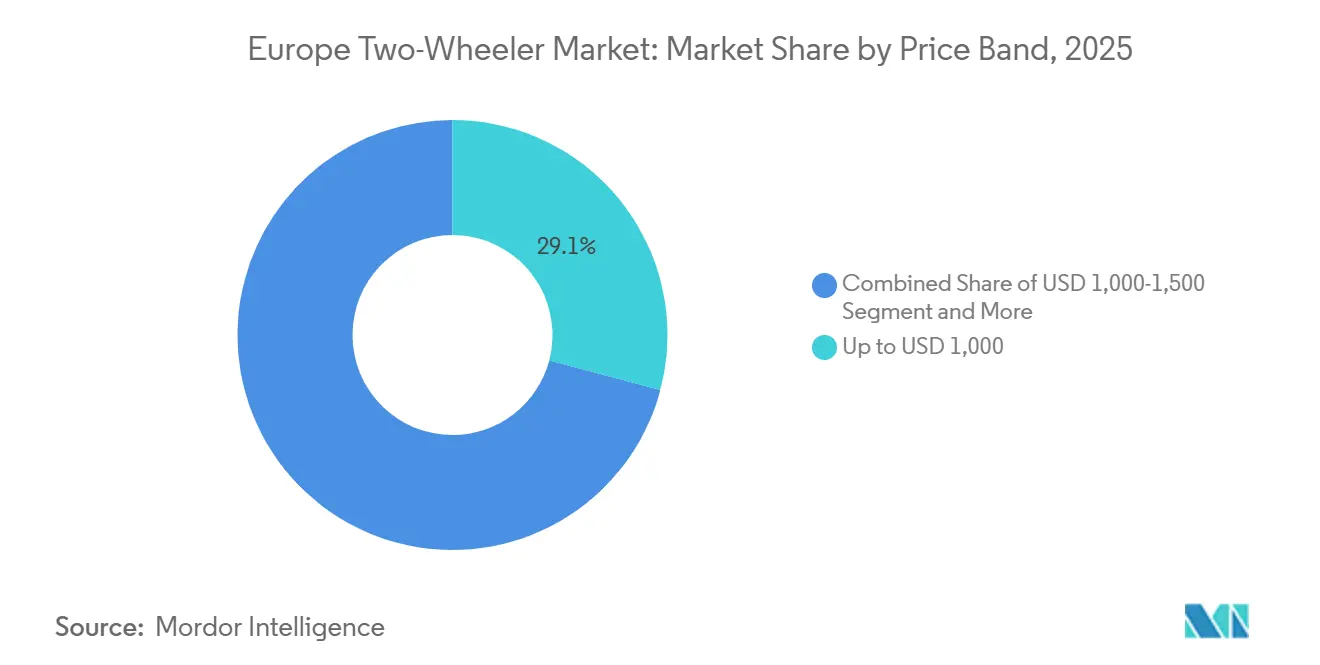
- By price band, the up to USD 1,000 segment accounted for 29.12% in 2025, whereas the USD 3,001–5,000 band is set to grow at a 7.77% CAGR.
- By end user, B2C purchases accounted for 81.36% in 2025, but B2B delivery fleets are projected to grow at an 8.16% CAGR.
- By sales channel, offline outlets accounted for 71.87% of 2025 sales; online transactions will grow at a 7.28% CAGR.
- By geography, Italy generated 28.31% of 2025 revenue, whereas Spain is on track for the fastest 6.28% CAGR.
Note: Market size and forecast figures in this report are generated using Mordor Intelligence’s proprietary estimation framework, updated with the latest available data and insights as of 2026.
Europe Two-Wheeler Market Trends and Insights
Drivers Impact Analysis*
| Driver | (~) % Impact on CAGR Forecast | Geographic Relevance | Impact Timeline |
|---|---|---|---|
| E-Commerce Fleet Growth | +1.2% | Urban EU hubs, notably Germany, France, UK | Medium term (2-4 years) |
| Pre-Buy Triggered by Euro 5+ Shift | +0.8% | Germany, France, Italy, Netherlands | Short term (≤ 2 years) |
| EU Battery Funding (Net-Zero Act) | +0.7% | Germany, France, Poland, Czech Republic | Long term (≥ 4 years) |
| Battery-Swap Models | +0.6% | Italy, Spain, France, Netherlands | Medium term (2-4 years) |
| Modular OEM Platforms | +0.5% | Germany, Italy | Short term (≤ 2 years) |
| Youth Demand for Mobility Subscriptions | +0.4% | Nordics, Germany, Netherlands | Long term (≥ 4 years) |
| Source: Mordor Intelligence | |||


Rapid Expansion of E-Commerce Delivery Fleets Demanding Low-TCO 2Ws
Online shopping’s rise places two-wheelers at the heart of last-mile logistics, driving growth in the Europe Two-Wheeler Market; Amazon’s network of over 13,000 European delivery partners in 2024 typifies the scale. Last-mile parcel volumes have been increasing significantly, with couriers typically covering considerable distances per shift. Electric scooters have drastically reduced energy costs per kilometer compared to petrol and have also cut maintenance frequency. Pilot initiatives by Glovo and Deliveroo in key cities have achieved notable savings in operating expenses. While fixed-route operators prefer depot chargers, gig couriers rely on public or swappable solutions. For example, Swobbee operates swap kiosks in major cities, enabling quick exchanges that keep fleets operational for extended hours daily. Cities are enhancing these economic benefits; for instance, Milan’s Area B offers unrestricted access, saving operators substantial annual congestion-fee savings.
Euro 5+ Emission Shift Triggering Pre-Buy and Model Refresh
The enforcement of Euro 5+ standards increased per-unit compliance costs, a burden swiftly transferred to consumers. ACEM experienced a significant increase in registrations as dealers offered discounts on outgoing stock, creating a volume gap in the subsequent period. Honda and Yamaha introduced several updated models, incorporating advanced ride-by-wire throttles and lean-angle sensors designed for future software upgrades. Residual values diverged as older Euro 4 bikes depreciated more rapidly within expanding low-emission zones, prompting cost-conscious riders to opt for certified pre-owned Euro 5+ units. Furthermore, mandatory onboard diagnostics under Regulation 168/2013 now provide usage data, enabling insurers to implement telematics-based pricing [1]“Regulation (EU) 168/2013 on L-Category Vehicles,”, European Parliament, europarl.europa.eu.
Battery-Swap Business Models Lowering Up-Front EV Cost for Urban Users
Electric scooters command a premium over their ICE counterparts. However, battery-as-a-service plans reduce initial costs, shifting energy expenses to a manageable monthly fee. The Swappable Batteries Motorcycle Consortium standardized battery packs and established interoperable stations across multiple countries[2]“Sustainability Report 2025,”, Glovo, glovoapp.com. This shared infrastructure enhances utilization: early pilots in key cities average swaps daily, nearing the breakeven point. Customers enjoy predictable costs and protection from lithium price fluctuations, while operators expand station density with brand-agnostic coverage.
OEM Modular Platforms Enabling 6-Month Model Cycles
Modular chassis designs now split frames, suspensions, and electronics into easily interchangeable blocks, significantly reducing the design-to-launch timeline across the Europe Two-Wheeler Market. Piaggio's WIDE platform launched multiple derivatives, enabling swift responses to Yadea's entry into the electric scooter market shortly beforehand. By standardizing components, companies have cut tooling costs by a notable percentage, reallocating those savings towards software and connectivity enhancements. The competitive focus has evolved from individual models to a broader control over ecosystems, suppliers, and over-the-air upgrade channels.
Restraints Impact Analysis*
| Restraint | (~) % Impact on CAGR Forecast | Geographic Relevance | Impact Timeline |
|---|---|---|---|
| Lithium Price Volatility | -0.8% | Global, electric-heavy markets | Short term (≤ 2 years) |
| High Insurance for Young Riders | -0.6% | UK, Germany, France, Netherlands | Medium term (2-4 years) |
| Dealer Network Consolidation | -0.4% | Rural Germany, France, Italy, Spain | Long term (≥ 4 years) |
| Municipal Scooter Caps | -0.3% | Paris, Berlin, Amsterdam, Barcelona | Short term (≤ 2 years) |
| Source: Mordor Intelligence | |||
Lithium-Spot-Price Volatility Hitting EV MSRP Stability
Lithium carbonate prices have fluctuated sharply, directly affecting scooter battery costs [3]“Lithium Contract Price Data Sheet 2025,”, London Metal Exchange, lme.com. Niu, a prominent player, initially raised sticker prices in Europe but later rolled them back, causing dealer disruptions. These price adjustments have created market uncertainty, affecting dealer confidence and consumer purchasing behavior. The EU's Critical Raw Materials Act aims to bolster regional sourcing. Yet the bloc refines only a fraction of the world's lithium hydroxide, leaving OEMs at the mercy of overseas supply vulnerabilities. This reliance on offshore suppliers underscores the need for increased investment in local refining capabilities to mitigate supply chain risks and ensure long-term stability.
High Insurance Premiums for Below 25-Year-Old Riders
Premiums for young riders rose in 2025 due to higher claim severity, pricing many potential first-time owners out of the market. The demographic most open to electric tech faces the steepest entry hurdles, risking a slowdown in market rejuvenation. Insur-tech startups pilot ride-by-minute cover to slice costs, yet widespread adoption awaits regulatory approval and actuarial validation.
*Our forecasts treat driver/restraint impacts as directional, not additive. The impact forecasts reflect baseline growth, mix effects, and variable interactions.
Segment Analysis
By Vehicle Type: Scooters Accelerate on Delivery Demand
Motorcycles generated 79.28% of 2025 turnover; however, scooters are slated for a brisk 7.32% CAGR to 2031 as delivery fleets and urban commuters prize their agility. The European market for scooters is projected to grow significantly, driven by the introduction of new battery-swap compatible designs. Poste Italiane’s fleet of electric scooters showcases the operational savings that attract enterprise buyers to step-through frames. While lifestyle-oriented motorcycles still hold sway in touring and sport segments, their prominence is gradually diminishing as younger riders and shared-mobility users gravitate towards more practical scooters.
OEMs that successfully combine compact frames with swappable batteries and integrated cargo boxes are reaping the benefits of the scooter surge. Chinese suppliers are capitalizing on their cost advantages, whereas established European players are banking on brand trust and robust after-sales networks. As congestion tolls become more stringent, scooters are transitioning from luxury items to essential tools in logistics, healthcare, and municipal services, solidifying their long-term significance in the European two-wheeler landscape.


By Propulsion: ICE Dominance Masks Electric Uptick
ICE powertrains still commanded 89.21% of 2025 unit sales, yet electric deliveries are forecast to grow 8.13% through 2031. Countries with a high number of public charging points per capita are witnessing clusters of electric vehicle penetration. This trend has led to notable adoption rates in both the Netherlands and Norway. Furthermore, fleet procurement decisions are already being influenced by anticipated CO₂ norms for L-category vehicles.
The European two-wheeler market share for electric models is projected to climb by 2031, buoyed by declining battery costs and fleet incentives. ICE mid-displacement classes (250–500 cc) remain resilient for touring aficionados seeking range, yet face gradual displacement as rapid-charge networks extend highway capability for premium electric sport bikes.
By Engine Capacity / Motor Power: Mid-Range ICE, Low-Power EV Lead
126-150 cc motorcycles accounted for 30.02% of 2025 sales, capturing novice riders seeking affordable, license-friendly mobility. Parallelly, 1.1–3.0 kW electric scooters are projected to achieve a 7.31% CAGR, leveraging city incentives and swappable solutions. Above-5.0 kW electric brackets await densified high-rate chargers and higher-energy-density packs to woo performance enthusiasts.
OEMs tailor modular frames that host either 150 cc engines or 3 kW motors, thus hedging regulatory and demand swings. Entry-level ICE segments could taper as Euro 6 proposals raise compliance costs, yet value-priced used motorbikes cushion immediate declines.
By Price Band: Entry Models Lead, Premium Segments Climb
Units priced at up to USD 1,000 accounted for 29.12% of 2025 volume, but face margin erosion as Euro 5+ catalysts add USD 120 per bike. The USD 3,001–5,000 tier is forecast to outpace overall market growth at 7.77% CAGR, energized by connected electric scooters and feature-rich mid-displacement bikes. Premium models above USD 5,000 are expanding in Northern Europe, where disposable incomes and a touring culture remain strong.
Financing innovations such as zero-down subscriptions and bundled insurance democratize access to the mid-premium bracket, gradually shifting buyers up the value chain and bolstering the European two-wheeler market.
By End User: Fleet Electrification Lifts B2B Momentum
B2C still drove 81.36% of 2025 shipments, yet fleet operators will shape future specs, insisting on telematics, uptime warranties, and predictable TCO. Delivery and logistics outfits alone outstrip headline growth at an 8.16% CAGR, nudging OEMs to craft business-grade service contracts. Corporate sales teams and field-tech crews adopt two-wheelers to skirt congestion and parking fees, further professionalizing demand.
Consumer enthusiasm centers on premium adventure and sport bikes. In contrast, everyday commuters increasingly favor subscription-based access over outright ownership, reinforcing a service-centric pivot across the European two-wheeler market.
By Sales Channel: Offline Tradition Meets Online Upswing
Brick-and-mortar outlets retained 71.87% share in 2025 thanks to test rides, trade-ins, and servicing. Online direct-to-consumer volumes surge at 7.28% CAGR, spearheaded by electric brands bundling doorstep delivery and battery-swap memberships. Hybrid omnichannel flows emerge as legacy OEMs roll out virtual showrooms and click-to-dealer reservations.
Subscription models exist almost entirely online, targeting urban millennials who value flexibility, pushing traditional retailers to reconsider revenue streams that lean more on service and less on unit-margin sales.
Geography Analysis
Italy accounted for a 28.31% share of the 2025 target market revenue, anchoring the European two-wheeler market in scooter-centric cities where car restrictions are tight. Rome, Milan, and Naples combined account for a larger share of national demand, with robust dealer networks and burgeoning battery-swap corridors. Spain, forecast to grow at a 6.28% CAGR, benefits from tourism-driven rentals and municipal EV subsidies, such as Barcelona’s EUR 1,200 purchase rebate.
Germany, France, and the UK together accounted for a significant share of sales and achieved steady growth. With Germany operating numerous public slots for two-wheelers, its mature charging ecosystem has notably spurred electric vehicle adoption, particularly among courier services. In the Nordics, countries like Norway, Sweden, and the Netherlands boast a substantial share of electric vehicles. This is primarily due to elevated fuel taxes and well-developed bike lanes, which enhance perceptions of safety.
As income levels rise, markets in Eastern and Central Europe, such as Poland, Austria, and Belgium, are growing at healthy rates. Meanwhile, Greece, Portugal, and the Czech Republic, hindered by infrastructure challenges, are advancing at a more modest pace. Given the regional disparities, strategies must be tailored: while premium connected electric vehicles find favor in the northern regions, the southern areas remain dominated by rugged, low-maintenance internal combustion engine models, catering to a more price-sensitive audience.
Competitive Landscape
The motorcycle market in Europe is moderately concentrated, with leading brands holding a significant share but leaving space for new entrants and niche players. This structure creates opportunities for disruptors to challenge incumbents through innovative models, pricing strategies, or ecosystem services. Honda, Yamaha, and BMW Motorrad lean on expansive dealer footprints and decades of reliability data to defend share. They bundle connected-bike apps, extended warranties, and brand-community events to lock in loyalty.
Electric-first players NIU, Zero Motorcycles, and Energica are addressing gaps with direct e-commerce, over-the-air updates, and high-performance batteries. Energica’s acquisition by Ducati injects startup agility into a heritage marque, accelerating product synergies in sport-bike niches.
Supplier relationships evolve as KTM and CATL co-invest EUR 300 million in European cell plants, hedging against lithium swings and ensuring performance packs for six-month model cycles. Meanwhile, dealer consolidation leaves rural service voids ripe for mobile maintenance startups, prompting incumbents to pilot van-based service subscriptions that travel to riders’ homes. Overall, strategic bets center on battery cost, software ecosystems, and fleet uptime guarantees rather than pure engine horsepower.
Europe Two-Wheeler Industry Leaders
BMW Motorrad
Honda Motor Co.,Ltd.
Piaggio & C. SpA
KTM AG
Yamaha Motor Co., Ltd.
- *Disclaimer: Major Players sorted in no particular order


Recent Industry Developments
- September 2025: Honda Motor Co. Ltd. launched its inaugural electric motorcycle, the "Honda WN7," in Europe. This launch marks a significant step in Honda's commitment to sustainability and innovation in the electric vehicle market. The automaker is targeting carbon neutrality for all its products and corporate activities by 2050, aiming to make all motorcycle offerings carbon-neutral by the 2040s. By introducing the "Honda WN7," Honda is aligning its product strategy with its long-term environmental goals, showcasing its dedication to reducing emissions and promoting cleaner transportation solutions.
- June 2025: Ultraviolette Automotive launched its electric motorcycles in France. Its lineup includes the sporty F77 Mach 2 and the comfortable F77 SuperStreet. Both models share a 10.3kWh battery pack, a 30kW motor, and a peak torque of 100Nm, differing only in design and seating ergonomics.


Europe Two-Wheeler Market Report Scope
The Europe two-wheeler market report is segmented by vehicle type (motorcycles and scooters), propulsion (ice and electric), engine capacity/motor power (up to 110 cc, 111-125 cc, 126-150 cc, 151-200 cc, 201-250 cc, 250-350 cc, 350-500 cc, above 500 cc, up to 1.0 kw, 1.1-3.0 kw, 3.1-5.0 kw, above 5.0 kw), price band (up to USD 1,000, USD 1,000-1,500, USD 1,501-2,000, USD 2,001-3,000, USD 3,001-5,000, above USD 5,000), end user (b2c, b2b), sales channel (online, offline), and geography (Germany, France, Italy, Spain, United Kingdom, Netherlands, Sweden, Poland, Austria, Belgium, Norway, Czech Republic, Portugal, and Greece). The market forecasts are provided in terms of both value (USD) and volume (units).
| Motorcycles |
| Scooters |
| Internal Combustion Engine (ICE) |
| Electric |
| Internal Combustion Engine (ICE) | Up to110 cc |
| 111-125 cc | |
| 126-150 cc | |
| 151-200 cc | |
| 201-250 cc | |
| 250-350 cc | |
| 350-500 cc | |
| Above 500 cc | |
| Electric | Up to 1.0 kW |
| 1.1-3.0 kW | |
| 3.1-5.0 kW | |
| Above 5.0 kW |
| Up to USD 1,000 |
| USD 1,000-1,500 |
| USD 1,501-2,000 |
| USD 2,001-3,000 |
| USD 3,001-5,000 |
| Above USD 5,000 |
| B2C | |
| B2B | Ride-Hail / Bike-Taxi / Rental / Tourism |
| Delivery and Logistics | |
| Corporate and SME Fleets | |
| Others (Government and Institutional, NGO) |
| Online |
| Offline |
| Germany |
| France |
| Italy |
| Spain |
| United Kingdom |
| Netherlands |
| Sweden |
| Poland |
| Austria |
| Belgium |
| Norway |
| Czech Republic |
| Portugal |
| Greece |
| By Vehicle Type | Motorcycles | |
| Scooters | ||
| By Propulsion | Internal Combustion Engine (ICE) | |
| Electric | ||
| By Engine Capacity / Motor Power | Internal Combustion Engine (ICE) | Up to110 cc |
| 111-125 cc | ||
| 126-150 cc | ||
| 151-200 cc | ||
| 201-250 cc | ||
| 250-350 cc | ||
| 350-500 cc | ||
| Above 500 cc | ||
| Electric | Up to 1.0 kW | |
| 1.1-3.0 kW | ||
| 3.1-5.0 kW | ||
| Above 5.0 kW | ||
| By Price Band | Up to USD 1,000 | |
| USD 1,000-1,500 | ||
| USD 1,501-2,000 | ||
| USD 2,001-3,000 | ||
| USD 3,001-5,000 | ||
| Above USD 5,000 | ||
| By End User | B2C | |
| B2B | Ride-Hail / Bike-Taxi / Rental / Tourism | |
| Delivery and Logistics | ||
| Corporate and SME Fleets | ||
| Others (Government and Institutional, NGO) | ||
| Sales Channel | Online | |
| Offline | ||
| Geography | Germany | |
| France | ||
| Italy | ||
| Spain | ||
| United Kingdom | ||
| Netherlands | ||
| Sweden | ||
| Poland | ||
| Austria | ||
| Belgium | ||
| Norway | ||
| Czech Republic | ||
| Portugal | ||
| Greece | ||


Market Definition
- Vehicle Type - The category covers motorized two-wheelers.
- Vehicle Body Type - This includes Scooters and Motorcycles, while Kick-scooters and Bicycles are excluded.
- Fuel Category - Coverage extends to vehicles powered by Internal Combustion Engines (ICE) and electric propulsion systems.
| Keyword | Definition |
|---|---|
| Electric Vehicle (EV) | A vehicle which uses one or more electric motors for propulsion. Includes cars, buses, and trucks. This term includes all-electric vehicles or battery electric vehicles and plug-in hybrid electric vehicles. |
| BEV | A BEV relies completely on a battery and a motor for propulsion. The battery in the vehicle must be charged by plugging it into an outlet or public charging station. BEVs do not have an ICE and hence are pollution-free. They have a low cost of operation and reduced engine noise as compared to conventional fuel engines. However, they have a shorter range and higher prices than their equivalent gasoline models. |
| PEV | A plug-in electric vehicle is an electric vehicle that can be externally charged and generally includes all-electric vehicles as well as plug-in hybrids. |
| Plug-in Hybrid EV | A vehicle that can be powered either by an ICE or an electric motor. In contrast to normal hybrid EVs, they can be charged externally. |
| Internal combustion engine | An engine in which the burning of fuels occurs in a confined space called a combustion chamber. Usually run with gasoline/petrol or diesel. |
| Hybrid EV | A vehicle powered by an ICE in combination with one or more electric motors that use energy stored in batteries. These are continually recharged with power from the ICE and regenerative braking. |
| Commercial Vehicles | Commercial vehicles are motorized road vehicles designed for transporting people or goods. The category includes light commercial vehicles (LCVs) and medium and heavy-duty vehicles (M&HCV). |
| Passenger Vehicles | Passenger cars are electric motor– or engine-driven vehicles with at least four wheels. These vehicles are used for the transport of passengers and comprise no more than eight seats in addition to the driver’s seat. |
| Light Commercial Vehicles | Commercial vehicles that weigh less than 6,000 lb (Class 1) and in the range of 6,001–10,000 lb (Class 2) are covered under this category. |
| M&HDT | Commercial vehicles that weigh in the range of 10,001–14,000 lb (Class 3), 14,001–16,000 lb (Class 4), 16,001–19,500 lb (Class 5), 19,501–26,000 lb (Class 6), 26,001–33,000 lb (Class 7) and above 33,001 lb (Class 8) are covered under this category. |
| Bus | A mode of transportation that typically refers to a large vehicle designed to carry passengers over long distances. This includes transit bus, school bus, shuttle bus, and trolleybuses. |
| Diesel | It includes vehicles that use diesel as their primary fuel. A diesel engine vehicle have a compression-ignited injection system rather than the spark-ignited system used by most gasoline vehicles. In such vehicles, fuel is injected into the combustion chamber and ignited by the high temperature achieved when gas is greatly compressed. |
| Gasoline | It includes vehicles that use gas/petrol as their primary fuel. A gasoline car typically uses a spark-ignited internal combustion engine. In such vehicles, fuel is injected into either the intake manifold or the combustion chamber, where it is combined with air, and the air/fuel mixture is ignited by the spark from a spark plug. |
| LPG | It includes vehicles that use LPG as their primary fuel. Both dedicated and bi-fuel LPG vehicles are considered under the scope of the study. |
| CNG | It includes vehicles that use CNG as their primary fuel. These are vehicles that operate like gasoline-powered vehicles with spark-ignited internal combustion engines. |
| HEV | All the electric vehicles that use batteries and an internal combustion engine (ICE) as their primary source for propulsion are considered under this category. HEVs generally use a diesel-electric powertrain and are also known as hybrid diesel-electric vehicles. An HEV converts the vehicle momentum (kinetic energy) into electricity that recharges the battery when the vehicle slows down or stops. The battery of HEV cannot be charged using plug-in devices. |
| PHEV | PHEVs are powered by a battery as well as an ICE. The battery can be charged through either regenerative breaking using the ICE or by plugging into some external charging source. PHEVs have a better range than BEVs but are comparatively less eco-friendly. |
| Hatchback | These are compact-sized cars with a hatch-type door provided at the rear end. |
| Sedan | These are usually two- or four-door passenger cars, with a separate area provided at the rear end for luggage. |
| SUV | Popularly known as SUVs, these cars come with four-wheel drive, and usually have high ground clearance. These cars can also be used as off-road vehicles. |
| MPV | These are multi-purpose vehicles (also called minivans) designed to carry a larger number of passengers. They carry between five and seven people and have room for luggage too. They are usually taller than the average family saloon car, to provide greater headroom and ease of access, and they are usually front-wheel drive. |


Research Methodology
Mordor Intelligence follows a four-step methodology in all its reports.
- Step-1: Identify Key Variables: To build a robust forecasting methodology, the variables and factors identified in Step-1 are tested against available historical market numbers. Through an iterative process, the variables required for market forecast are set and the model is built based on these variables.
- Step-2: Build a Market Model: Market-size estimations for the historical and forecast years have been provided in revenue and volume terms. Market revenue is calculated by multiplying the sales volume with their respective average selling price (ASP). While estimating ASP factors like average inflation, market demand shift, manufacturing cost, technological advancement, and varying consumer preference, among others have been taken into account.
- Step-3: Validate and Finalize: In this important step, all market numbers, variables, and analyst calls are validated through an extensive network of primary research experts from the market studied. The respondents are selected across levels and functions to generate a holistic picture of the market studied.
- Step-4: Research Outputs: Syndicated Reports, Custom Consulting Assignments, Databases & Subscription Platforms.


