Market Overview
| Study Period | 2020 - 2031 |
|---|---|
| Forecast Data Period | 2026 - 2031 |
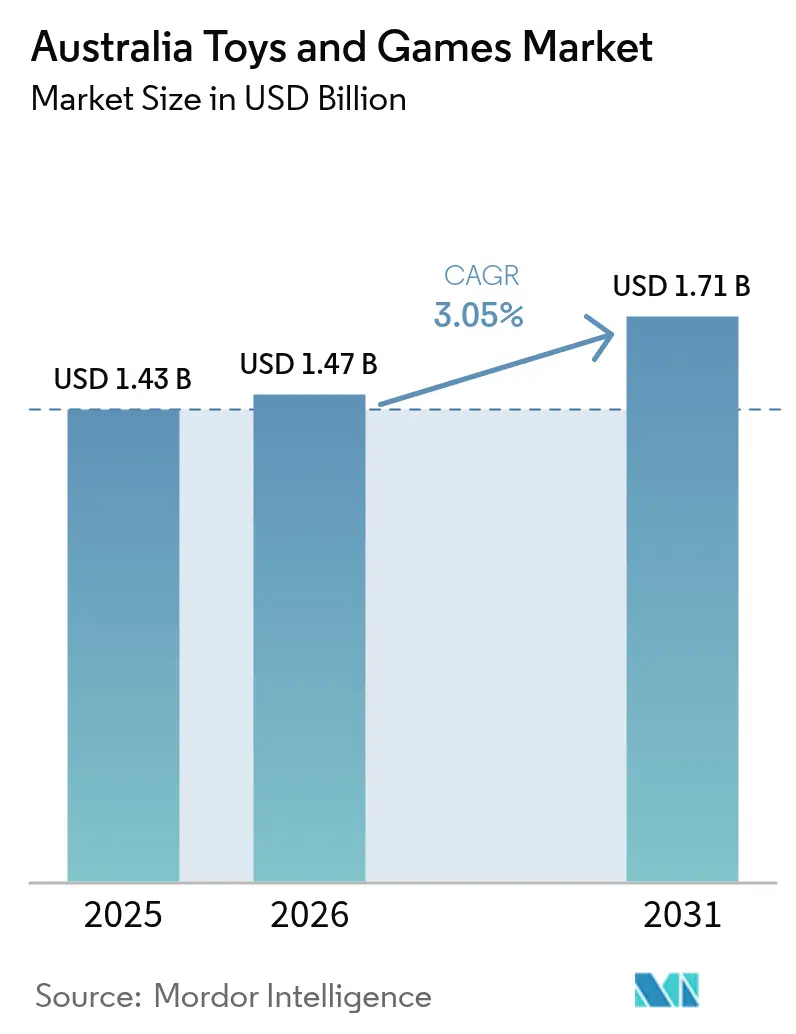
| Base Year Market Size (2025) | USD 1.43 Billion |
| Market Size (2026) | USD 1.47 Billion |
| Market Size (2031) | USD 1.71 Billion |
| Growth Rate (2026 - 2031) | 3.05% CAGR |
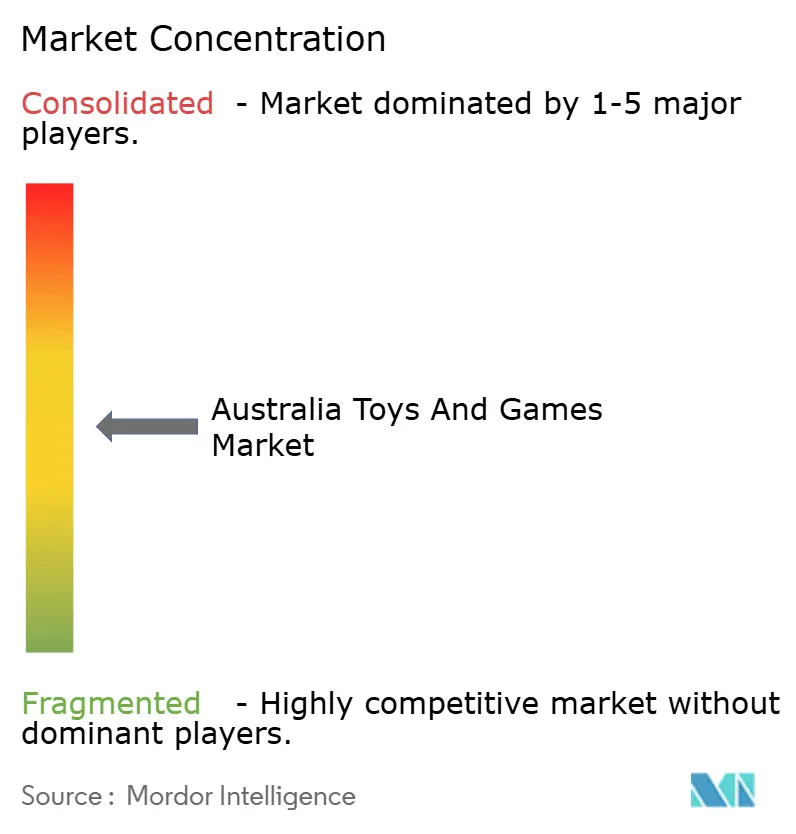
| Market Concentration | Medium |
Major Players *Disclaimer: Major Players sorted in no particular order Image © Mordor Intelligence. Reuse requires attribution under CC BY 4.0. | |
Australia Toys And Games Market Analysis by Mordor Intelligence
The Australia toys and games market size is expected to grow from USD 1.43 billion in 2025 to USD 1.47 billion in 2026 and is forecast to reach USD 1.71 billion by 2031 at 3.05% CAGR over 2026-2031. Measured household confidence supports discretionary spending on toys even as living-cost pressures remain evident, and educational items together with adult collectibles act as buffers during cyclical downturns. Government STEM funding, early-childhood policy focus, and enhanced e-commerce logistics further amplify demand, while eco-design mandates are reshaping packaging and materials choices. Competitive intensity remains elevated because global leaders adapt portfolios to local licensing opportunities, and online marketplaces extend nationwide reach despite rising compliance scrutiny. Overall, the Australia toys market benefits from a confluence of demographic growth in family households, omnichannel retail maturation, and policy-aligned learning priorities that sustain volume and value advancement.
Key Report Takeaways
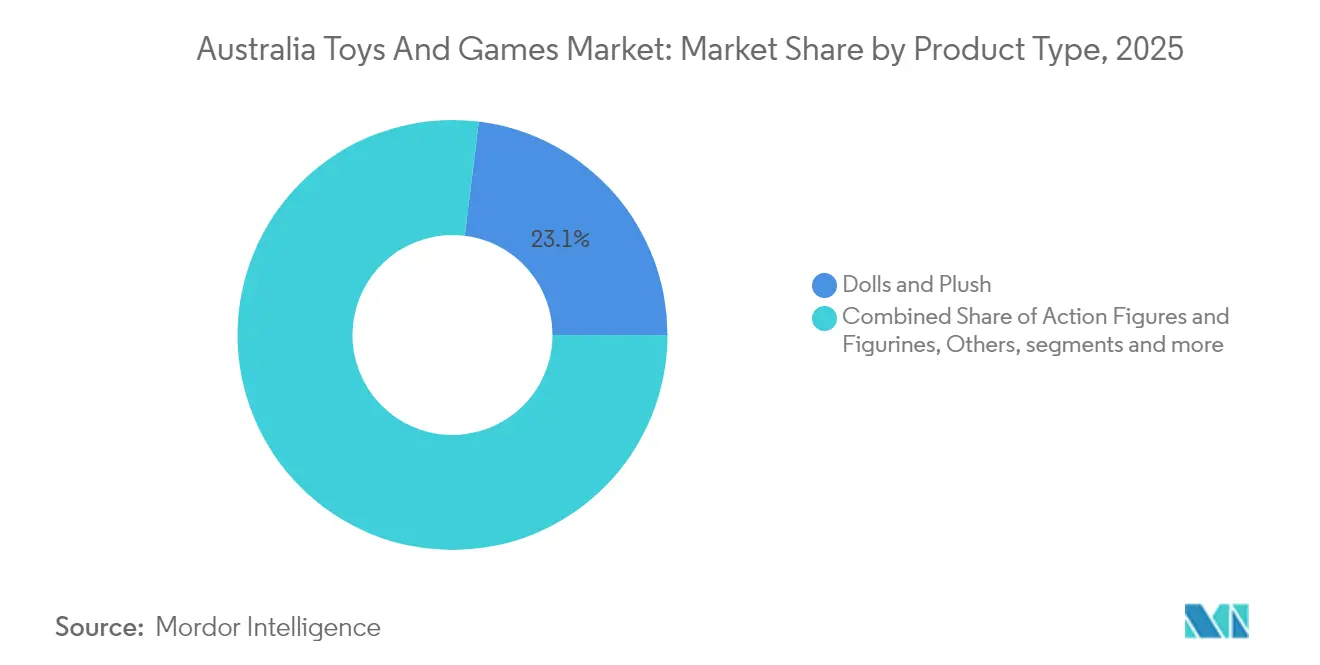
- By product type, dolls and plush led with 23.05% of Australia toys market share in 2025, whereas educational and STEM toys are on track for a 5.12% CAGR to 2031.
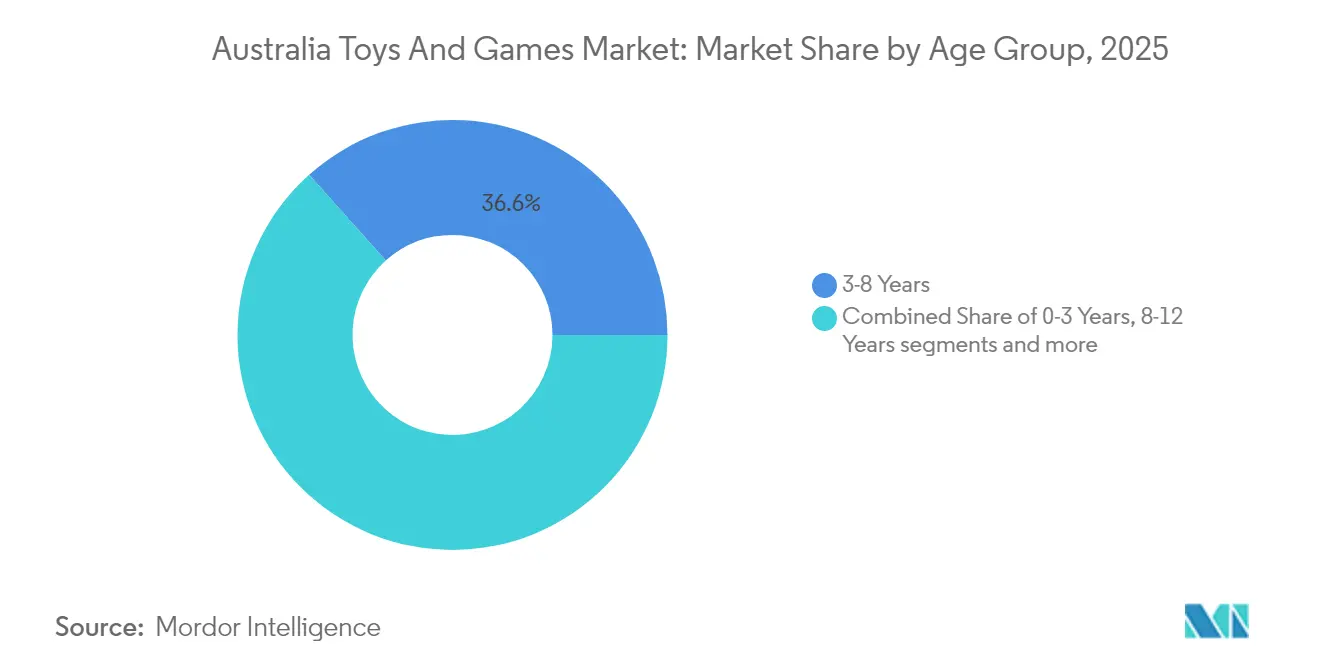
- By age group, 3-8 years accounted for 36.62% share of the Australia toys market size in 2025, while 8-12 Years is projected to expand at a 5.78% CAGR through 2031.
- By distribution channel, online retail commanded 35.13% of the Australia toys market size in 2025 and is advancing at a 4.72% CAGR to 2031.
- By state, New South Wales held a 29.85% revenue share in 2025; Queensland is forecast to grow at a 5.95% CAGR over the same period.
- The LEGO Group, Mattel Inc., Hasbro Inc., Moose Toys, and Spin Master Corp. collectively held a dominant position in 2024.
Note: Market size and forecast figures in this report are generated using Mordor Intelligence’s proprietary estimation framework, updated with the latest available data and insights as of 2026.
Australia Toys And Games Market Trends and Insights
Drivers Impact Analysis*
| Driver | (~) % Impact on CAGR Forecast | Geographic Relevance | Impact Timeline |
|---|---|---|---|
| Rising disposable income and gifting culture | +0.8% | National, with higher impact in NSW and Victoria | Medium term (2-4 years) |
| Expansion of licensed merchandise franchises | +0.6% | National, with concentration in urban centers | Long term (≥ 4 years) |
| Growth in e-commerce and omnichannel retail | +0.7% | National, with rural areas showing highest growth | Short term (≤ 2 years) |
| Increasing demand for educational and STEM toys | +0.5% | National, with government program alignment | Medium term (2-4 years) |
| Government funding for early-childhood STEM programs | +0.3% | National, with targeted regional implementation | Long term (≥ 4 years) |
| Adult collectible and hobby community expansion | +0.4% | Urban centers, particularly Sydney and Melbourne | Medium term (2-4 years) |
| Source: Mordor Intelligence | |||
Rising Disposable Income and Gifting Culture
Household spending resilience supports the Australia toys market as discretionary budgets expand even when essentials outpace wage growth. Elevated gifting traditions across multicultural calendars add several mini seasons beyond Christmas, sustaining revenue consistency throughout the year. Younger adults aged 25-29 maintain toy purchases despite trimming other discretionary categories, indicating enduring emotional attachment to childhood experiences. Premium products flourish during peak events such as Chinese New Year, Diwali, and Eid, encouraging manufacturers to broaden culturally relevant assortments. As retailers refine loyalty programs, gifting remains a strategic anchor for average-order-value growth across physical and digital channels.
Expansion of Licensed Merchandise Franchises
Intellectual-property franchises deepen engagement in the Australia toys market by coupling streaming content with merchandise drops, creating recurring sales beyond initial launches. Bluey’s global reach across 50 countries demonstrates local IP scalability, and Moose Toys leverages this momentum through worldwide production agreements. Mattel’s 2025 acquisition of DC Comics rights re-positions the firm for category leadership while limiting competitors’ access to high-equity characters, raising entry barriers. Strong national IP protection laws reassure licensors and spur further collaborations, especially as cross-platform storytelling aligns with parents’ preference for recognizable educational narratives. Licensing also enables quick merchandise refreshes that coincide with new series seasons, keeping shelf assortments dynamic and driving impulse purchases.
Growth in E-commerce and Omnichannel Retail
Online expenditure of USD 45 billion, spotlights digital momentum nationally. In the Australia toys market, marketplace participation by 93% of consumers places Amazon and eBay at the heart of discovery journeys, while rising players such as Temu attract value-driven shoppers. Rural households register the fastest digital adoption due to limited physical store density, reinforcing nationwide fulfillment networks. Mobile transactions exceeding 30% of digital orders accelerate bite-sized purchasing behavior, benefiting low-ticket toy categories. However, safety compliance failures on unvetted platforms prompt regulatory crackdowns that may reroute demand toward compliant sellers.
Increasing Demand for Educational and STEM Toys
Federal STEM policy under Australia’s National Science Statement 2024 reclassifies many learning toys as skill-building assets rather than leisure items [1]Department of Industry, Science and Resources, “National Science Statement 2024,” industry.gov.au.. Source: Department of Industry, Science and Resources, “National Science Statement 2024,” industry.gov.au. Parallel early-childhood frameworks for ages 0-5 embed developmental benchmarks into daycare procurement, lifting institutional volume. Parents in growth corridors such as Camden and Wollondilly view construction sets, coding kits, and robotics as investments in future employability, bolstering unit value. These products maintain positive growth during downturns, given their perceived academic benefit. Suppliers increasingly pair physical kits with app-based curricula, reinforcing sustained engagement and subscription upsell opportunities.
Restraints Impact Analysis*
| Restraint | (~) % Impact on CAGR Forecast | Geographic Relevance | Impact Timeline |
|---|---|---|---|
| Competition from digital entertainment and screen time | -0.9% | National, with higher impact in urban areas | Short term (≤ 2 years) |
| Rising safety certification and compliance costs | -0.6% | National, affecting all market participants | Medium term (2-4 years) |
| Price sensitivity amid economic uncertainties | -0.4% | National, with greater impact on lower-income households | Short term (≤ 2 years) |
| Sustainability scrutiny and packaging-waste regulations | -0.3% | National, with state-specific implementation variations | Long term (≥ 4 years) |
| Source: Mordor Intelligence | |||
Competition from Digital Entertainment and Screen Time
Children aged 12-13 spend more than 3 weekday hours on screens, climbing past 4 hours on weekends, siphoning attention from traditional toys. Free-to-play mobile titles channel discretionary dollars into micro-transactions rather than one-off purchases, while console ecosystems from Nintendo and Sony deepen loyalty through subscription models. The restraint is sharpest among tweens and teens but cascades into younger cohorts as tablets become learning aids. Hybrid experiences that fuse augmented reality with physical pieces partially offset this shift, suggesting opportunity spaces for adaptable brands. Retailers respond by curating interactive in-store demos that rekindle tactile engagement among digitally native shoppers.
Rising Safety Certification and Compliance Costs
Enhanced enforcement by the Australian Competition and Consumer Commission triggers mounting fines for non-compliance, with penalties of USD 49,500 levied for button-battery testing failures [2]Australian Competition and Consumer Commission, “Button Battery Enforcement Outcomes,” accc.gov.au. . From March 2025, a revised infant-toy standard mandates additional choking-hazard assessment. Meanwhile, the Australian Packaging Covenant Organization introduces eco-modulation fees from FY27, effectively taxing non-recyclable materials. Smaller importers struggle to absorb testing expenses and sustainable redesign investment, ceding shelf space to multinationals with global quality frameworks. Longer lead times for safety validation also compress launch calendars, pushing brands toward evergreen ranges rather than rapid-fire novelties.
*Our forecasts treat driver/restraint impacts as directional, not additive. The impact forecasts reflect baseline growth, mix effects, and variable interactions.
Segment Analysis
By Product Type: Educational Toys Command Premium Momentum
Educational and STEM Toys represent the fastest-expanding category, advancing at a 5.12% CAGR to 2031 and steadily increasing their contribution to the Australia toys market. Unit demand rises as parents perceive coding robots, science kits, and math games as tools that improve school performance, aligning with national curriculum updates. Simultaneously, regulatory attention to STEM proficiency elevates these items from nice-to-have gifts into planned household purchases, supporting higher price points. Dolls and Plush maintain a 23.05% revenue lead in 2025 by capturing emotional attachment and inclusive storylines, while Construction Sets enjoy loyal adult collectors who extend the lifespan of core franchises. Games and Puzzles thrive by bridging cross-generational social play, harnessing stay-at-home habits that persisted after the pandemic period.
Outdoor and Sports Toys experience muted growth because urban households lack expansive play areas, yet demand endures among health-minded parents integrating physical activity into daily routines. Vehicles and Remote-Control items remain relevant by embedding Bluetooth or Wi-Fi controls, offering a bridge between tactile manipulation and smartphone familiarity. Video-Game Hardware sits at the convergence of entertainment and toy retail, with handheld consoles sold alongside board games at omnichannel outlets. The residual “Others” classification gathers sustainable bamboo skittles, sensory autism aids, and AI-driven companions that foreshadow new niches within the Australia toys market.


By Age Group: Upper Childhood Segment Accelerates
The 3-8 Years bracket delivered 36.62% of the 2025 value, reinforcing its status as the core purchasing demographic; however, the 8-12 Years segment is on course for a 5.78% CAGR that outpaces every other band. Parents target higher-order cognitive skill kits and franchise collectibles as children transition to more complex interests, lifting average selling prices. The 0-3 Years cohort benefits from the projected 11% uplift in the under-15 population by 2041, ensuring a stable base for developmental toys in metro and peri-urban districts. Teens gravitate toward hobby-grade models, tabletop games, and limited-edition figurines that satisfy expressive identity needs even as screen alternatives compete aggressively.
Adults and hobby collectors now account for a meaningful slice of the Australia toys market, mirroring global evidence that 19% of sales originate from over-18 customers. Vintage Barbie, Star Wars memorabilia, and LEGO Architecture sets resonate with this clientele, unlocking margin-rich SKUs. Specialty retailers schedule after-hours events to showcase high-value releases, fostering community engagement that further shields this segment from digital cannibalization.
By Distribution Channel: Digital Dominance Continues
Online Retail controlled 35.13% of the Australia toys market size in 2025 and is expanding at a 4.72% CAGR to 2031, driven by fast delivery promises and aggressive promotional cycles. Marketplace algorithms expose micro-brands to nationwide audiences, yet growing enforcement around product safety will likely concentrate traffic among verified storefronts. Specialty Toy Stores preserve relevance through experiential merchandising and curated ranges that cater to collectors and STEM-focused parents. Department and Discount Stores commit heavily to click-and-collect.
Supermarkets address convenience spending for low-ticket impulse buys, particularly pocket-money plush lines and blind-box collectibles situated near checkouts. Direct-to-consumer subscriptions enter the scene, bundling monthly STEM projects with progress-tracking apps that reinforce recurrence revenue. While Temu’s rapid Australian ascent spotlights value positioning, its 100% compliance failure rate in independent testing may channel consumers back toward established e-commerce leaders that guarantee regulated sourcing.
Geography Analysis
New South Wales generated 29.85% of national toy revenue in 2025 as Greater Sydney’s dense family population and mature omnichannel retail network support high product turnover. Continued suburban infill and a projected rise to 9.9 million residents by 2041 underpin long-run volume growth, although elevated living costs are steering younger renters toward value lines. Cultural diversity broadens the calendar of gifting events, allowing retailers to smooth quarterly sales without deep discounting.
Queensland is the fastest-growing state, advancing at a 5.95% CAGR to 2031 as interstate migration brings young families into Brisbane, Gold Coast, and Sunshine Coast corridors. Additional demand flows from tourism spending, which peaks during school holidays and amplifies seasonal volume for outdoor and licensed ranges. The state’s focus on STEM education aligns with institutional purchases of science kits and coding sets for community programs, reinforcing premium sub-segment momentum.
Victoria, Western Australia, South Australia, Tasmania, ACT, and Northern Territory provide the remaining share and display mixed growth profiles. Victoria leverages Melbourne’s large tertiary sector and multicultural depth to support premium and language-learning lines, while Western Australia’s mining wealth encourages higher average selling prices. Smaller states depend on targeted assortments and rising e-commerce penetration to overcome limited store footprints, a trend intensified by national logistics upgrades that shorten rural delivery windows.
Competitive Landscape
Five multinational brands, The LEGO Group, Mattel Inc., Hasbro Inc., Moose Toys, and Spin Master Corp., hold a commanding position through deep IP catalogs, advanced compliance systems, and efficient omnichannel distribution. Mattel’s 2025 recovery of DC Comics rights bolsters its local action-figure portfolio, while LEGO sustains cross-generational appeal with architecture and adult collector sets. Spin Master’s 18.8% 2024 revenue surge reflects an innovation pipeline that balances preschool, construction, and digital-hybrid lines.
Market disruption followed Toys ‘R’ Us Australia’s mid-2025 collapse, releasing almost USD 30 million in sales that competitors quickly absorbed. Rising regulatory costs also shift share toward large incumbents because fines such as the ACCC’s recent USD 49,500 button-battery penalties weigh more heavily on small importers. At the same time, platform retailers face closer oversight, which is likely to concentrate compliant sellers and increase bargaining power for established brands.
Sustainability rules offer another competitive lever. Early movers redesign packaging to satisfy APCO’s eco-modulation fees taking effect from FY27, positioning themselves for potential cost advantages and stronger consumer trust. Strategic priorities across the leader group include licensing acquisitions, connected-play technology, and direct-to-consumer launches that capitalize on growing adult collector demand while preserving scale efficiencies in core children’s segments.
Australia Toys And Games Industry Leaders
The LEGO Group
Mattel Inc.
Hasbro Inc.
Moose Toys
Spin Master Corp.
- *Disclaimer: Major Players sorted in no particular order

Recent Industry Developments
- March 2025: Mattel acquired the global licensing rights to produce DC-themed action figures and collectibles, including in Australia, with shipments beginning H2 2026
- February 2025: Hasbro unveiled “Playing to Win,” a strategic plan to reach 750 million consumers by 2027 while securing USD 1 billion in operational savings
- August 2024: Moose Toys introduced Tile Town, extending its portfolio into a new modular construction segment that targets both children and adult hobbyists


Australia Toys And Games Market Report Scope
Toys and games are the tools of play. They play an important role in social life and have never been restricted to children.
The Australian toys and games market is segmented into type and distribution channel. By type, the market is segmented into card games, construction sets and models, dolls and stuffed toys, plastic toys, puzzles, toys for toddlers and kids, and video game consoles. By distribution channel, the market is segmented into online and offline.
The report offers market size and forecast for the Australian toys and games market in value (USD) for all the above segments.
By Product Type
| Action Figures and Figurines |
| Dolls and Plush |
| Construction and Building Sets |
| Games and Puzzles |
| Outdoor and Sports Toys |
| Vehicles and Remote Control |
| Educational and STEM Toys |
| Video-Game Hardware and Software |
| Others |
By Age Group
| 0-3 Years |
| 3-8 Years |
| 8-12 Years |
| 12-18 Years |
| Adults and Hobby Collectors |
By Distribution Channel
| Specialty Toy Stores |
| Online Retail |
| Department and Discount Stores |
| Supermarkets and Hypermarkets |
| Others |
By Geography
| New South Wales |
| Victoria |
| Queensland |
| Western Australia |
| South Australia |
| Tasmania |
| Australian Capital Territory |
| Northern Territory |
| By Product Type | Action Figures and Figurines |
| Dolls and Plush | |
| Construction and Building Sets | |
| Games and Puzzles | |
| Outdoor and Sports Toys | |
| Vehicles and Remote Control | |
| Educational and STEM Toys | |
| Video-Game Hardware and Software | |
| Others | |
| By Age Group | 0-3 Years |
| 3-8 Years | |
| 8-12 Years | |
| 12-18 Years | |
| Adults and Hobby Collectors | |
| By Distribution Channel | Specialty Toy Stores |
| Online Retail | |
| Department and Discount Stores | |
| Supermarkets and Hypermarkets | |
| Others | |
| By Geography | New South Wales |
| Victoria | |
| Queensland | |
| Western Australia | |
| South Australia | |
| Tasmania | |
| Australian Capital Territory | |
| Northern Territory |


Key Questions Answered in the Report
What is the current size of the Australia toys market?
The Australia toys market size stands at USD 1.47 billion in 2026 and is expected to climb to USD 1.71 billion by 2031 at a 3.05% CAGR.
Which product segment is growing fastest?
Educational and STEM Toys are expanding at a 5.12% CAGR to 2031, driven by STEM policy support and parental demand for developmental play.
How important is e-commerce to toy sales in Australia?
Online Retail already represents 35.13% of the category revenue in 2025 and is forecast to grow at 4.72% CAGR, making it the pivotal channel for future expansion.
Which state offers the highest growth potential?
Queensland is projected to deliver a 5.95% CAGR by 2031 as lifestyle-driven migration fuels household formation and toy spending.
How are safety regulations affecting manufacturers?
Stringent ACCC enforcement and new infant-toy standards increase compliance costs, favoring large players with established testing infrastructure.
What opportunities exist in the adult collector space?
Collectors contribute an expanding premium segment, and limited-edition releases targeting over-18 buyers offer high margins with relatively low volume risk.
Page last updated on:


