
Australia Mobile Cranes Rental Market Size and Share
Market Overview
| Study Period | 2020 - 2031 |
|---|---|
| Forecast Data Period | 2026 - 2031 |
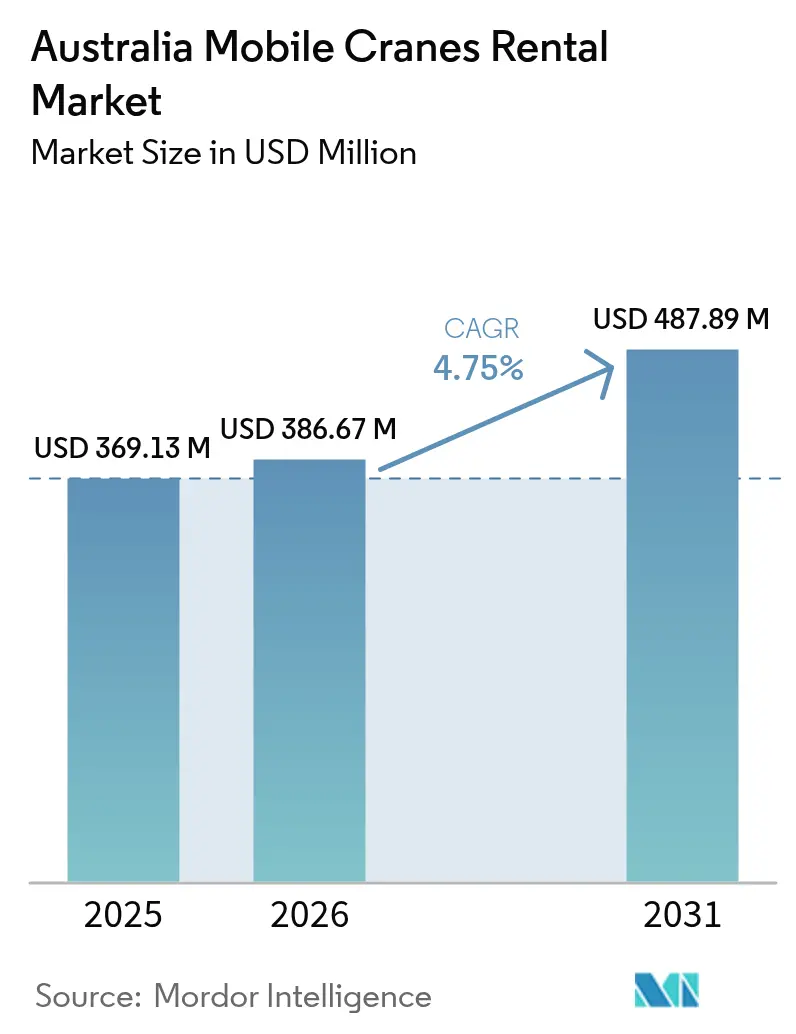
| Base Year Market Size (2025) | USD 369.13 Million |
| Market Size (2026) | USD 386.67 Million |
| Market Size (2031) | USD 487.89 Million |
| Growth Rate (2026 - 2031) | 4.75 % |
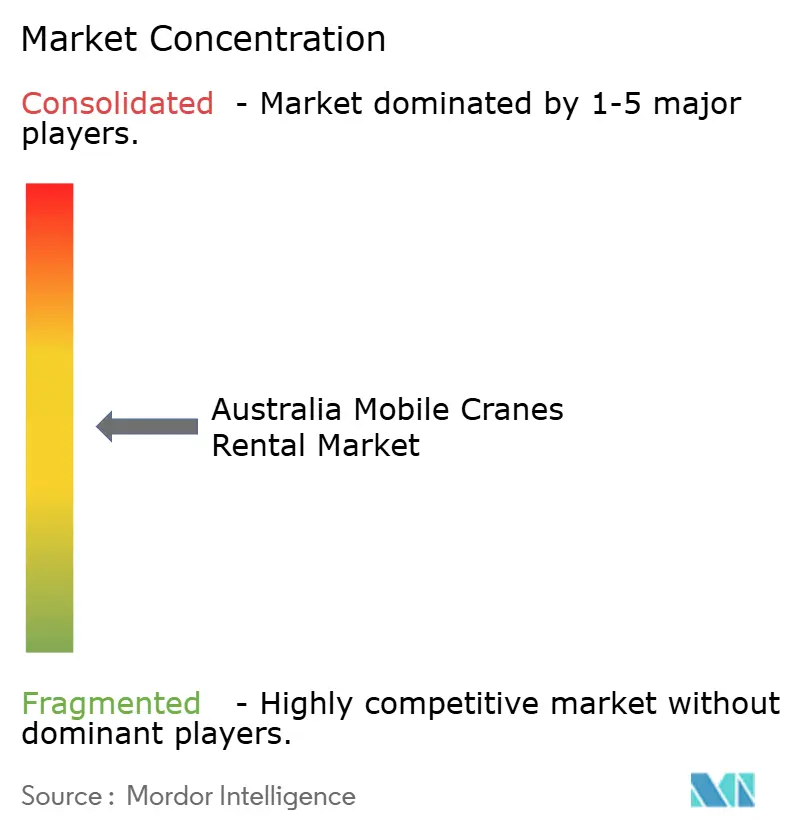
| Market Concentration | Medium |
Major Players *Disclaimer: Major Players sorted in no particular order Image © Mordor Intelligence. Reuse requires attribution under CC BY 4.0. | |
Australia Mobile Cranes Rental Market Analysis by Mordor Intelligence
The Australian mobile cranes rental market size in 2026 is estimated at USD 386.67 million, growing from 2025 value of USD 369.13 million with 2031 projections showing USD 487.89 million, growing at 4.75% CAGR over 2026-2031. Robust infrastructure outlays, a rebound in mining capital expenditure, and rising wind-farm construction collectively anchor expansion. Rental customers increasingly shift from ownership to long-term contracts, a trend that shields balance sheets from capital‐intensive equipment purchases and aligns with volatile project schedules. Demand is also tilting toward crawler and ultra-heavy-lift models as turbine hub heights grow and mining projects become more complex, while telematics-enabled fleet optimization and stricter exhaust rules spur accelerated fleet renewal. Competitive intensity is moderate because high asset costs and stringent safety rules deter new entrants, yet international players are consolidating regional specialists to scale technology investment and geographic reach.
Key Report Takeaways
- By product type, all-terrain cranes led with 36.98% of the Australian mobile cranes rental market share in 2025; crawler cranes are projected to advance at a 4.92% CAGR to 2031.
- By rental type, short-term agreements held 63.58% of the Australian mobile cranes rental market share in 2025, while long-term contracts posted the highest projected 5.88% CAGR through 2031.
- By application, construction accounted for 54.72% of the Australian mobile crane rental market share in 2025, while marine and offshore activities are forecast to rise at a 5.62% CAGR to 2031.
- By capacity, units up to 50 tons captured 47.62% of the Australian mobile cranes rental market share in 2025, and cranes above 300 tons are forecast to expand at a 6.37% CAGR through 2031.
- By geography, New South Wales retained a 35.96% of the Australian mobile cranes rental market share in 2025, whereas Western Australia is projected to register the fastest 5.25% CAGR on the strength of iron-ore expansions.
Note: Market size and forecast figures in this report are generated using Mordor Intelligence’s proprietary estimation framework, updated with the latest available data and insights as of 2026.
Australia Mobile Cranes Rental Market Trends and Insights
Drivers Impact Analysis*
| Driver | (~) % Impact on CAGR Forecast | Geographic Relevance | Impact Timeline |
|---|---|---|---|
| Mining CAPEX Rebound | +1.8% | Western Australia, Queensland, Northern Territory | Short term (≤ 2 years) |
| Renewables Boom Drives Lifts | +1.4% | National; early gains in Queensland, Victoria, South Australia | Medium term (2-4 years) |
| Rising Infrastructure Megaprojects | +1.2% | National; focus in NSW and Victoria | Medium term (2-4 years) |
| Shift to Rental Avoids CAPEX | +0.9% | National | Long term (≥ 4 years) |
| Telematics Spurs Fleet Renewal | +0.7% | National | Long term (≥ 4 years) |
| Stricter Rules Accelerate Fleet | +0.5% | National | Short term (≤ 2 years) |
| Source: Mordor Intelligence | |||
Mining CAPEX Rebound in Iron-Ore and Critical Minerals
Rebounding mining investment, particularly in iron ore and critical minerals, is the single biggest swing factor for heavy-lift demand. Rio Tinto’s USD 1.6 billion Hope Downs 2 expansion and Newmont’s Tanami upgrade both specify multi-hundred-ton crawler cranes for module placement, while lithium refinery builds in Western Australia and Queensland demand precision lifting of autoclaves and kiln shells [1]“Hope Downs 2 Project Overview,” Rio Tinto, riotinto.com. Producers prefer renting equipment to avoid cyclically stranded assets, so suppliers negotiate two-year take-or-pay contracts tied to project milestones. Automation retrofits in pits also trigger periodic lifting campaigns for driverless truck infrastructure and conveyor gantries installations.
Renewable-Energy Boom (On-Shore Wind Farms) Needing Above 150 T Lifts
Wind-farm escalation is redefining capacity needs, as nacelle weights top 120 tons and hub heights exceed 110 meters. Projects such as Forest Wind and MacIntyre require tandem lifts and blade exchanges that only 300-ton-plus crawlers or mega all-terrain units can tackle. Tight erection windows amplify penalties for downtime, so developers often lock cranes for eighteen months, covering construction and early maintenance. Grid-scale battery hubs piggyback on these logistics to share transport corridors. The same assets then rotate to repowering campaigns, driving secondary revenue without relocation downtime. Offshore wind planning magnifies long-term upside for marine-capable heavy-lift specialists [2]“Forest Wind Farm Project Factsheet,” Australian Renewable Energy Agency, arena.gov.au.
Rising Infrastructure and Transport Mega-Projects
Australia’s long pipeline of transport megaprojects keeps crane yards busy throughout economic cycles. Inland Rail stretches 1,700 kilometers and requires continuous bridge-beam placement, while Sydney Metro West and Victoria’s Big Build collectively add dozens of station boxes and tunnel shafts. Federal and state infrastructure budgets remain ring-fenced through 2030, locking in multi-year visibility for rental fleets. Urban congestion rules favor all-terrain units with compact footprints and advanced telematics that optimize lift sequencing and traffic management. Long-term hiring frameworks reduce idle time, lifting fleet utilization and margins [3]“Infrastructure Investment Program,” Department of Infrastructure, Transport, Regional Development, and Communications, infrastructure.gov.au.
Shift Toward Rental to Avoid Capex and Maintenance Burden
Corporate treasury teams increasingly see crane ownership as an unnecessary drag on returns, given tightening capital markets and volatile project pipelines. Moving to a rental model eliminates upfront purchases, shifts maintenance and certification risk to specialists, and lets contractors flex fleets up or down within weeks. The practice gained traction after 2024 when several mid-tier builders restructured balance sheets to win infrastructure contracts with lower leverage covenants. Rental firms respond by bundling predictive-maintenance telematics, operator training, and fuel-management services into three-to-five-year master agreements that guarantee uptime and cap hourly costs.
Restraints Impact Analysis*
| Restraint | (~) % Impact on CAGR Forecast | Geographic Relevance | Impact Timeline |
|---|---|---|---|
| Cyclical Commodity Prices Affect Hiring | −1.2% | Western Australia, Queensland, Northern Territory | Short term (≤ 2 years) |
| High Compliance Costs for Safety | −0.8% | National; state variation | Short term (≤ 2 years) |
| Insurance Premiums Surge Post-Litigation | −0.6% | National | Medium term (2-4 years) |
| Modular Systems Substituting Cranes | −0.4% | Urban construction in NSW, Victoria | Long term (≥ 4 years) |
| Source: Mordor Intelligence | |||
Commodity-Price Cyclicality Dampening Mining-Sector Hiring
Volatile commodity markets challenge fleet planning in resource states. A significant iron-ore price slide during mid-2025 stalled final investment decisions for two Pilbara deposits, prompting immediate deferral of several crawler-crane rentals. Rental firms must meanwhile service debt on idle equipment and absorb storage, maintenance, and certification costs. Because mining clients increasingly adopt just-in-time procurement, utilization can swing from 95% to 55% within one quarter, stressing cash flows and covenant ratios. Geographic diversification helps, yet long-haul repositioning over 3,000 kilometres eats into any counter-cyclical gains. Banks react by tightening equipment-finance lines and demanding higher interest spreads.
Stringent Safety and Licensing Compliance Costs
Escalating safety compliance costs erode margins, particularly for small operators lacking economies of scale. High-risk work licences for cranes above 100 tons now have high command fees per operator in Victoria, while new onboarding courses consume five unbillable days. Every state applies differing logbook, rigging-plan, and spotter requirements, so firms active nationally fund multiple certifications for the same crew. Annual external engineering inspections, mandatory after two serious incidents in 2024, add high costs cost per unit. These overheads raise breakeven hire rates, yet price-sensitive contractors resist passing through the full increment to clients.
*Our forecasts treat driver/restraint impacts as directional, not additive. The impact forecasts reflect baseline growth, mix effects, and variable interactions.
Segment Analysis
By Product Type: All-Terrain Dominance Faces Crawler Surge
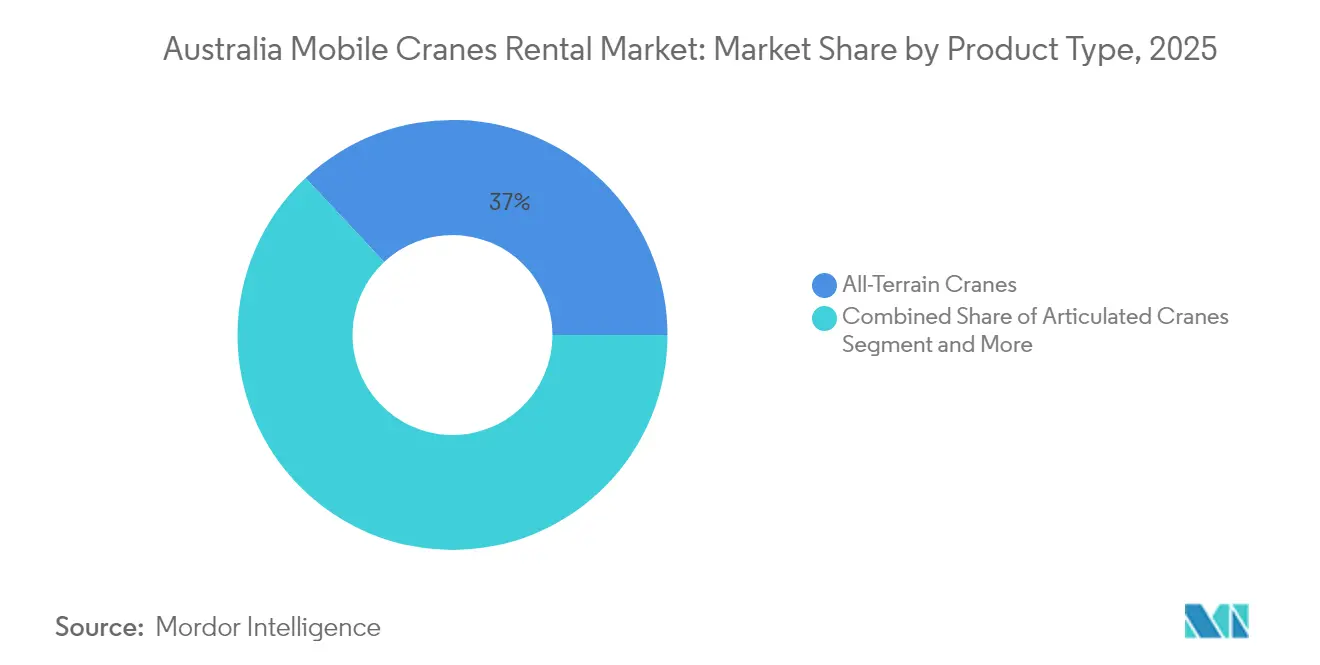
All-terrain cranes held 36.98% of the Australian mobile crane rental market share in 2025, reflecting their adaptability over paved and rough ground. Crawler units, however, are slated for 4.92% CAGR, paced by iron-ore expansions and larger wind turbines. Mammoet’s SK6000 demonstration renews client interest in ultralifting packages that exceed 6,000 tons. Rental firms diversify fleets with higher boom-length all-terrain models to retain urban infrastructure work, yet technology investments are steering capital allocation toward sensor-rich crawler cranes. Over the forecast period, the Australian mobile cranes rental market size for crawler units is projected to grow as miners embed long-term hire clauses linked to ore-price escalators.
The mid-scale truck-mounted category satisfies metro maintenance and highway widening assignments that demand daily relocation. Rough-terrain models remain entrenched in refinery overhauls, while articulated cranes retain niche demand inside industrial plants with low headroom. Equipment rotation strategies favor bundling of all-terrain and crawler packages to raise overall utilization and cross-sell value-added engineering services.



By Rental Type: Short-Term Leadership Yields to Long-Term Growth
Short-term hires accounted for 63.58% of the Australian mobile crane rental market share in 2025, yet their growth decelerated as contractors pursued predictability. Long-term contracts above twelve months will rise at a 5.88% CAGR on the back of multi-year transport projects. The Australian mobile cranes rental market size, attributable to long-term deals, will rise significantly by 2031, limiting seasonality for operators. Framework agreements bundle preventive maintenance, telemetry dashboards, and operator training, enhancing safety metrics and deepening client ties.
Emergency outage work, festival builds, and storm recovery keep short-term demand resilient, though pricing competition intensifies because barriers to entry are lower for smaller fleets. Suppliers exploiting digital booking portals win convenience-driven customers but must guard against price erosion via differentiated uptime guarantees.
By Application: Construction Leads While Marine Accelerates
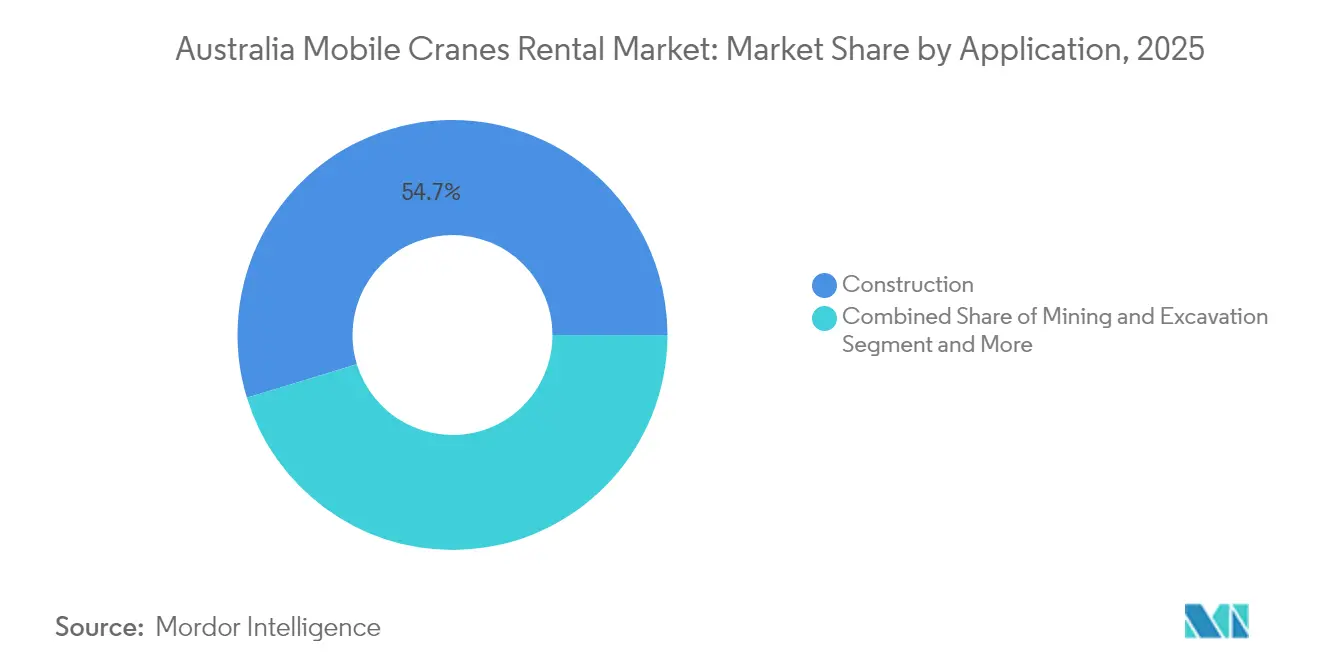
Construction absorbed 54.72% of the Australian mobile crane rental market share in 2025, driven by tunnel boring, elevated rail, and mixed-use high-rise developments in Sydney, Melbourne, and Brisbane. Port expansions at Hay Point and Fremantle, alongside front-end engineering for offshore wind, boost marine demand at a forecast 5.62% CAGR. The Australian mobile cranes rental market size linked to marine lifts will grow significantly by 2031 as operators deploy corrosion-resistant models with motion-compensation features.
Industrial maintenance for power utilities remains steady, highlighted by CS Energy’s FY2024 capital outlay that required multiple tandem lifts. The mining category shows cyclical spikes yet underpins long-duration projects that favor crawler equipment. Utilities investing in grid-scale battery storage also add substation lift tasks, broadening application diversity.
By Capacity: Light Capacity Dominates, Heavy Capacity Surges
Cranes up to 50 tons captured 47.62% of the Australian mobile crane rental market share in 2025 due to high metro construction, facility maintenance, and short-haul logistics utilization. Growth pivots to the above-300-ton tier at 6.37% CAGR because nacelle weights now exceed 120 tons and hub heights surpass 110 meters. XCMG’s XCA4000, tailored for 16 MW turbines, illustrates OEM response to wind-farm escalation. Rental firms hedge exposure by procuring modular boom inserts that up-rate existing platforms, optimizing capital spread.
Mid-range 51-150 ton units remain critical for bridge-beam setting and refinery turnarounds; however, pricing faces a squeeze as larger units drop rates to protect fleet turns during lean periods. Heavy-lift specialist divisions command premium gross margins, compensating for lower utilization through higher daily hire rates and ancillary engineering fees.
Geography Analysis
New South Wales kept 35.96% of the Australian mobile crane rental market share in 2025 on the back of Sydney Metro West and Western Harbour Tunnel packages. Regulatory certainty and mature subcontractor networks allow streamlined permitting processes, maintaining high baseline crane utilization. Fueled by new iron-ore capacity investment at Hope Downs 2 and other Pilbara assets, Western Australia is projected to log the strongest 5.25% CAGR. Rental operators position depots in Karratha and Port Hedland to slash mobilization miles, leveraging telematics for predictive parts staging.
Victoria’s Big Build sustains a significant revenue share, combining suburban rail loops and North East Link tunneling that demand nightly shifts, reinforcing demand for low-noise electric cranes. Queensland benefits from the 1,200 MW Forest Wind farm and Clarke Creek’s 450 MW array, drawing heavy-lift crawlers and 300-ton all-terrain units. South Australia rides onshore wind repowering and hydrogen pilot projects, anchoring moderate but persistent activity.
Geographic dispersion challenges fleet dispatch, as backhauls over 3,000 kilometers elevate deadhead cost. Operators, therefore, negotiate multi-state alliances or acquire regional peers to pool assets. Depreciation schedules align with demand clusters, retiring older engines first in states with tighter emission mandates. In aggregate, the Australian mobile cranes rental market will remain concentrated in the eastern seaboard, yet see outsized growth bursts in resource-rich west and north corridors.
Regulatory Landscape
Mobile crane rental operations in Australia sit under Work Health and Safety (WHS) frameworks implemented by state and territory regulators, supported by Safe Work Australia guidance. Key duties include ensuring cranes are safe to use, that operators hold the relevant high risk work licence categories, and that registrable plant requirements are met, including registration expectations for higher-capacity mobile cranes in many jurisdictions.
Regulation also increasingly influences fleet renewal and mobilisation logistics. ADR 80/04 introduced tighter noxious emissions requirements for new heavy vehicle models from 1 November 2024, affecting prime movers and support trucks used to move cranes and counterweights. Separately, the National Heavy Vehicle Regulator has communicated changes under heavy vehicle mass, dimension, and loading amendments with an August 2026 commencement, pushing rental firms to align configurations and access planning to reduce reliance on bespoke permits for oversize movements.
Value Chain Analysis
The value chain begins with OEMs supplying mobile cranes and related lifting equipment into Australia, followed by local distributors and service partners that support specification, importation, commissioning, and parts availability. Distributors and intermediaries such as TRT Australia, Eilbeck Cranes, and brokerage channels like Gleason Cranes connect equipment supply to fleet owners, while industry bodies including the Crane Industry Council of Australia (CICA) and the Hire and Rental Industry Association (HRIA) provide training, safety programs, and standards that shape operating practices.
Rental operators then deliver end-to-end lift solutions that combine equipment hire with operators, lift planning, permits, transport, and on-site execution for construction, mining, utilities, and marine work. Fleet utilisation and pricing are influenced by where civil packages are concentrated and how fast assets can be mobilised between states. Activity indicators such as the RLB Crane Index (Q1 2026) reporting 838 cranes operating nationwide highlight the dependence of downstream demand on non-residential and engineering/civil work, with large project clusters (for example, major Victoria packages) supporting sustained demand for higher-capacity and crawler units.
Competitive Landscape
The sector shows moderate consolidation. Coates, Boom Logistics, and Sarens anchor national coverage, while Urban Crane, Galaxy, and Universal Cranes defend regional niches. United Rentals announced its entry in 2024 by acquiring Shore Hire, signaling intensifying cross-border consolidation strategies. Scale affords bulk-purchase discounts and telematics platform investments that smaller players struggle to match.
Technology is a central differentiator. Early adopters embed real-time load sensors, automated outrigger deployment, and geo-fencing, features proven to cut incident rates. Partnerships with OEMs on Stage V retrofits allow compliant fleets to command premiums on government projects with green-procurement clauses. Specialist firms carve moats in ultra-heavy-lift, offshore wind, and shutdown maintenance segments where engineering know-how limits commoditization.
Despite high capital barriers, niche entrants offering autonomous lifting supervision or hybrid powertrains can disrupt traditional models. Incumbents, therefore, accelerate R&D alliances with sensor and battery makers, positioning fleets for looming offshore wind tenders and hydrogen-hub construction. Insurance providers increasingly price premiums on telematics data, rewarding operators with clean safety records and predictive maintenance regimes.
Australia Mobile Cranes Rental Industry Leaders
Boom Logistics Ltd
Tutt Bryant Group
Freo Group
Mammoet Australia
Kennards Hire
- *Disclaimer: Major Players sorted in no particular order

Market Opportunities and Future Outlook
Opportunities cluster around long-duration civil packages, energy transition builds, and the enabling logistics that accompany heavier, longer-reach lifts. InfrastructureAustralia maintains a national project pipeline through its priority lists, and in South Australia tunnelling commencement on the River Torrens to Darlington (T2D) project in July 2026 underscores the scale of underground works that draw recurring crane demand for shaft sites, precast segments, site logistics, and maintenance lifts. Similarly, the High Speed Rail Authority appointing Bechtel for the Sydney-Newcastle development phase in July 2026 signals an active program framework that drives earlier-stage demand for site establishment, investigations, and enabling works that feed into multi-year crane utilisation.
A second whitespace area sits in fleet modernisation and compliance-linked logistics efficiency. ADR 80/04 and upcoming NHVR mass and dimension changes elevate the value of rental providers that can supply compliant support vehicles, optimize route approvals, and package crane hire with engineered transport and permitting. Industry advocacy, including CICA submissions seeking more streamlined access and digital route approval concepts, further reinforces a pathway for operators with telematics, documentation automation, and multi-state compliance capability to win framework-style work. On the supply side, visible fleet and capability investments such as Borger Crane Hire and Rigging ordering 17 Liebherr cranes in May 2026, and Cranecorp Australia adding a Liebherr LTM1650-8.1 in May 2026, indicate where customers are paying for higher-capacity all-terrain reach and reliability for renewables, transmission, and major infrastructure maintenance.
Recent Industry Developments
- June 2026: Boom Logistics announced a contract extension with BHP at the Olympic Dam mine for up to seven years. The award underpins long-tenure fleet deployment and resourcing at a major mining asset, supporting planning for equipment allocation and service coverage over a multi-year horizon.
- May 2026: Cranecorp Australia added a Liebherr LTM1650-8.1 all-terrain crane to its fleet, expanding capacity for renewables, transmission, and major infrastructure maintenance projects.
- November 2024: ADR 80/04 tightened emissions requirements for new heavy vehicle models entering service, affecting crane transport fleets and permitting.


Research Methodology Framework and Report Scope
Market Definition and Coverage
This market covers the revenue earned in Australia from renting mobile cranes. It includes typical hire arrangements where a crane is supplied for a defined job duration, with related operating support when contracted. The sizing is calculated in value terms in USD for the study years.
Scope exclusions: it excludes the sale of cranes, fixed tower cranes, and revenue that sits mainly under heavy haulage or general equipment rental when mobile crane hire is not the primary service.
Segmentation Overview
- By Product Type
- All-Terrain Cranes
- Articulated Cranes
- Truck-Mounted Cranes
- Rough-Terrain Cranes
- Crawler Cranes
- By Rental Type
- Short-Term (Less than/equals 12 months)
- Long-Term (Above 12 months)
- By Application
- Construction
- Mining and Excavation
- Marine and Offshore
- Industrial and Utilities
- By Capacity
- Up to 50 tons
- 51-150 tons
- 151-300 tons
- Above 300 tons
- By Region (Australia)
- New South Wales
- Victoria
- Queensland
- Western Australia
- South Australia
- Rest of Australia
Data Sources, Market Sizing, and Validation
Desk Research
Desk work starts with building a demand view for crane hire across Australia, then aligning it to realistic utilization and pricing assumptions. We refer to public sources such as the Australian Bureau of Statistics for construction and mining activity signals, Infrastructure Australia project pipelines, and state planning and major projects portals for timing of large builds.
We also review the trade and regulatory context because it affects fleet availability and operating cost. Sources such as Australian Border Force and customs trade statistics help sense equipment inflows. Standards and safety guidance (for example from Safe Work Australia) are used to understand compliance-related cost pass-through. This is complemented with company annual reports, investor presentations, and reputable news coverage to map fleet renewal, contract mix, and regional exposure. We also use a paid subscription focused on company financials and intelligence to verify entity-level basics. These desk sources are not exhaustive, and many other public references were used for data collection, cross-checking, and clarification.
Primary Interviews and Surveys
Primary work is used to pressure-test what the secondary indicators imply, especially around day rates, operator inclusion, utilization swings, and how quickly large projects move from tender into lift scheduling. We spoke with a mix of rental providers, contractors that procure lifting services, and industry specialists across major crane-demand states (including activity linked to mining regions and metro infrastructure) so gaps in assumptions could be closed before totals were finalized.
Distribution of primary research fieldwork respondents
| Company type | Respondent position |
|---|---|
| Top tier: 26% | CXOs: 12% |
| Mid tier: 57% | Functional/Unit leaders: 30% |
| Smaller Players: 17% | Managers: 58% |
Market-Sizing & Forecasting
Sizing starts from a top-down build where construction, mining, and industrial activity indicators are translated into a realistic crane-hire demand pool by state, then adjusted for the share typically fulfilled through rentals versus owned fleets. After the demand pool is formed, it is converted to value using practical inputs such as average hire duration patterns (short-term versus long-term), typical utilization ranges by crane category, day-rate movements by capacity class, and the project mix shift between civil infrastructure and resources work.
To keep the totals grounded, we corroborate with selective bottom-up checks, including sampled fleet counts and utilization discussions, channel checks on quoted day rates, and an ASP times volume sanity test for high-activity regions. When some company-level revenue is not cleanly separable, we handle it through proportional allocation based on service mix and on-the-ground feedback from interviews, then review reasonableness at the state level.
For forecasting, scenario analysis is used because rental demand can step up or cool down quickly when major projects move in or out of execution. The forward view is shaped by variables like public infrastructure award cycles, mining capex momentum, wind farm and energy project starts, labor availability for operators and rigging crews, and cost inflation items that influence pricing resets. Assumptions are aligned to what primary respondents consider feasible for rate progression and utilization over the forecast window.
Data Validation & Update Cycle
Validation is done through cross-checks that compare the model output against independent signals, and any large variance is investigated before sign-off. We run anomaly checks across states, rental length, and application mix so one-off project spikes are not mistakenly treated as steady demand, and we review the logic through multiple analyst passes.
When a mismatch is found, the trigger is to re-check the input series, revisit the pricing and utilization assumptions, and re-contact relevant interviewees if the gap is meaningful. The report is refreshed annually, with interim updates when major events materially change rental activity or price behavior. Before delivery, a final review pass is completed so the numbers and narratives reflect the latest available public data points.
Mordor Intelligence's Australia Mobile Cranes Rental Market Size Versus Other Published Estimates
Published market sizes for Australia mobile crane rentals can appear far apart because the service scope is not always defined the same way, and pricing can be treated differently across short jobs versus long contracts. Differences also show up when studies use different base years, assume different utilization levels, or convert currencies using different timing.
The main gap comes from whether operator and lift-planning charges are counted inside rental revenue or left in adjacent service buckets. In the Mordor Intelligence model, these charges are included only when they are contracted as part of the crane hire invoice, rather than as a separate construction labor line item.
Benchmark comparison
| Source | Market Size | Gaps in Research Methodology |
|---|---|---|
| Mordor Intelligence | USD 0.37 B (2025) | |
| Industry Research Publisher A | USD 0.19 B (2025) | Uses a narrower counted revenue base that appears to underweight long-term contracts and higher-capacity lifts, and the lower total is consistent with more conservative utilization and day-rate assumptions by state. |
| Global Consultancy B | USD 0.30 B (2024) | Anchors the value to an earlier base year and applies a broader growth rate without clearly separating short-term spot hires from contract-based work, which can shift the average price and utilization inputs. |
The spread in the table is mainly explained by how each study draws the line between pure crane hire revenue and nearby service revenue, and by how they treat utilization and rate progression across states. By keeping the variables tied to observable project activity, realistic hire patterns, and interview-checked pricing, the estimate stays traceable and repeatable even when the project cycle turns.


Key Questions Answered in the Report
What is the projected revenue for Australia mobile cranes rental by 2031?
It is forecast to reach USD 487.89 million, rising at a 4.75% CAGR.
Which crane type is expected to grow fastest?
Crawler cranes will post a 4.92% CAGR through 2031 due to mining and wind-farm demand.
Why are long-term rental contracts gaining popularity?
Contractors seek predictable costs and guaranteed availability for multi-year projects, driving a 5.88% CAGR in long-term agreements.
Which capacity segment shows the highest growth?
Cranes above 300 tons will rise at a 6.37% CAGR, propelled by heavier wind-turbine components.
Page last updated on:





