Market Overview
| Study Period | 2020 - 2031 |
|---|---|
| Forecast Data Period | 2026 - 2031 |
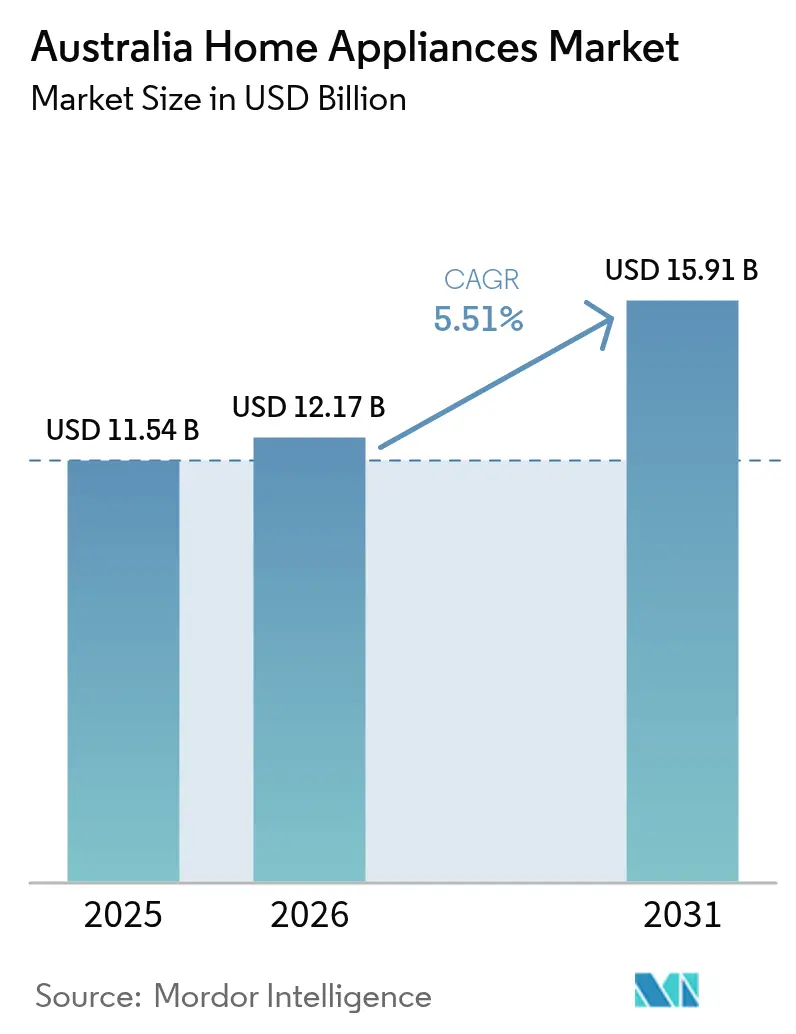
| Base Year Market Size (2025) | USD 11.54 Billion |
| Market Size (2026) | USD 12.17 Billion |
| Market Size (2031) | USD 15.91 Billion |
| Growth Rate (2026 - 2031) | 5.51% CAGR |
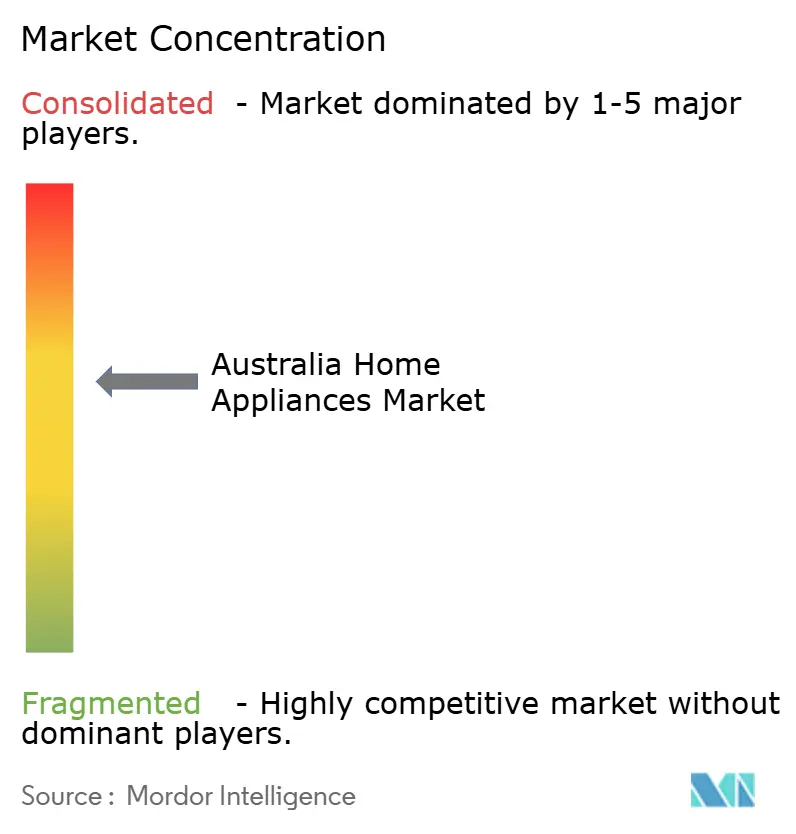
| Market Concentration | Medium |
Major Players *Disclaimer: Major Players sorted in no particular order Image © Mordor Intelligence. Reuse requires attribution under CC BY 4.0. | |
Australia Home Appliances Market Analysis by Mordor Intelligence
The Australia home appliances market size is expected to grow from USD 11.54 billion in 2025 to USD 12.17 billion in 2026 and is forecast to reach USD 15.91 billion by 2031 at a 5.51% CAGR over 2026-2031. The near-term growth profile reflects stricter appliance efficiency rules, a fast shift to electrification in buildings, and household budget pressures that are shaping product choices and channel mix. Victoria’s all-electric rules for new homes from January 2027 and ongoing federal support for home batteries are pulling forward purchases of induction cooktops and heat pump water heaters. Air conditioning portfolios are being refreshed ahead of HFC phase-down milestones and global warming potential limits, which is fueling R32 adoption and faster model churn than housing starts alone would imply. Meanwhile, online penetration keeps rising as retailers deepen buy-now-pay-later integrations that smooth large-ticket purchases, even as consumers stretch replacement cycles in response to cost-of-living constraints[1]JB Hi Fi, “Investor & Company Information,” JB Hi Fi, jbhifi.com.au.
Key Report Takeaways
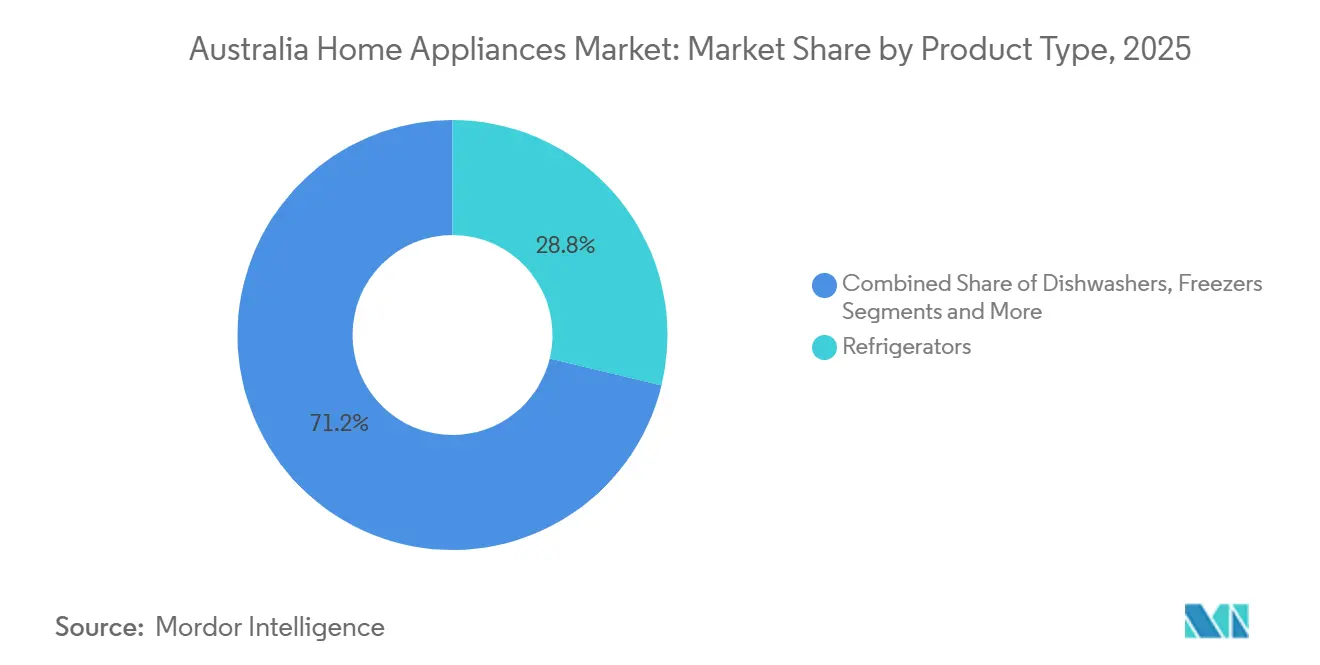
- By product type, refrigerators led with 28.78% of the Australian home appliances market share in 2025, while dishwashers posted the fastest 5.57% CAGR through 2031.
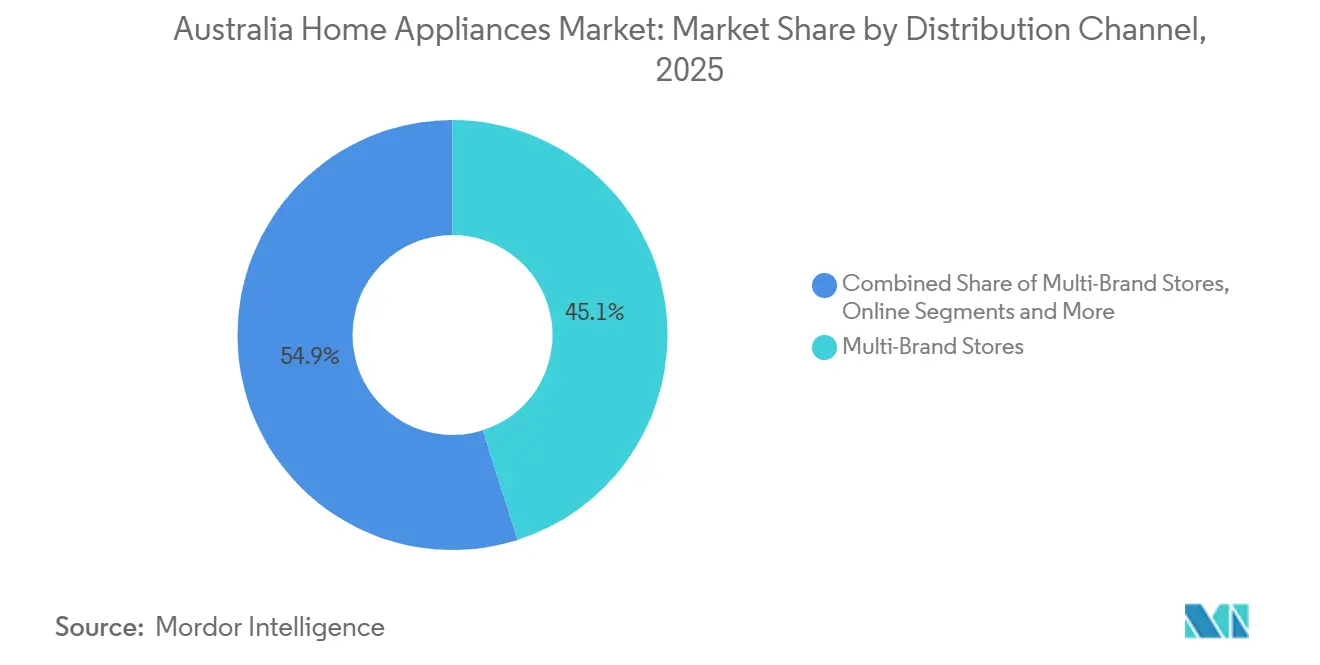
- By distribution channel, multi-brand stores accounted for 45.10% of the Australian home appliances market share in 2025, whereas online recorded a 6.02% CAGR through 2031.
- By geography, Eastern Australia held 34.05% of the Australian home appliances market share in 2025 and is forecast to expand at a 5.04% CAGR through 2031.
Note: Market size and forecast figures in this report are generated using Mordor Intelligence’s proprietary estimation framework, updated with the latest available data and insights as of 2026.
Australia Home Appliances Market Trends and Insights
Drivers Impact Analysis*
| Driver | (~) % Impact on CAGR Forecast | Geographic Relevance | Impact Timeline |
|---|---|---|---|
| MEPS-Driven Efficiency Upgrades (GEMS Program) | +0.9% | Global, strongest in NSW and VIC metro areas, with high compliance density | Medium term (2-4 years) |
| WELS-Labeled Water Savings Shaping Washer/Dishwasher Choices | +0.7% | APAC core, strongest in SA and WA water-scarce markets, with spill-over to QLD | Short term (≤ 2 years) |
| E-Commerce Acceleration Shifting Channel Mix | +1.1% | Global, metro-centric initially, expanding to regional via click-and-collect | Short term (≤ 2 years) |
| HFC Phase-Down Catalyzing AC Model Refresh and Replacements | +1.3% | National, with early gains in QLD and NSW coastal heatwave zones | Medium term (2-4 years) |
| State Building Electrification Spurring Induction/Heat-Pump Uptake | +1.6% | VIC and ACT primary, SA and NSW following regulatory signals | Long term (≥ 4 years) |
| Rooftop Solar + Batteries Enabling Daytime Appliance Loads | +0.8% | QLD and SA with >50% solar in freestanding homes, expanding to VIC and NSW suburban corridors | Medium term (2-4 years) |
| Source: Mordor Intelligence | |||
MEPS-Driven Efficiency Upgrades (GEMS Program)
The October 2025 commencement of revised GEMS determinations for dishwashers, washing machines, and clothes dryers marks the steepest efficiency escalation in a decade, yet the real leverage lies in manufacturers' strategic response to the 12-month compliance window. Between October 2024 and September 2025, the GEMS Regulator processed 5,697 registration applications with air conditioners (732), refrigerated cabinets (685), and washing machines (568) dominating SKU churn, while check-testing revealed a 77% pass rate, meaning one in four registered models failed MEPS on revalidation[2]Source: Energy Rating, “Appliance Energy Efficiency and GEMS Determinations,” Australian Government, energyrating.gov.au. Independent review activity and audit requirements add cost that larger manufacturers can amortize across wide portfolios, while mid-tier brands face tighter budgets for testing and rework when determinations change. The program’s household savings outcomes remain material, with the government reporting multi-billion dollar aggregate bill savings tied to standards and labeling across major appliances. As thresholds rise again throughout the decade, brands with pre-certified high-efficiency SKUs are better positioned to protect sell-through and avoid stranded inventory risk during label transitions.
State Building Electrification Spurring Induction/Heat‑Pump Uptake
In Australia, state policies on building electrification are hastening the transition from gas to electric appliances in homes. This shift is notably increasing the demand for induction cooktops and heat pumps. As part of national net-zero targets, all new government buildings must be all-electric starting in 2026. These buildings will prioritize electric systems for heating, cooling, and hot water, aligning with Green Star ratings. Victoria’s rules that ban new gas connections in new homes starting January 2027 are a durable signal for induction cooking and heat pump hot water in new builds. The Australian Capital Territory’s earlier move to phase out new gas connections reinforced the direction of travel for regulators, builders, and appliance suppliers. The structure of rebates for heat‑pump technologies through Solar Victoria is drawing some demand forward, and it is nudging assortment decisions by retailers ahead of construction cycles. As rules expand in scope, brands must manage split portfolios that cover compliance‑ready ranges for new builds and value‑oriented gas SKUs for the replacement aftermarket in legacy housing stock.
WELS-Labeled Water Savings Shaping Washer/Dishwasher Choices
Australia’s WELS scheme has moved from a passive disclosure label to a direct purchase driver where water costs and scarcity are salient, especially for dishwashers and front‑load washers. The program’s updated labeling and closer alignment with energy standards in late 2025 increased the importance of co‑optimizing water use and electricity consumption during product development. Consumers in South Australia and Western Australia respond to clear liters-per-cycle differences at the point of sale, reinforcing a shift toward top-rated models. As WELS coverage expands into more commercial end uses and taps in 2026, development roadmaps and supplier qualification are tightening across global platforms that serve Australia, improving long‑term label trust and comparability[3]Water Rating (WELS), “About WELS and Water Efficiency Savings,” Australian Government, waterrating.gov.au.
HFC Phase-Down Catalyzing AC Model Refresh and Replacements
Australia’s HFC import quota reduction from January 2026 and progressive GWP limits for air conditioners are accelerating transitions away from R410A toward R32 in split systems. The staged caps created a window to sell through legacy stock and then pivot to compliant systems, which temporarily inflated model registrations and promotional activity as changes neared. Installer networks continue to adjust to refrigerant supply and handling rules, which can extend service lead times for legacy systems in some regions during the transition. For manufacturers, the shift supports premium positioning for next‑generation units and incentivizes early recertification to secure continuity of supply under evolving standards.
Restraints Impact Analysis*
| Restraint | (~) % Impact on CAGR Forecast | Geographic Relevance | Impact Timeline |
|---|---|---|---|
| Cost-of-Living Squeeze Delaying Replacements | -1.2% | National, most acute in NSW and VIC urban centers with high mortgage stress | Short term (≤ 2 years) |
| E-Waste/Product Stewardship Adding Compliance and Take-Back Costs | -0.6% | NSW under PLR Act, WA landfill ban; spillover via NTCRS nationally | Medium term (2-4 years) |
| Frequent MEPS/WELS Updates Driving SKU Churn and Certification Burden | -0.5% | Global, concentrated among tier-two brands, lacking scale for continuous recertification | Long term (≥ 4 years) |
| Refrigerant Transition Licensing/Training Raising Service Costs | -0.4% | Regional Australia, due to installer scarcity, metro areas are less affected. | Medium term (2-4 years) |
| Source: Mordor Intelligence | |||
Cost of Living Squeeze Delaying Replacements
January 2026 CPI data showed that household furnishings and equipment rose 1.4%, which lagged overall housing at 6.8% and signaled buyers were cautious and selective with large appliance purchases. As the electricity price support tapered, households faced higher power bills, which enhanced interest in efficient models but also encouraged deferring discretionary upgrades until failure[4]Australian Bureau of Statistics, “Consumer Price Index, Monthly Indicator,” Australian Bureau of Statistics, abs.gov.au. Retail trade data around late 2025 indicated soft conditions for big‑ticket items even amid promotional events, which pushed retailers to rely more on financing and bundle offers to move inventory. Asset life assumptions in tax guidance for common appliances underscore that many buyers seek to extend use beyond typical schedules during tight budget periods, which lengthens replacement intervals. The effect is a split market where premium tiers hold up among affluent buyers while mid‑tier volumes come under pressure during high‑inflation months.
E Waste/Product Stewardship Adding Compliance and Take Back Costs
Policy momentum is building toward extended producer responsibility for batteries and, in time, large appliances, which would shift a share of end‑of‑life costs to brand owners. Local government analysis in Greater Sydney quantified disposal costs and potential material recovery gains, which have shaped policy design and future levy discussions. Western Australia’s landfill ban for e‑waste established specific handling requirements and certification expectations for processors, which increased compliance tasks and logistics planning for brands active in that state. At the federal level, the National Television and Computer Recycling Scheme framework provides a model for higher collection targets that could be adapted to whitegoods in later phases. The transition period carries cost uncertainty because rules and reporting vary by jurisdiction, which complicates national compliance system design for manufacturers.
*Our forecasts treat driver/restraint impacts as directional, not additive. The impact forecasts reflect baseline growth, mix effects, and variable interactions.
Segment Analysis
By Product: Premium Tiers Harvest Electrification Windfall
Refrigerators led category share at 28.78% in 2025, while dishwashers recorded the fastest trajectory at a 5.57% CAGR through 2031 on the back of label improvements and water savings proof points that resonate in water‑scarce regions.. Air conditioners are in the midst of an accelerated refrigerant transition where R32‑based split systems are now the norm for new sales after HFC phase‑down steps and GWP caps took effect, which pushed suppliers to refresh portfolios ahead of typical replacement cycles.. The Australian home appliances market reflects this shift in product planning through synchronized launch windows and pre‑certified variants to maintain stock continuity as thresholds rise. Heat‑pump dryers, included within other major appliances, benefit from Whole‑of‑Home rules in several states and are specified more often in new builds, which reinforces category price premiums and shifts energy savings messaging into the mid‑tier. Small appliances continue to be influenced by online discovery and fast refresh cycles, which favor brands with direct‑to‑consumer channels and rapid design iteration in items like coffee makers, air fryers, and vacuums.
Within premium refrigeration, connected features backed by brand ecosystems have expanded, including internal cameras and app‑based food management, which support higher average selling prices and service attachments. Ovens and cooktops show a visible turn toward induction in jurisdictions where gas connections for new homes are ending, and rebate frameworks are in place for efficient water and heating systems. The Australian home appliances market dynamics in premium built‑in products also benefit from renovation projects in metro areas, where compact European formats and higher star ratings can align performance with smaller living spaces. Brands that can amortize R&D and certification costs across global ranges have a structural advantage in meeting MEPS and WELS updates without disrupting availability.


By Distribution Channel: Click and Collect, Bridges Digital and Physical
Multi‑brand stores held 45.10% of sales in 2025, while online is the fastest‑growing channel at a 6.02% CAGR through the forecast period (2026-2031), due to marketplace integrations and financing options that smooth large‑ticket spending. The Australian home appliances market continues to see hybrid models such as click‑and‑collect gain share as customers combine in‑store validation with digital transactions, which reduces friction for refrigerator and dishwasher purchases that still benefit from physical inspection. Premium brands use exclusive outlets to elevate service and attach installation, which increases conversion rates relative to multi‑brand floors and supports premium positioning. Direct‑to‑consumer initiatives by leading manufacturers, including membership offers and trade‑in credits, reinforce pull‑through and help manage price integrity during promotions.
The Australian home appliances industry has also synchronized promotional calendars with retail partners to anchor sales around major events, which shapes inventory allocations and marketing budgets. E‑commerce momentum in regional areas continues to improve as delivery thresholds and logistics reliability approach metro levels, supported by the national broadband footprint. Builder and strata channels remain important for pre‑specification of bundles that meet energy standards in new housing, especially under Victoria’s all‑electric requirements that steer choices toward induction and heat‑pump packages. As online grows, floor space productivity pressures legacy chains to optimize assortment and demonstrate labelling benefits in‑store, which complements digital education on water and energy ratings.
Geography Analysis
Eastern Australia captured 34.05% in 2025 and remains the largest region by value, supported by the density of multi‑family housing and a higher premium mix in metro corridors. Its forecast 5.04% CAGR through 2031 is below the national pace since the installed base is more mature and high‑efficiency features are now commonplace in replacements. Continued program updates under the Energy Savings Scheme in New South Wales support steady upgrade cycles for HVAC and hot water appliances, even as public policy on new gas connections diverges from Victoria’s path. Victoria’s rules for all‑electric new homes in 2027, and rebates for heat‑pump technologies, are shifting the specification of induction cooktops and heat‑pump water systems in advance of deadlines, with retailers and builders anchoring bundle offers accordingly.
Southern Australia stands out for water-efficiency-led purchasing in washers and dishwashers, where WELS labels are prominent at the point of sale. High rooftop solar penetration in South Australia has created favorable conditions for running dishwashers and dryers in daytime windows, which increases the appeal of scheduling and energy monitoring functions. Tasmania’s building energy rules and renewable generation mix maintain a distinct buyer profile where aesthetics and reliability are often as important as advanced connectivity, especially in renovation cycles. As these conditions persist, the Australia home appliances market sees a broader shift where inverter compressors and heat‑pump technologies move from premium differentiators to baseline expectations in several Southern sub‑segments.
Western Australia’s distance from eastern distribution hubs requires dedicated warehousing for consistent availability and service coverage, especially in cooling categories. The state’s e‑waste landfill ban places early responsibility on collection networks and certified processors, which likely foreshadows similar measures elsewhere as stewardship frameworks broaden. In the Northern Territory, climatic extremes concentrate demand in larger‑capacity split systems and tropical‑rated refrigerators, where performance, durability, and service support are key to conversion. Together, these factors produce region‑specific assortments and service models that influence pricing, lead times, and feature baselines across the Australian home appliances market.
Competitive Landscape
The competitive core of the Australian home appliances market is concentrated across LG, Samsung, Electrolux Group, and Fisher & Paykel, which together hold an estimated nearly half of the major appliance value share, while BSH brands, Miele, Hisense, and Haier cover premium built‑ins and value segments. Portfolio strategy is shaped by converging energy, water, and refrigerant rules, which favor players able to cluster R&D and certification spending across multiple categories in the same product cycle. Software ecosystems are now a strategic layer, elevating features like inventory cameras in fridges, AI‑assisted wash cycles, and app‑based diagnostics that support premium positioning and potential services revenue. Smaller specialists rely on design‑led differentiation and selective category depth to hold share as standards tighten.
Product announcements in late 2025 and early 2026 highlight this direction. LG previewed AI‑enhanced SIGNATURE appliances that integrate conversational interfaces, predictive cooling, and camera‑based ingredient recognition to support connected kitchen workflows. Samsung’s Bespoke AI platform advanced laundry combos with faster cycles and adaptive programs, while connected vacuums introduced on‑device intelligence for better navigation and object recognition. Fisher & Paykel refreshed fabric care with heat‑pump dryers and expanded built‑in refrigeration ranges that align with Whole‑of‑Home efficiency budgets and premium kitchen design. These moves show investment clustering at the intersection of efficiency, user experience, and connectivity.
Compliance posture has become a competitive variable. Government audit findings in 2025 put a spotlight on registration processes and check‑testing volumes under the GEMS framework, which raised the stakes for robust internal compliance at higher‑volume brands. Western Australia’s e‑waste rules and New South Wales’ product responsibility settings for batteries are pushing pilots in take‑back, repair, and recycling that large retailers and manufacturers must align with. Retail leaders are expanding marketplace integrations and finance options to support conversion in a price‑sensitive environment, while members‑only offers and trade‑ins strengthen direct channels. As distributed energy resources grow, grid‑aware features and participation in virtual power plant programs are emerging as new arenas for value creation that may favor connectivity platforms and software intermediaries.
Australia Home Appliances Industry Leaders
Electrolux AB
LG Electronics
Samsung Electronics
Fisher & Paykel Appliances
BSH Home Appliances
- *Disclaimer: Major Players sorted in no particular order

Recent Industry Developments
- December 2025: Samsung Australia previewed its AI-connected living lineup ahead of CES 2026, announcing an upgraded bespoke AI laundry combo for the Australian market. The new model features shortened wash-to-dry cycles and an auto-open door plus function for passive ventilation, alongside the bespoke AI jet bot ultra vacuum capable of climbing 60 mm thresholds.
- November 2025: LG Electronics Australia secured the choice best brand recognition across major appliance categories, including stick vacuums in 2024 and 2025, dryers in 2025, and top load washers for four consecutive years from 2022 to 2025, validating product reliability and performance in Australia's highly trust-sensitive market.
- November 2025: LG Electronics expanded its CordZero A9L handstick vacuum lineup in Australia, delivering up to 37.5% more suction power and auto-emptying dustbins. This launch capitalized on recent finder awards and choice recommendations to directly compete with Dyson's entrenched cordless vacuum leadership.
- September 2024: Samsung expanded its laundry range in Australia by launching the first of its kind large capacity bespoke AI heat pump combo. Retailing from USD 5499, it utilizes a super-speed cycle to wash a 3 kg load in 28 minutes and dry it in 70 minutes, directly addressing consumer demands for energy and space efficiency.


Australia Home Appliances Market Report Scope
A home appliance is referred to as a domestic electrical appliance that will assist in household work and ease human efforts. A complete background analysis of the Australia home appliances market report includes an assessment of the industry associations, overall economy, and emerging market trends by segments, significant changes in the market dynamics, and market overview. The Market is Segmented by Major Appliances (Refrigerators, Freezers, Dishwashing Machines, Washing Machines, Ovens, Air Conditioners, and Other Major Appliances), Small Appliances (Coffee/Tea Makers, Food Processors, Grills and Toasters, Vacuum Cleaners, and Other Small Appliances), and Distribution Channel (Multi-brand Stores, Exclusive Stores, Online, and Other Distribution Channels). The report offers market size and forecasts for the Australia Home Appliances Market in value (USD million) for all the above segments.
By Product
| Major Home Appliances | Refrigerators |
| Freezers | |
| Washing Machines | |
| Dishwashers | |
| Ovens (Incl. Combi & Microwave) | |
| Air Conditioners | |
| Other Major Home Appliances | |
| Small Home Appliances | Coffee Makers |
| Food Processors | |
| Grills & Roasters | |
| Electric Kettles | |
| Juicers & Blenders | |
| Air Fryers | |
| Vacuum Cleaners | |
| Electric Rice Cookers | |
| Toasters | |
| Counter-top Ovens | |
| Other Small Home Appliances |
By Distribution Channel
| Multi-Brand Stores |
| Exclusive Brand Outlets |
| Online |
| Other Distribution Channels |
By Geography
| Eastern Australia |
| Northern Australia |
| Southern Australia |
| Western Australia |
| By Product | Major Home Appliances | Refrigerators |
| Freezers | ||
| Washing Machines | ||
| Dishwashers | ||
| Ovens (Incl. Combi & Microwave) | ||
| Air Conditioners | ||
| Other Major Home Appliances | ||
| Small Home Appliances | Coffee Makers | |
| Food Processors | ||
| Grills & Roasters | ||
| Electric Kettles | ||
| Juicers & Blenders | ||
| Air Fryers | ||
| Vacuum Cleaners | ||
| Electric Rice Cookers | ||
| Toasters | ||
| Counter-top Ovens | ||
| Other Small Home Appliances | ||
| By Distribution Channel | Multi-Brand Stores | |
| Exclusive Brand Outlets | ||
| Online | ||
| Other Distribution Channels | ||
| By Geography | Eastern Australia | |
| Northern Australia | ||
| Southern Australia | ||
| Western Australia | ||


Key Questions Answered in the Report
What is the size of the Australian home appliances market in 2026, and how fast is it growing to 2031?
In 2026 the Australia home appliances market size is USD 12.17 billion and it is forecast to reach USD 15.91 billion by 2031 at a 5.51% CAGR.
Which product categories lead to value and growth in Australia?
Refrigerators led with 28.78% value share in 2025, while dishwashers recorded the fastest category growth at a 5.57% CAGR through 2031.
How are policies influencing the electrification of Australian homes?
Victoria will require all new homes from January 2027, and heat pump rebates are in place, which together are pulling forward induction and heat pump adoption in new builds and replacements.
What is happening with refrigerants in residential air conditioning?
Australia’s HFC phase down and product GWP limits are accelerating a shift from R410A to R32 in split systems, prompting portfolio refreshes and installer training for compliant handling.
Which channels are winning in Australia for appliance sales?
Multi-brand stores held 45.10% in 2025, while online is the fastest growing channel at a 6.02% CAGR due to marketplace features and financing options.
How are cost-of-living trends affecting appliance replacements in Australia?
January 2026 CPI showed furnishings and equipment at 1.4% versus stronger housing inflation, which is causing cautious replacement behavior and longer use of existing appliances.
Page last updated on:


