New Zealand Data Center Storage Market Size and Share
Market Overview
| Study Period | 2020 - 2031 |
|---|---|
| Forecast Data Period | 2026 - 2031 |
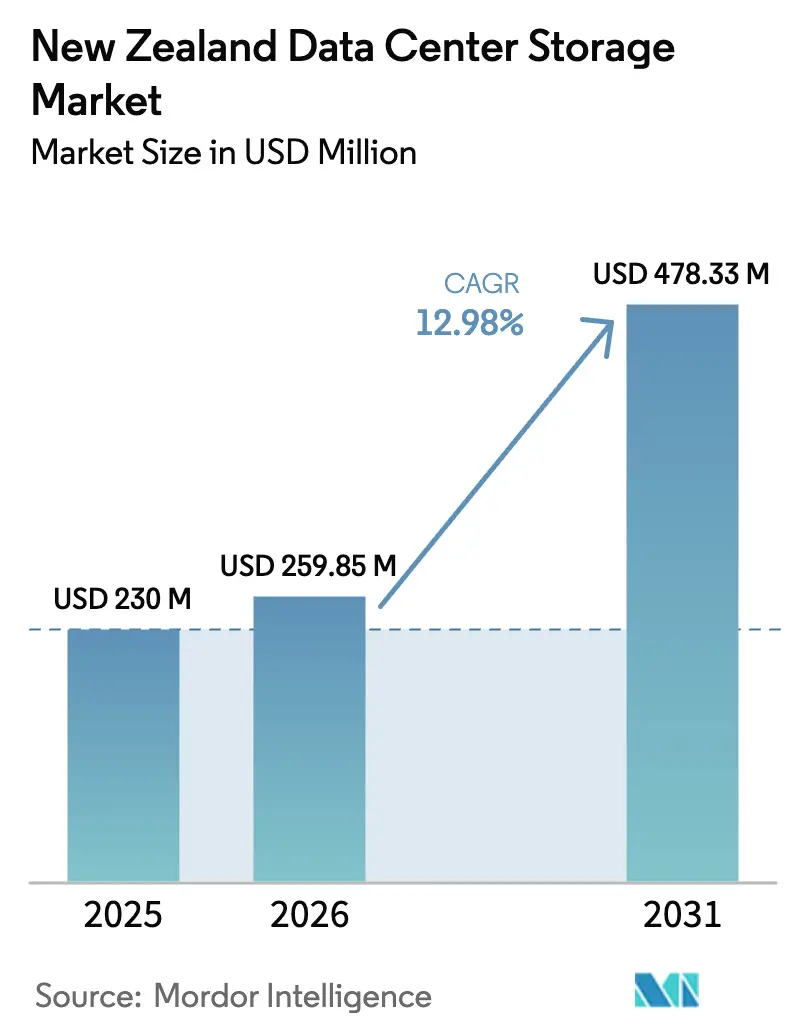
| Base Year Market Size (2025) | USD 230 Million |
| Market Size (2026) | USD 259.85 Million |
| Market Size (2031) | USD 478.33 Million |
| Growth Rate (2026 - 2031) | 12.98% CAGR |
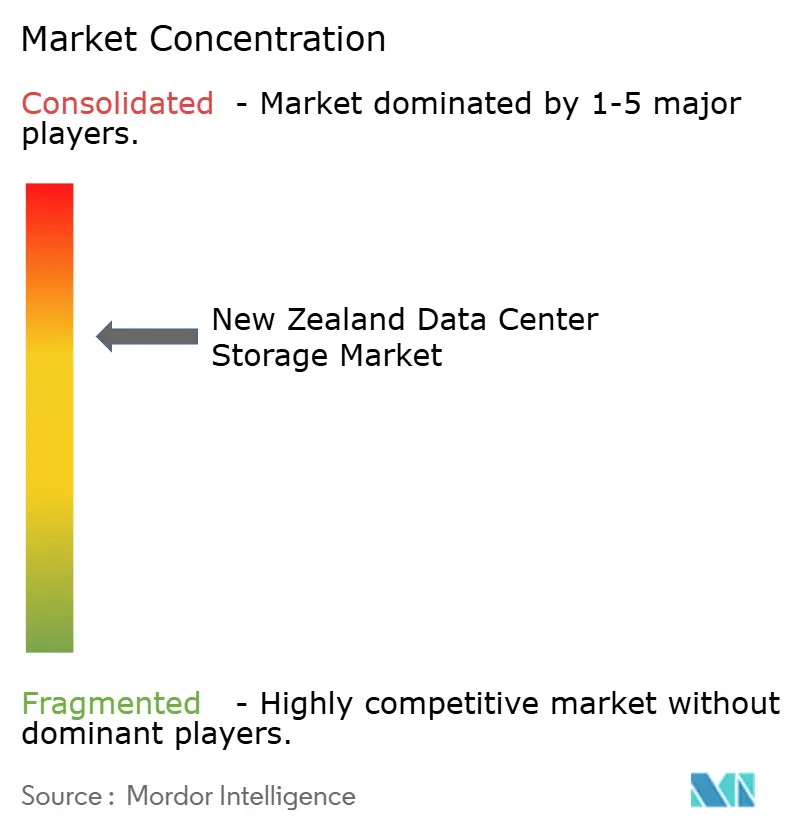
| Market Concentration | Medium |
Major Players *Disclaimer: Major Players sorted in no particular order Image © Mordor Intelligence. Reuse requires attribution under CC BY 4.0. | |
New Zealand Data Center Storage Market Analysis by Mordor Intelligence
The New Zealand data center storage market size is expected to grow from USD 230 million in 2025 to USD 259.85 million in 2026 and is forecast to reach USD 478.33 million by 2031 at 12.98% CAGR over 2026-2031. Strong hyperscale commitments led by Amazon Web Services’ USD 7,500 million Auckland region and Microsoft’s newly cleared local region are accelerating capacity additions and sparking record procurement of high-performance storage platforms. Government policy that keeps sensitive data within national borders, coupled with a landmark Māori data sovereignty framework, is creating a premium for on-shore storage that can demonstrate cultural as well as technical compliance. Rapid uptake of AI workloads in media, telecom, and research pushes enterprises toward NVMe-based all-flash systems that deliver low-latency access to training data while lowering energy use purestorage. Meanwhile, seismic resilience mandates add 15-20% to build cost, yet they also raise the attractiveness of scalable colocation and multi-region replication architectures that can survive a major earthquake without data loss
Key Report Takeaways
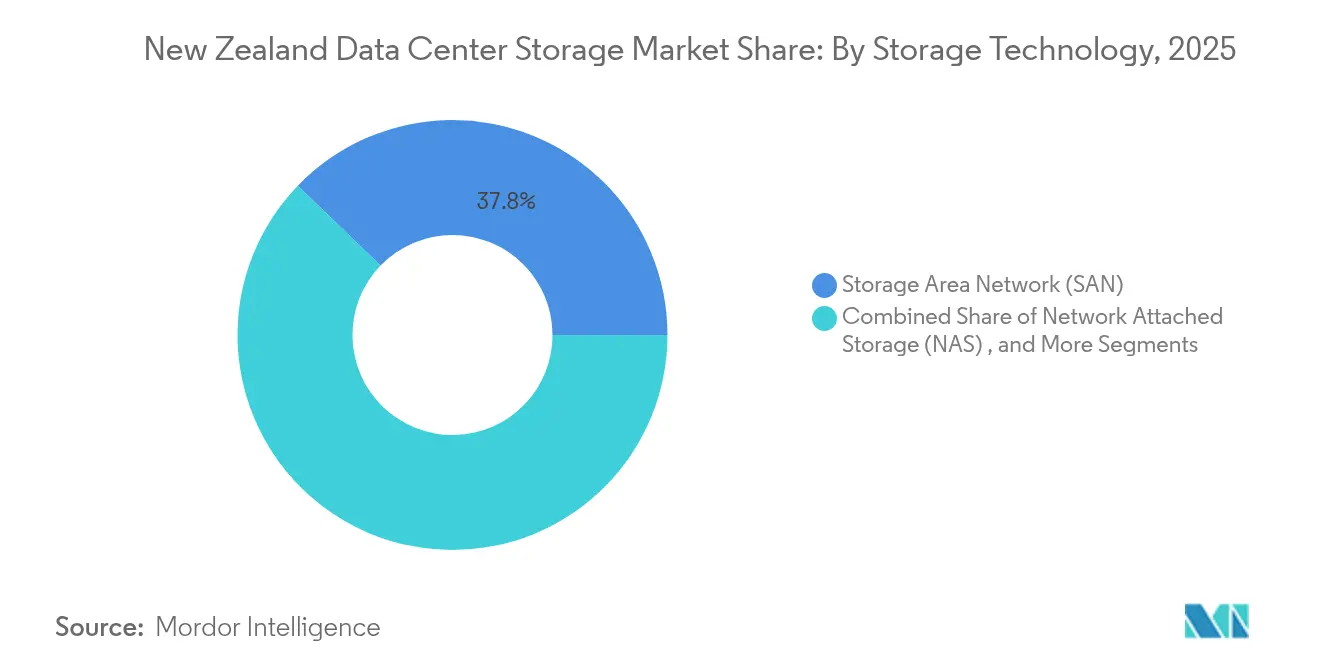
- By storage technology, Storage Area Networks led with 37.78% of New Zealand data center storage market share in 2025, while Network Attached Storage is projected to expand at a 16.15% CAGR through 2031.
- By storage type, traditional HDD arrays accounted for 44.78% share of the New Zealand data center storage market size in 2025, whereas all-flash arrays are on track for a 15.28% CAGR to 2031.
- By data center type, colocation facilities captured 54.32% revenue share in 2025; hyperscalers and cloud service providers exhibit the fastest growth outlook at 17.55% CAGR through 2031.
- By end user, IT and telecommunications controlled 28.95% of the New Zealand data center storage market size in 2025, with banking, financial services and insurance forecast to climb at 15.22% CAGR to 2031.
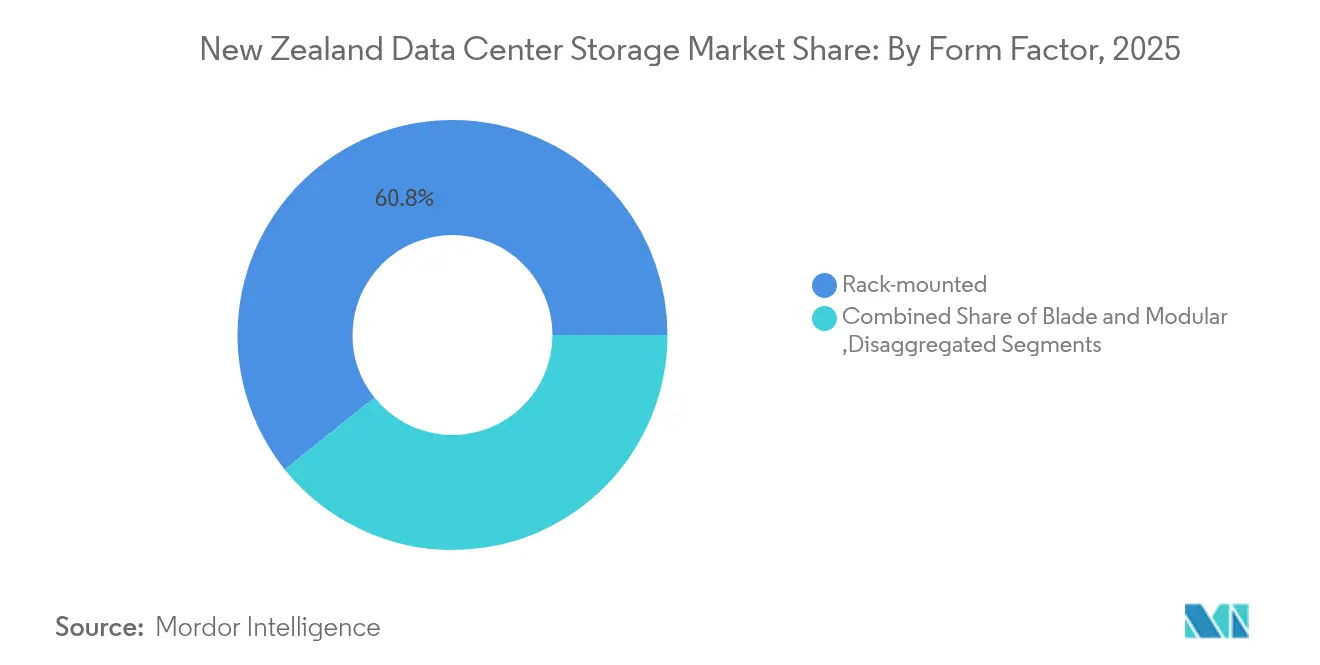
- By form factor, rack-mounted systems dominated at 60.75% share in 2025, while disaggregated and composable platforms are advancing at an 17.92% CAGR.
- By interface, SAS/SATA retained 52.88% share in 2025; NVMe leads growth with a 17.18% CAGR through 2031.
Note: Market size and forecast figures in this report are generated using Mordor Intelligence’s proprietary estimation framework, updated with the latest available data and insights as of 2026.
New Zealand Data Center Storage Market Trends and Insights
Drivers Impact Analysis*
| Driver | (~) % Impact on CAGR Forecast | Geographic Relevance | Impact Timeline |
|---|---|---|---|
| Expansion of cloud and hyperscale investments | +3.2% | National, concentrated in Auckland and Wellington | Medium term (2-4 years) |
| Government digital-sovereignty push | +2.8% | National, with emphasis on government and public sector | Long term (≥ 4 years) |
| AI/ML workload adoption | +2.1% | National, strongest in IT and telecommunications sectors | Short term (≤ 2 years) |
| Disaster-recovery demand in seismic zone | +1.9% | National, particularly South Island facilities | Long term (≥ 4 years) |
| New subsea-cable capacity repatriating data | +1.5% | National, with primary impact on Auckland connectivity | Medium term (2-4 years) |
| Renewable-energy "green storage" incentives | +1.0% | National, strongest in South Island hydro regions | Long term (≥ 4 years) |
| Source: Mordor Intelligence | |||
Expansion of Cloud and Hyperscale Investments
Amazon Web Services’ three-zone Auckland region requires synchronous replication across sites, forcing buyers to adopt storage with sub-millisecond write latency and automated failover. Datagrid’s USD 1,000 million Southland build uses 100% hydro power, positioning the South Island as a green storage hub that can serve trans-Tasman workloads while meeting carbon targets.[1]Amazon Web Services, “AWS to Launch an Infrastructure Region in New Zealand,” aws.amazon.com Rising hyperscale density lifts overall utilisation rates at colocation providers, prompting them to upgrade from HDD-centric racks to NVMe-rich, composable architectures that align with cloud native network fabrics. Vendors able to pre-validate arrays for hyperscale ecosystems are capturing early design-win pipelines, a trend that is expected to lock in long-term replacement cycles across the New Zealand data center storage market.
Government Digital-Sovereignty Push
The 2025 Digital Strategy for Aotearoa explicitly requires sensitive datasets to remain on shore, turning data residency into a gating criterion for every large government procurement. Microsoft’s Māori data sovereignty accord compels providers to embed cultural governance controls such as granular logging of which tribe owns which data objects and where replicas reside. This environment encourages locally headquartered firms like Vocus to launch Storage-as-a-Service nodes that carry sovereign metadata classifiers. As a result, buyers now evaluate block and object platforms not just on input/output operations per second but on how well they expose location attestation APIs and programmable compliance hooks, giving rise to a new premium tier within the New Zealand data center storage market.
AI/ML Workload Adoption
Dell confirms that AI-tuned storage cuts project deployment windows by 86%, driving media houses such as Kennedy Miller Mitchell to ingest 20 PB of pre-visualisation data on PowerScale NAS clusters. Pure Storage’s GenAI Pod pairs FlashBlade//S arrays with NVIDIA DGX stacks, delivering high-throughput data pipelines that feed large language models without buffering delays.[2]Pure Storage, “FlashBlade//S Achieves NVIDIA-Certified Storage Partner Status,” purestorage.com Demand for line-rate 100 Gbps NVMe-over-Fabric connectivity is forcing a shift away from legacy SAS shelf designs. This behaviour is most pronounced in the New Zealand data center storage market where small but data-hungry studios and research labs adopt cloud-adjacent colocation cages to rent GPU capacity yet insist on dedicated, low-latency flash volumes to maintain data governance.
Disaster-Recovery Demand in Seismic Zone
Operators in Wellington and Christchurch increasingly build twin-region topologies separated by at least 300 km, a distance judged sufficient to avoid correlated quake risk. Storage arrays are specified with triple-parity erasure coding and vibration-hardened chassis mounts, features once reserved for military deployments. University of Otago’s partnership with Datagrid places secondary research replicas in Southland hydropower facilities, combining seismic separation with renewable power savings.[3]University of Otago, “Partnership with Datagrid for Carbon Neutral Data Centre,” otago.ac.nz These design choices add cost yet create a competitive moat for providers that can certify end-to-end failover times under 30 seconds, a clear selling point for multinational tenants comparing regional disaster recovery options inside the New Zealand data center storage market.
Restraints Impact Analysis*
| Restraint | (~) % Impact on CAGR Forecast | Geographic Relevance | Impact Timeline |
|---|---|---|---|
| High CAPEX for all-flash arrays | -2.3% | National, particularly affecting SME adoption | Short term (≤ 2 years) |
| Talent shortage in storage engineering | -1.8% | National, most acute in Auckland and Wellington | Medium term (2-4 years) |
| Limited on-shore e-waste recycling | -1.2% | National, affecting sustainability initiatives | Long term (≥ 4 years) |
| Earthquake-proofing construction costs | -0.9% | National, with higher impact in high-risk zones | Long term (≥ 4 years) |
| Source: Mordor Intelligence | |||
High CAPEX for All-Flash Arrays
All-flash gear still carries a 3-4× acquisition premium over large-capacity HDD trays, placing strain on local SMEs that account for 97% of registered businesses. Shipping surcharges add 8-10% per chassis because every unit must cross the Tasman. Pure Storage’s Evergreen//One subscription smooths budget peaks by shifting spend to operating expenditure, yet public agencies tethered to annual CapEx cycles remain cautious. The disconnect slows flash penetration outside top-tier enterprises and tempers immediate growth in segments of the New Zealand data center storage market that rely on shorter payback thresholds.
Talent Shortage in Storage Engineering
Closed borders during 2020-2022 left an enduring gap in senior storage architects. Wage premiums of 30-40% above 2019 levels are common for NVMe-over-Fabric skills, delaying complex migrations. Training pipelines lag because tertiary curricula still emphasize generic networking rather than modern data-centric design. Vendors respond by bundling managed services with hardware, yet that raises operating cost for buyers already grappling with slim margins. Without targeted immigration or retraining initiatives, the New Zealand data center storage market risks project bottlenecks that curb its full growth potential.
*Our forecasts treat driver/restraint impacts as directional, not additive. The impact forecasts reflect baseline growth, mix effects, and variable interactions.
Segment Analysis
By Storage Technology: SAN Dominance Faces NAS Disruption
Storage Area Networks command 37.78% market share in 2025 on the strength of mission-critical database and ERP deployments that value deterministic block latency. This share anchors the New Zealand data center storage market because large banks and telcos refresh SANs on predictable five-year cycles, locking in vendor incumbency. NAS, propelled by a 16.15% CAGR, gains ground through media, gaming, and AI pipelines that generate unstructured data at petabyte scale. Dell PowerScale’s scale-out file system, adopted for 20 PB film workflows, showcases how NAS delivers multi-user throughput without complex Fibre Channel fabrics.
The growth of containerisation blurs boundaries between block and file, leading integrators to deploy unified systems that expose both protocols behind a single management plane. Direct-attached arrays cling to specialist high-performance computing pockets where locality trumps sharing, while object platforms attract archiving workloads that must respect data sovereignty yet remain cost efficient over decades. The interplay among these modalities keeps the New Zealand data center storage market fluid, stimulating vendor investment in software-defined orchestration layers that can shift volumes dynamically across SAN, NAS, and object pools.


By Storage Type: Flash Revolution Accelerates
Traditional HDD arrays still hold 44.78% share in 2025 inside the New Zealand data center storage market size due to their unrivalled USD per terabyte economics. Even so, energy bills and AI latency targets are tilting opinion toward flash. All-flash arrays, scaling at 15.28% CAGR, benefit from Micron G9 QLC NAND that slashes cost per bit while sustaining high endurance. The University of Western Australia’s 6 PB FlashBlade cut power use 80% and serves as a cross-Tasman proof point for local universities evaluating similar upgrades.
Hybrid arrays deliver the best of both worlds by tiering cold blocks to HDD inside the same chassis, easing budget pressure. Tape vaults enjoy a renaissance for immutable ransomware protection and for long-form video archives tied to cultural heritage mandates. Sustainability goals layer further impetus to replace spinning rust with solid-state: each rack of flash can save up to 20 MWh annually, a statistic that resonates in a grid dominated by hydro and wind. Consequently, flash migration is poised to reshape asset refresh roadmaps across the New Zealand data center storage market.
By Data Center Type: Colocation Leadership Under Hyperscale Pressure
Colocation facilities hold 54.32% share today because they spread seismic retrofitting costs across multiple tenants and tap carbon-free energy certifiable under RE100. Spark’s twelve sites blanket both islands, enabling federated storage clusters that conform to regional latency and sovereignty stipulations. At the same time, hyperscalers race forward at a 17.55% CAGR, adding megawatt blocks every quarter and dictating design paradigms such as liquid cooling and composable disaggregation.
Enterprise and edge footprints persist for latency-sensitive workloads—think electronic trading or telemedicine—that cannot tolerate extra hops to Auckland. Edge cages as small as 50 kW now house micro-flash arrays serving IoT gateways in Rotorua forests or Dunedin campuses. This heterogeneous topology forces vendors to certify replication workflows spanning a 1U edge node and a 25 MW hyperscale hall, a complexity unique to the New Zealand data center storage market where population dispersion meets advanced connectivity.
By End User: IT Sector Leads, BFSI Accelerates
IT and telecom operators represent 28.95% spending in 2025, reinforcing their role as early adopters that trial NVMe fabrics before cascading designs to other verticals. Telcos integrating 5G edge clouds ingest petabytes of packet captures and subscriber analytics daily, thus influencing storage performance thresholds market-wide. The BFSI community, advancing at 15.22% CAGR, modernises core banking stacks with containerised microservices that hammer storage back-ends with random reads, making low-latency flash a prerequisite.
Public agencies run legacy mainframes alongside new digital identity services, pushing integrators to deliver hybrid tiers that respect both sovereignty and budget. Healthcare’s imaging boom drives exabyte-scale archives requiring object or tape for economical retention, while manufacturing’s Industry 4.0 pilots capture sensor data that migrate directly to cloud-adjacent S3 buckets. Collectively, these adoption patterns diversify procurement models and broaden the revenue base of the New Zealand data center storage industry.
By Form Factor: Rack-Mounted Stability, Composable Innovation
Rack-mounted appliances secure 60.75% share because they slide into standard 42U frames without rigging changes. Facility managers like them for predictable airflow and serviceability. Yet composable trays, growing 17.92% CAGR, decouple compute and storage over a pooled PCIe fabric, allowing dynamic assignment of flash modules to whichever node hits peak load. Dell’s PowerFlex and HPE’s Alletra MP adopt this model, previewing how fluid resources will underpin the next generation of the New Zealand data center storage market.
Blade and modular designs maintain relevance in space-restricted sites such as submarine cable landing stations. Edge deployments see rugged micro-clusters mounted on wall brackets inside utility huts, exposing APIs identical to hyperscale peers so developers can orchestrate from a single control plane. As carbon budgeting tightens, form factor choices increasingly revolve around watt per terabyte metrics, further propelling innovators that deliver denser, cooler architectures.
By Interface: SAS/SATA Incumbency Meets NVMe Momentum
SAS/SATA retains a 52.88% share thanks to massive installed bases and mature supply chains. Firmware familiarity and hot-swap predictability make them the default for capacity tiers. NVMe, however, captures the imagination with 17.18% CAGR as PCIe 5.0 drives from KIOXIA pump 14 GB/s sequential throughput and double-digit million IOPS. Data centres adopt NVMe-over-TCP to extend these gains across Ethernet, avoiding forklift Fibre Channel refreshes.
Fibre Channel persists in regulated banks that value deterministic zoning, while iSCSI fills cost-sensitive SME racks. AI clusters often run dual-protocol back-ends, booting models off NVMe and cascading checkpoints to SATA SSD or even HDD once training concludes. This tiered strategy underscores the architectural hybridity that will characterise procurement over the next five years in the New Zealand data center storage market.
Geography Analysis
Auckland remains the epicentre, hosting Amazon and Microsoft regions that attract adjacent colocation expansions and supplier ecosystems. Proximity to Southern Cross NEXT and Hawaiki submarine cables yields sub-30 ms latency to Sydney, a decisive factor for SaaS vendors backhauling traffic across the Tasman. The city’s dense cloud edge nodes stimulate real-time analytics and multiplayer gaming workloads, which in turn raise per-rack flash density benchmarks within the New Zealand data center storage market.
Wellington leverages its government cluster to mandate sovereign hosting of public sector databases. Catalyst Cloud opens zones with built-in cultural governance so agencies can anchor confidential records locally while still using Kubernetes orchestration. The capital’s seismic profile accelerates dual-city mirroring to either Palmerston North or Lower Hutt, embedding multi-site replication in every tender spec.
South Island sites from Invercargill to Central Otago court hyperscale projects by touting surplus hydro and cool ambient air. Datagrid’s 60 MW first phase taps Manapouri hydro to deliver near-zero carbon intensity, drawing interest from trans-Pacific firms seeking green credentials. Spark invests USD 10 million in Waikato micro-data-centres that place flash arrays inside modular steel pods to shorten content-delivery latency for rural users. This geographically balanced footprint helps insurers and banks comply with business-continuity rules while sustaining performance targets, broadening the resilience narrative across the New Zealand data center storage market.
Competitive Landscape
The vendor field is moderately fragmented; the top five suppliers—Dell Technologies, HPE, Pure Storage, NetApp, and Hitachi Vantara—collectively control under 55% of revenue, leaving ample headroom for niche innovators. Dell rides a channel-centric approach, posting 20% PowerStore revenue growth after giving partners first rights on every deal above 100 TB. Pure Storage enlarges its beachhead by embedding NVIDIA AI Data Platform hooks into FlashBlade, effectively bundling compute and storage value while staying carbon light.
Local telco Spark couples managed storage with its fibre backbone, pitching sovereign compliance and single invoice convenience to mid-market enterprises. Kordia targets broadcast media with low-latency arrays inside its DOCSIS network shelters, a differentiator where millisecond jitter can ruin live sports streams. Such domain-specific strategies sustain price premiums even as hyperscalers commoditise raw capacity purchases inside the New Zealand data center storage market.
Alliance building accelerates. Nutanix aligns with Dell to bundle hyperconverged nodes on PowerEdge hardware while offering optional Pure Storage block back-ends, creating mix-and-match pathways that appeal to cautious CIOs. Western Digital, Micron, and KIOXIA court OEM deals to slip their Gen5 SSD portfolios into branded arrays, securing footholds without owning end-customer relationships. Competitive intensity thus pivots on ecosystem orchestration rather than one-off hardware margins.
New Zealand Data Center Storage Industry Leaders
Dell Technologies Inc.
Hewlett Packard Enterprise Company
NetApp Inc.
IBM Corporation
Huawei Technologies Co., Ltd.
- *Disclaimer: Major Players sorted in no particular order

Recent Industry Developments
- May 2025: Pure Storage integrated the NVIDIA AI Data Platform into FlashBlade, attaining NVIDIA-Certified Storage Partner status and removing dataset bottlenecks for AI factory rollouts.
- May 2025: Dell Technologies debuted PowerEdge XE9780/XE9785 servers with 192 NVIDIA Blackwell Ultra GPUs, coupled with managed AI data services for 24/7 support
- March 2025: Dell expanded its AI Factory collaboration with NVIDIA, introducing Pro Max AI PCs and new PowerEdge nodes optimised for GPU resource pooling
- February 2025: Dell released its 2025 Partner Programme, adding Storage+ rebates and AI Networking Multipliers to spur channel AI deployments
- February 2025: NetApp accelerated its all-flash SAN A-Series roadmap, promising higher density and inline ransomware detection.
- January 2025: Pure Storage and Micron scaled their joint roadmap around G9 QLC NAND to boost density for hyperscale builds.


Research Methodology Framework and Report Scope
Market Definitions and Key Coverage
Our study defines the New Zealand data-center storage market as all value generated inside the country from purpose-built hardware, software, and associated services that write, read, replicate, protect, and archive data within colocation, hyperscale cloud, enterprise, edge, and government data-center facilities. Solutions procured for on-premise server rooms, laptop drives, and consumer NAS devices lie outside this boundary.
Scope Exclusion: Backup tapes shipped offshore for cold storage are excluded to avoid double counting.
Segmentation Overview
- By Storage Technology
- Network Attached Storage (NAS)
- Storage Area Network (SAN)
- Direct Attached Storage (DAS)
- Object and Tape Storage
- By Storage Type
- Traditional HDD Arrays
- All-Flash Arrays (AFA)
- Hybrid Storage
- By Data Center Type
- Colocation Facilities
- Hyperscalers/Cloud Service Providers
- Enterprise and Edge
- By End User
- IT and Telecommunication
- BFSI
- Government and Public Sector
- Media and Entertainment
- Healthcare and Life Sciences
- Manufacturing
- By Form Factor
- Rack-mounted
- Blade and Modular
- Disaggregated / Composable
- By Interface
- SAS / SATA
- NVMe
- Fibre Channel and iSCSI
Detailed Research Methodology and Data Validation
Primary Research
We held structured calls with facility operators, cloud architects, storage-as-a-service start-ups, government CIOs, and regional channel distributors across Auckland, Wellington, and Christchurch. These interviews verified procurement cycles, negotiated average selling prices, adoption of all-flash arrays, and forthcoming AI workload footprints that secondary sources only hinted at.
Desk Research
We began with national statistics from Stats NZ, MBIE's Digital Economy Dashboard, the Electricity Authority's capacity datasets, and customs-level import codes for storage subsystems accessed via the UN Comtrade portal. Industry position papers from NZTech and DLA Piper helped us size planned hyperscale builds and understand local data-sovereignty triggers. Company 10-Ks, investor decks, and press releases supplied capex run-rates, while patent trends from Questel flagged the pace of NVMe and composable storage innovation.
A second pass pulled power-usage effectiveness ranges, rack counts, and ICT budget lines from publicly filed resource-consent documents and cabinet papers, with news retrieval through Dow Jones Factiva. D&B Hoovers gave us revenue splits for leading OEMs. The sources cited here illustrate the mix; many other public and paid references were tapped during validation.
Market-Sizing & Forecasting
Our top-down model starts with installed IT load (MW) and floorspace, converts those metrics into deployed raw-storage petabytes using empirically observed TB-per-MW ratios, and then multiplies by blended $/TB values derived from recent contracts before being further filtered through utilization and duplication factors. Bottom-up checks, supplier shipment roll-ups and sample ASP × volume estimates, calibrate each step. Key variables include hyperscale capex commitments, annual flash-price indices, rack density trends, government cloud-first mandates, and seismic-risk disaster-recovery spending. Multivariate regression with scenario analysis projects these drivers through 2030, while gaps in shipment data are bridged with channel-partner survey ranges agreed during expert calls.
Data Validation & Update Cycle
Outputs pass three analyst reviews, variance checks against publicly reported capacity, and a peer comparison. We refresh every twelve months and trigger mid-cycle updates when large green-field sites, significant price swings, or policy shifts occur.
Why Mordor's New Zealand Data Center Storage Baseline Deserves Confidence
Published estimates often diverge; numbers shift with scope choices, currency dates, and refresh cadence.
Key gap drivers we observe include whether external firms fold server-attached drives into storage spend, apply global ASP curves without local channel discounts, or extrapolate five-year forecasts from a single hyperscale announcement rather than recurring build data. Our model, anchored to verified MW capacity and cross-checked with bottom-up shipments, reduces those distortions.
Benchmark comparison
| Market Size | Anonymized source | Primary gap driver |
|---|---|---|
| USD 230 million (2025) | Mordor Intelligence | |
| USD 203 million (2024) | Global Consultancy A | excludes edge deployments, uses broader Oceania ASP benchmark |
| USD 200 million (2025) | Industry Journal B | assumes constant HDD share and omits currency re-baselining |
Taken together, the comparison shows that when scope, local price reality, and annual refresh discipline align, as they do in Mordor's approach, decision-makers gain a transparent, repeatable baseline they can trust for strategic planning.


Key Questions Answered in the Report
What is the current value of the New Zealand data center storage market?
The market is valued at USD 259.85 million in 2026 and is forecast to reach USD 478.33 million by 2031 at a 12.98% CAGR.
Which storage technology holds the largest share?
Storage Area Networks lead with 37.78% share in 2025 due to mission-critical database and ERP workloads.
Why are all-flash arrays gaining momentum?
All-flash arrays are advancing at a 15.28% CAGR because AI and real-time analytics need low-latency throughput, and flash also lowers power use by up to 80%.
How does seismic risk influence storage design in New Zealand?
Providers build twin-region architectures and specify vibration-hardened arrays so that data remains available even during major earthquakes.
Which end-user sector is growing fastest?
Banking, financial services, and insurance show the highest growth potential at 15.22% CAGR thanks to digital transformation and compliance demands.
What role do hyperscalers play?
Amazon Web Services and Microsoft have triggered a hyperscale investment wave that elevates overall storage performance standards and stimulates colocation expansions across the country.
Page last updated on:


