Singapore Data Center Storage Market Size and Share
Market Overview
| Study Period | 2020 - 2031 |
|---|---|
| Forecast Data Period | 2026 - 2031 |
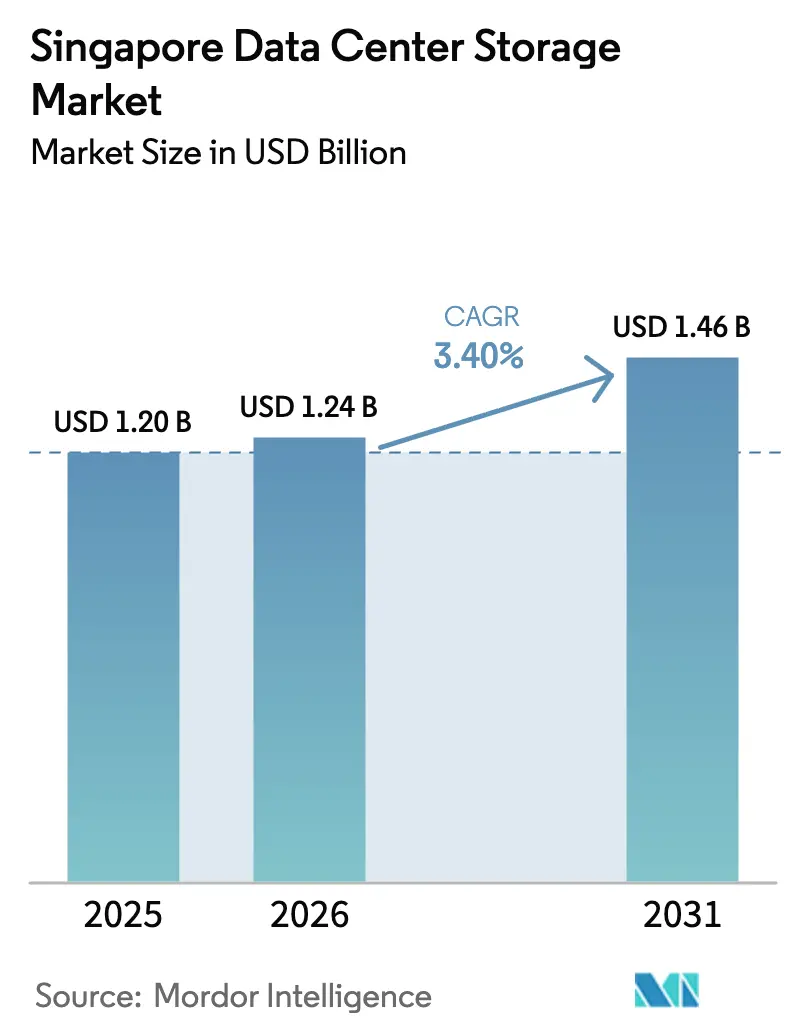
| Base Year Market Size (2025) | USD 1.20 Billion |
| Market Size (2026) | USD 1.24 Billion |
| Market Size (2031) | USD 1.46 Billion |
| Growth Rate (2026 - 2031) | 3.40% CAGR |
| Market Concentration | Medium |
Major Players *Disclaimer: Major Players sorted in no particular order Image © Mordor Intelligence. Reuse requires attribution under CC BY 4.0. | |
Singapore Data Center Storage Market Analysis by Mordor Intelligence
Singapore data center storage market size in 2026 is estimated at USD 1.24 billion, growing from 2025 value of USD 1.20 billion with 2031 projections showing USD 1.46 billion, growing at 3.40% CAGR over 2026-2031. The measured pace stems from a policy shift that rewards energy-efficient capacity rather than sheer floor space, tying new power allocations to strict sustainability metrics [1]Economic Development Board, “Singapore to Expand Data Centre Capacity by At Least One-Third,” edb.gov.sg. Heightened AI adoption is accelerating demand for low-latency flash arrays, while recent data-sovereignty rules push enterprises toward storage architectures with granular governance controls. [2]Personal Data Protection Commission, “Advisory Guidelines on Use of Personal Data in AI Recommendation and Decision Systems,” pdpc.gov.sg Cross-border expansion into the Johor-Singapore Special Economic Zone eases land constraints yet adds complexity in compliance and operations. Meanwhile, the rising carbon tax, set to hit SGD 50-80 per tonne by 2030, is fast-tracking the move from HDD to all-flash storage that can cut power draw by as much as 85%
Key Report Takeaways
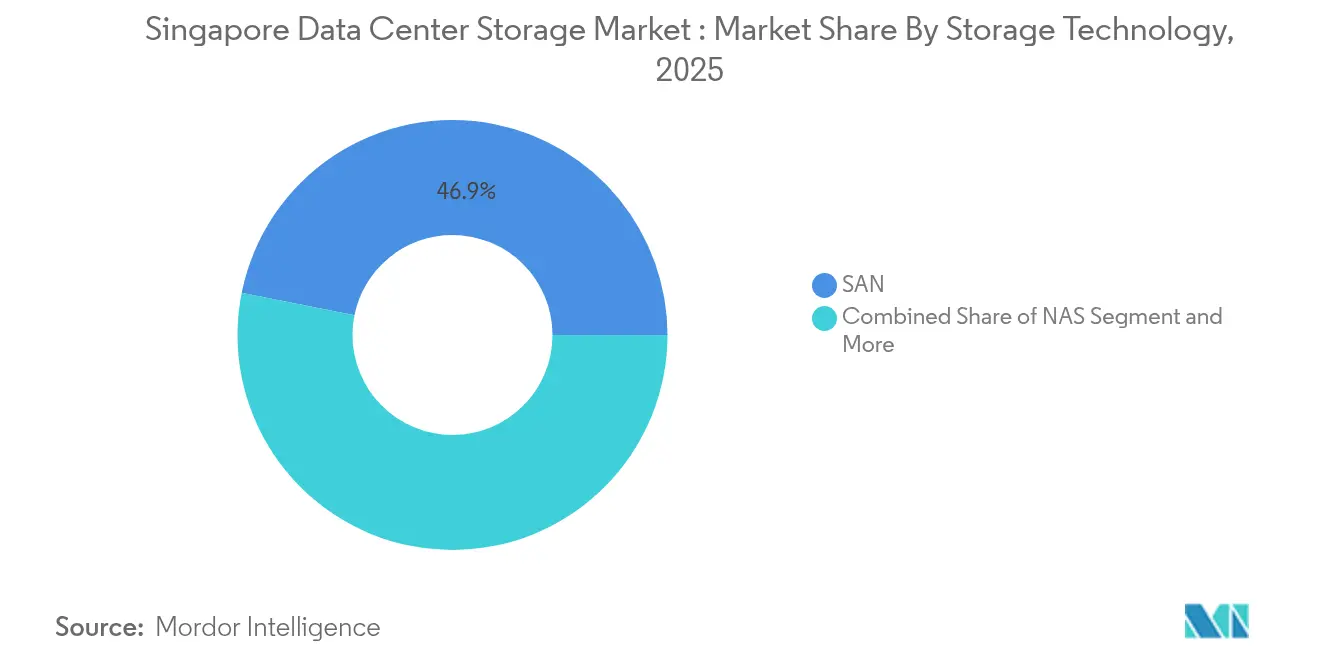
- By storage technology, the SAN segment held 46.85% of the Singapore data center storage market share in 2025, while NAS is projected to expand at a 5.12% CAGR to 2031.
- By storage type, traditional HDD arrays accounted for 39.55% share of the Singapore data center storage market size in 2025 and all-flash arrays are advancing at a 6.54% CAGR through 2031.
- By data-center type, hyperscalers and cloud service providers led with 62.95% revenue share in 2025; the segment records the highest forecast CAGR at 8.05% to 2031.
- By end user, IT & telecommunications captured 38.76% share of the Singapore data center storage market size in 2025, while healthcare and life sciences show the fastest growth at 6.18% CAGR through 2031.
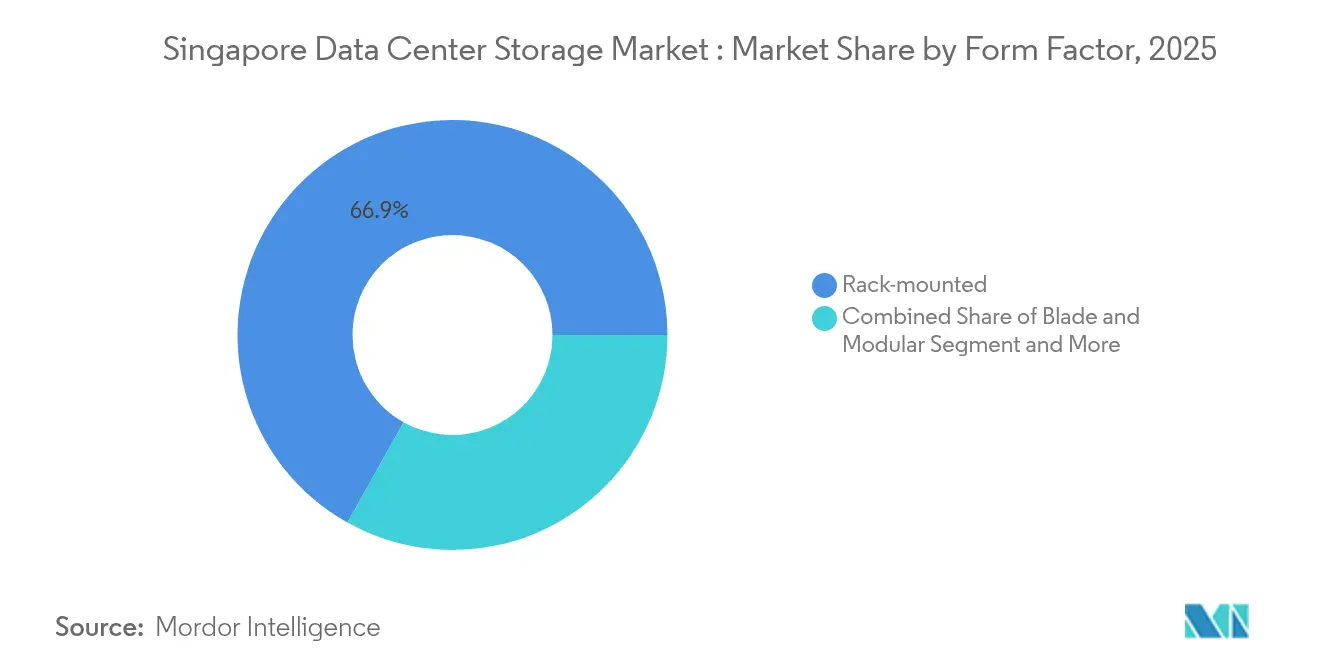
- By form factor, rack-mounted systems commanded 66.88% of the Singapore data center storage market share in 2025; blade and modular systems are set to grow at 5.08% CAGR between 2026 and 2031.
- By interface, SAS/SATA retained 51.60% share in 2025, whereas NVMe is forecast to grow at 8.88% CAGR to 2031.
Note: Market size and forecast figures in this report are generated using Mordor Intelligence’s proprietary estimation framework, updated with the latest available data and insights as of 2026.
Singapore Data Center Storage Market Trends and Insights
Drivers Impact Analysis*
| Driver | (+) % Impact on CAGR Forecast | Geographic Relevance | Impact Timeline |
|---|---|---|---|
| Green DC power allocation unlocks flash-storage capex | +0.7% | Singapore, spillover to Johor | Medium term (2-4 years) |
| AI build-outs demand ultra-low-latency NVMe arrays | +0.5% | Global, focus on Singapore | Short term (≤ 2 years) |
| Data-sovereignty rules under PDPA | +0.4% | Singapore | Medium term (2-4 years) |
| Expansion of cloud on-ramps | +0.6% | Singapore, Southeast Asia | Medium term (2-4 years) |
| Hyperscale investment pipeline | +0.4% | Singapore | Short term (≤ 2 years) |
| Johor-Singapore SEZ modular pods | +0.4% | Border region | Long term (≥ 4 years) |
| Source: Mordor Intelligence | |||
Government “Green DC” Power-Allocation Drives Flash Storage Adoption
Singapore earmarked 300 MW of new capacity, with 200 MW ring-fenced for operators using renewable energy, nudging buyers toward low-power all-flash arrays that fit within a strict 1.3 PUE threshold. Operators report up to an 85% power reduction versus HDD and significantly smaller rack footprints. A recent ministry refresh trimmed floor area by 94% after deploying Pure Storage systems, underscoring how policy catalyzes technology. The same policy grants early adopters preferential power allocation, creating a competitive edge that accelerates flash demand across the Singapore data center storage market.
AI Workloads Demand NVMe Performance Capabilities
Generative-AI models strain classical storage designs; NVMe’s parallel queues eliminate latency bottlenecks vital for high-volume GPU clusters. Kioxia’s 122.88 TB enterprise SSD and Micron’s 6500 ION series each raise throughput while curbing rack power use. These performance gains shorten AI training cycles, prompting cloud providers to specify NVMe as a standard for new capacity in the Singapore data center storage market.
Data Sovereignty Rules Reshape Storage Architectures
March 2024 amendments to the PDPA lay out explicit pathways—consent, business improvement, research, and anonymization—for AI use of personal data. Enterprises now invest in multi-tier encryption, audit trails, and region-pinning features that prove compliance in audits. Google Cloud’s MTCS-certified regions and similar offerings illustrate how sovereign controls now influence vendor selection in the Singapore data center storage market.
Expansion of IT Infrastructure and Cloud On-ramps
Fresh on-ramps from AWS, Microsoft, and Google extend low-latency connections across Southeast Asia, making Singapore the default hub for cross-border traffic. This traffic consolidation lifts demand for shared storage pools with dynamic scaling, deepening the value proposition of SAN and NAS systems with automated tiering.
Restraints Impact Analysis*
| Restraint | (≈) % Impact on CAGR Forecast | Geographic Relevance | Impact Timeline |
|---|---|---|---|
| High upfront capex of enterprise-grade storage | −0.8% | Singapore | Short term (≤ 2 years) |
| Land-and-power scarcity | −0.3% | Singapore | Long term (≥ 4 years) |
| SSD controller supply-chain volatility | −0.4% | Global, affects Singapore | Medium term (2-4 years) |
| Rising carbon-tax / ESG compliance costs | −0.3% | Singapore | Long term (≥ 4 years) |
| Source: Mordor Intelligence | |||
High Upfront Capex Creates Adoption Barriers
All-flash arrays still cost 2-3x more at purchase than HDD systems, straining budgets for mid-market firms Additional costs arise from power upgrades and cooling retrofits, extending payback periods. Storage-as-a-service models partly offset capex but can introduce sovereignty concerns for regulated workloads, tempering growth in the Singapore data center storage market.
Land and Power Constraints Persist Despite Policy Changes
Island land scarcity and premium real-estate prices cap large-footprint builds even after the moratorium lift. AI racks also require higher power density, pushing total demand beyond the 300 MW allocation. This constraint nudges operators toward Johor builds but adds cross-border governance overhead, moderating expansion of the Singapore data center storage market.
*Our forecasts treat driver/restraint impacts as directional, not additive. The impact forecasts reflect baseline growth, mix effects, and variable interactions.
Segment Analysis
By Storage Technology: SAN Retains Core Workloads
Storage Area Networks captured 46.85% share in 2025, reflecting their position as the performance backbone for financial and telco applications that demand low-latency block storage. NAS, scaling at 5.12% CAGR, is taking on collaborative workloads and edge ingestion use cases where flexible file protocols matter. The Singapore data center storage market continues to blend both technologies in hybrid estates that add object storage tiers for long-term archives. Vendor roadmaps increasingly offer unified management layers, allowing operators to shift datasets between SAN and NAS without downtime.
At the same time, disaggregated memory architectures outlined in US Patent US10917321B2 create an emerging option that separates compute from storage to optimize resource use patents.google.com. Early proofs suggest improved utilization rates that reduce stranded capacity, a compelling benefit as carbon-based cost pressures intensify across the Singapore data center storage market.


By Storage Type: Flash Gains at the Expense of HDD
Traditional HDD arrays still hold 39.55% share in 2025, yet all-flash arrays rise the fastest at 6.54% CAGR. The switch is driven by tangible performance gains—sub-millisecond latency and higher IOPS—that directly improve AI and analytics workloads. The Singapore data center storage market size for all-flash arrays is projected to reach USD xx million (undisclosed) by 2031, reflecting both falling media costs and rising energy prices that favor flash’s lower watt-per-IO profile.
Public-sector projects illustrate flash economics vividly: a ministerial deployment reduced rack space by 94% and cut energy bills in half. Flash density roadmaps that promise 150 TB and 300 TB drives by 2026 will only hasten HDD retirement, though hybrid systems remain in play for tier-2 workloads through the mid-term horizon of the Singapore data center storage market.
By Data Center Type: Hyperscalers Lead Build-Outs
Hyperscalers and cloud service providers controlled 62.95% of capacity in 2025 and are expanding at an 8.05% CAGR to 2031. Investments such as Equinix SG6 and Digital Realty’s upcoming campuses showcase purpose-built halls with liquid cooling and AI-optimized power trunks. Colocation operators cater to hybrid enterprise requirements, while edge micro-sites emerge around transport hubs to shave latency for real-time apps. The Singapore data center storage market benefits from the hyperscaler ecosystem by absorbing procurement volume, which drives down flash pricing for smaller buyers.
Edge and enterprise facilities still matter for data sovereignty. Banks and healthcare providers routinely split workloads across on-premises hardware and colocation racks to satisfy residency mandates, reinforcing a multi-tier structure that underpins the broader Singapore data center storage market.
By End User: Healthcare Accelerates Digital Uptake
IT and telecommunications held 38.76% revenue in 2025 on the back of 5G and SaaS growth. Healthcare and life sciences, the fastest mover at 6.18% CAGR, require high-throughput storage for imaging and genomics processing. Compliance-ready colocation sites like Iron Mountain SIN-1 attract hospitals that need audited environments . Government agencies continue to modernize infrastructure guided by the Green Data Centre Roadmap, often setting sustainability benchmarks later adopted by private firms participating in the Singapore data center storage market.
Media, entertainment, and manufacturing add further diversity with bursty content workloads and factory-floor analytics respectively. Vendors now position software-defined storage bundles tuned to vertical needs, a sign of maturing segmentation within the Singapore data center storage industry.
By Form Factor: Blades Pack More Terabytes per Rack
Rack systems own 66.88% share owing to their plug-and-play nature. Blades and modular designs, climbing at 5.08% CAGR, shrink overhead cabling and share power supplies, making them attractive where floor space is scarce. The Singapore data center storage market size for blade systems is projected to rise in tandem with liquid-cooling adoption that allows denser compute nodes per enclosure.
Composable architectures let operators spin up storage pools on demand, aligning with AI bursts without locking capital into static racks. As carbon taxation tightens, form factors that maximize watts-to-IO ratios gain preference across the Singapore data center storage market.
By Interface: NVMe Becomes the De-Facto Default
SAS/SATA still connect over half of installed drives, yet NVMe races ahead at 8.88% CAGR thanks to its direct PCIe pathway and rich parallelism. Micron’s 200-layer SSD line proves performance gains of 34% lower read latency, translating into faster model convergence for AI workloads. NVMe-over-Fabrics extends these benefits across Ethernet fabrics, cutting latency penalties associated with network hops.
Enterprises in the Singapore data center storage market increasingly specify NVMe for new deployments, planning phased migrations that retire SAS/SATA shelves as warranties expire. Fibre Channel retains a niche in mission-critical banking systems where deterministic throughput matters, preserving interface diversity through this forecast window.
Geography Analysis
Singapore hosts 87 active data centers with 1,026 MW of installed power, the largest cluster in Southeast Asia. A national roadmap adds 300 MW yet ties allocations to efficiency metrics, spurring innovations in liquid cooling and renewables, including Keppel’s hydrogen-powered floating data-center concept. These innovations ripple through the Singapore data center storage market by prioritizing low-power flash arrays and advanced management software able to throttle idle disks.
The Johor-Singapore Special Economic Zone supplements land and energy supply without diluting Singapore’s connectivity advantage. NTT DATA’s 290 MW Johor campus will feed Singapore workloads via mesh fiber routes, effectively expanding the Singapore data center storage market size beyond national borders. Tax incentives—5% corporate rate for strategic sectors—further encourage operators to adopt a dual-site topology where compliance-sensitive data resides in Singapore and overflow or test environments sit across the border.
Across Asia-Pacific, demand for AI-ready racks is outstripping supply by an estimated 15-25 GW through 2028. Malaysia expects 72% growth in its data-center sector by 2028 with MYR 17 billion in Johor investments. This regional surge positions Singapore as command center and compliance anchor for multinationals, sustaining throughput to the Singapore data center storage market even when some compute shifts overseas.
Competitive Landscape
Established vendors Dell Technologies, HPE, and NetApp maintain deep channel presence, yet flash-first specialists and cloud-native services are reshaping buyer preferences. Pure Storage, through its NCS alliance, won a landmark public-sector deal that cut floor space by 94% while boosting AI performance . That reference account spurred private-sector interest and intensified competition in the Singapore data center storage market.
Traditional players respond by expanding all-flash portfolios and embedding software layers that unify block, file, and object services. NetApp’s 2025 roadmap stresses data fabric capabilities that move datasets seamlessly between SAN, NAS, and public-cloud bucket. Cloud operators leverage in-house silicon and global scale, bundling storage with AI accelerators and managed services that sidestep on-premises capex.
White-space opportunities exist in disaggregated memory architectures and cross-border data-replication tools optimized for the Johor-Singapore corridor. Patent activity around compute-memory separation underscores a shift toward resource-pooling that aligns with sustainability objectives in the Singapore data center storage market.
Regulation acts as both hurdle and differentiator. The Digital Infrastructure Act designates data centers critical infrastructure, requiring advanced resilience layers, multi-site failover, and audited supply chains. Vendors able to embed encryption, automated recovery, and power-efficiency reporting at platform level win mindshare, tightening the link between compliance and product design.
Singapore Data Center Storage Industry Leaders
Dell Technologies
Hewlett Packard Enterprise
NetApp
Huawei Technologies
Pure Storage
- *Disclaimer: Major Players sorted in no particular order

Recent Industry Developments
- April 2025: Pure Storage and NCS modernized a Singapore ministry’s storage, cutting physical space by 94% and enhancing AI throughput
- April 2025: NTT DATA bought a 68.5-acre Johor Bahru site for a 290 MW campus, with first 48 MW live in 2027
- March 2025: Kioxia unveiled the LC9 Series 122.88 TB NVMe SSD targeting AI workloads
- February 2025: IMDA issued advisory guidelines for cloud and data-center resilience, emphasizing risk assessments and continuity planning


Research Methodology Framework and Report Scope
Market Definitions and Key Coverage
Our study treats the Singapore data center storage market as the sale of disk-based and solid-state storage subsystems, related firmware, and management software that are installed inside professionally run, carrier-grade data center facilities. The count covers racks deployed in hyperscale, colocation, enterprise, and edge sites that sit within Singapore's borders and serve local or regional workloads.
Scope exclusion: Backup appliances sitting in branch offices or disaster-recovery vaults outside a tiered data-center environment are not counted.
Segmentation Overview
- By Storage Technology
- Network Attached Storage (NAS)
- Storage Area Network (SAN)
- Direct Attached Storage (DAS)
- Object and Tape Storage
- By Storage Type
- Traditional HDD Arrays
- All-Flash Arrays (AFA)
- Hybrid Storage
- By Data Center Type
- Hyperscalers/Cloud Service Provider
- Colocation Facilities
- Enterprise and Edge
- By End User
- IT and Telecommunication
- BFSI
- Government and Public Sector
- Media and Entertainment
- Healthcare and Life Sciences
- Manufacturing
- By Form Factor
- Rack-mounted
- Blade and Modular
- Disaggregated / Composable
- By Interface
- SAS / SATA
- NVMe
- Fibre Channel and iSCSI
Detailed Research Methodology and Data Validation
Primary Research
We conducted structured discussions with facility operators, storage architects, channel distributors, and procurement leads across Jurong, Tai Seng, and Woodlands. Insights on utilization ratios, average selling prices, and NVMe adoption curves were collected and then cross-checked with regional system integrators to validate assumptions for growth beyond 2027.
Desk Research
Mordor analysts screened open datasets and publications from the Infocomm Media Development Authority, the Energy Market Authority's half-yearly electricity statistics, the Building and Construction Authority's Green Mark register, and customs shipment records shared by Singapore Customs. Trade association white papers from the Storage Networking Industry Association, peer-reviewed articles captured on Questel, and public company filings enriched the technical and financial inputs. Paid repositories such as D&B Hoovers and Dow Jones Factiva supplied verified revenue splits and shipment commentary. This list is illustrative; many additional public records and specialist databases informed the evidence base.
Market-Sizing & Forecasting
A top-down build anchored on IMDA published installed IT load was first mapped to average gigabytes per megawatt to reconstruct storage demand, which was subsequently reconciled with selective bottom-up checks such as sampled vendor invoices and channel sell-through data. Key variables like flash share, rack power density, Green DC power allocations, and carbon-tax escalation drive the annual capacity additions in our model. A multivariate regression, informed by primary consensus on flash price erosion and hyperscale capacity plans, generates the 2025-2030 trajectory. Gaps where channel data remained opaque were bridged using conservative penetration assumptions that were again validated through expert callbacks.
Data Validation & Update Cycle
Outputs flow through variance scans against historical power-draw benchmarks and customs import volumes. Senior reviewers challenge anomalies before sign-off. The dataset refreshes each year, and interim updates are triggered when policy shifts or large site announcements alter demand fundamentals. A last-mile review is completed just before report release.
Why Mordor's Singapore Data Center Storage Baseline proves dependable
Estimates for this niche often diverge because publishers pick dissimilar facility scopes, bundle on-premise gear, or apply aggressive flash price curves.
Key gap drivers include the tendency of some studies to fold enterprise server storage into data-center totals, to assume uniform rack densities, or to roll forward last year's numbers without factoring the IMDA-led cap on new power allotments. Mordor's page isolates in-facility hardware only, applies site-level PUE factors, and updates the model every twelve months, creating a steadier baseline.
Benchmark comparison
| Market Size | Anonymized source | Primary gap driver |
|---|---|---|
| USD 1.20 B (2025) | Mordor Intelligence | |
| USD 1.80 B (2024) | Regional Consultancy A | Includes office backup arrays and tape libraries sold to enterprises outside tiered data centers |
| USD 1.00 B (2024) | Industry Portal B | Tracks storage-as-a-service revenue yet omits hyperscale hardware purchases |
In summary, the contrasts show that Mordor's disciplined scope selection, variable transparency, and yearly refresh cadence deliver a balanced figure decision-makers can trust.


Key Questions Answered in the Report
What is the forecast growth rate for the Singapore data center storage market?
The market is projected to grow at a 3.40% CAGR from USD 1.24 billion in 2026 to USD 1.46 billion in 2031.
Which segment holds the largest share in the Singapore data center storage market?
Hyperscalers and cloud service providers lead with 62.95% revenue share in 2025, reflecting strong investment pipelines.
Why are all-flash arrays gaining momentum in Singapore?
Flash delivers lower latency and higher IOPS while consuming up to 85% less power than HDD, aligning with carbon-tax pressures and Green DC mandates.
How do new PDPA rules affect storage buying decisions?
Stricter data-sovereignty requirements drive adoption of architectures with encryption, audit trails, and regional data-residency controls.
Page last updated on:


