Augmented Reality Market Size and Share
Market Overview
| Study Period | 2019 - 2030 |
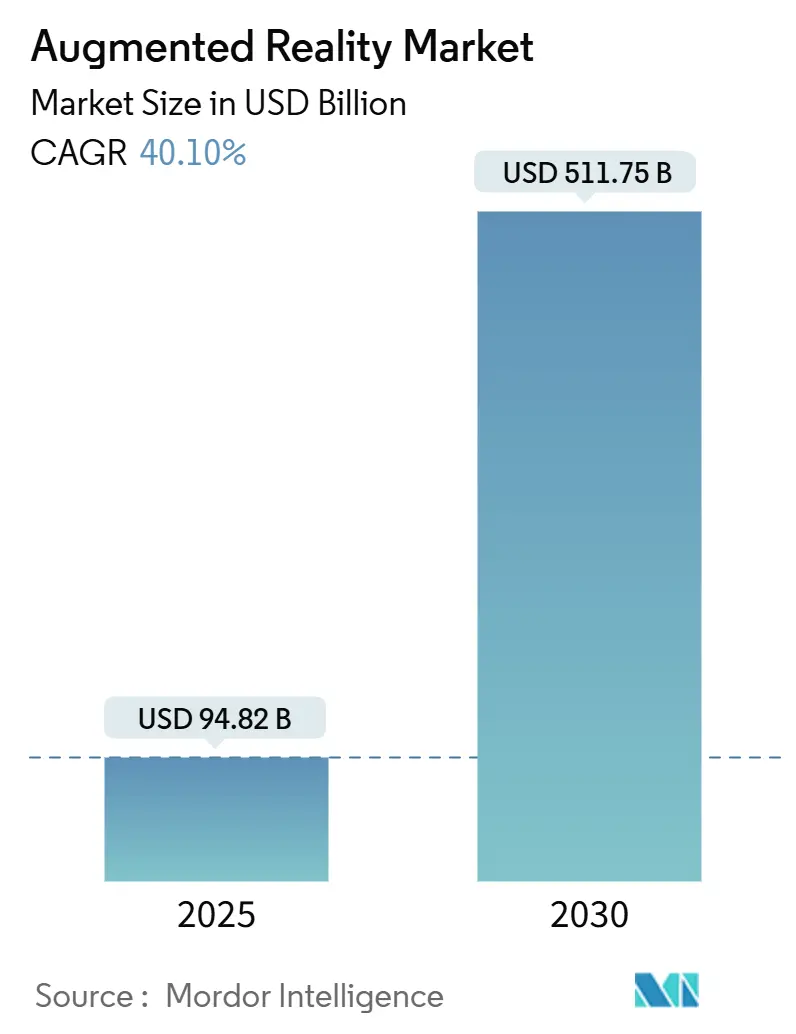
| Market Size (2025) | USD 94.82 Billion |
| Market Size (2030) | USD 511.75 Billion |
| Growth Rate (2025 - 2030) | 40.10% CAGR |
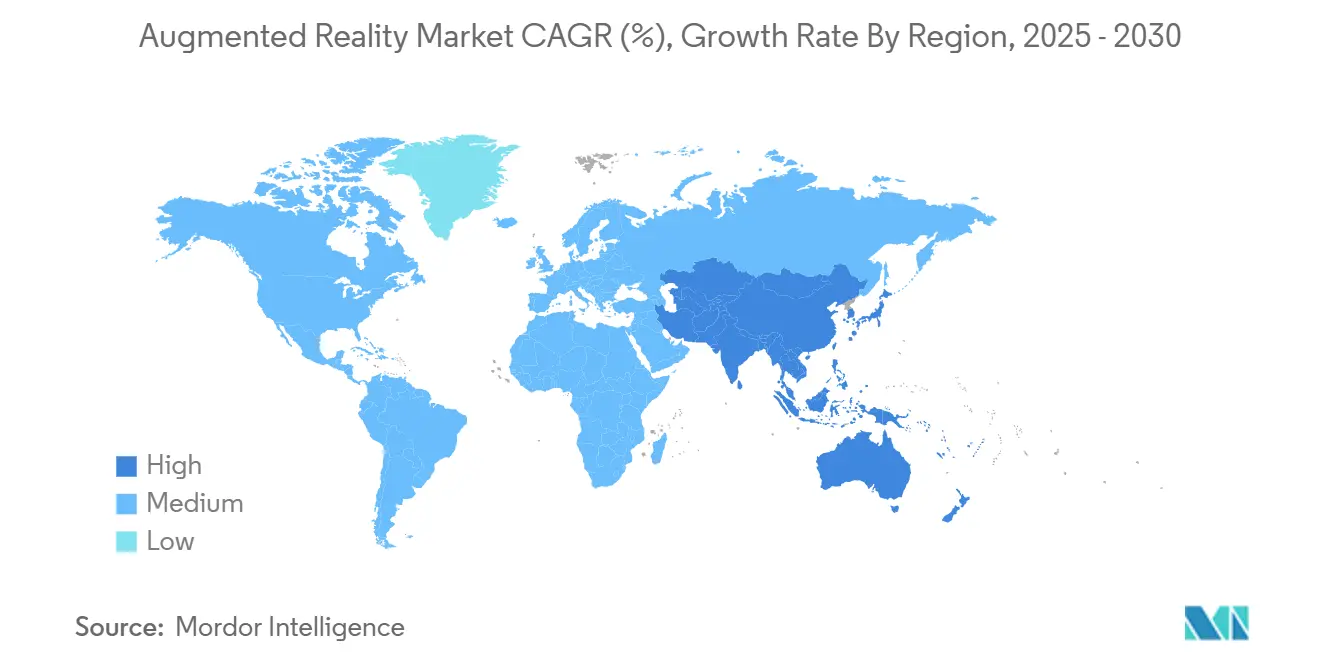
| Fastest Growing Market | Asia Pacific |
| Largest Market | North America |
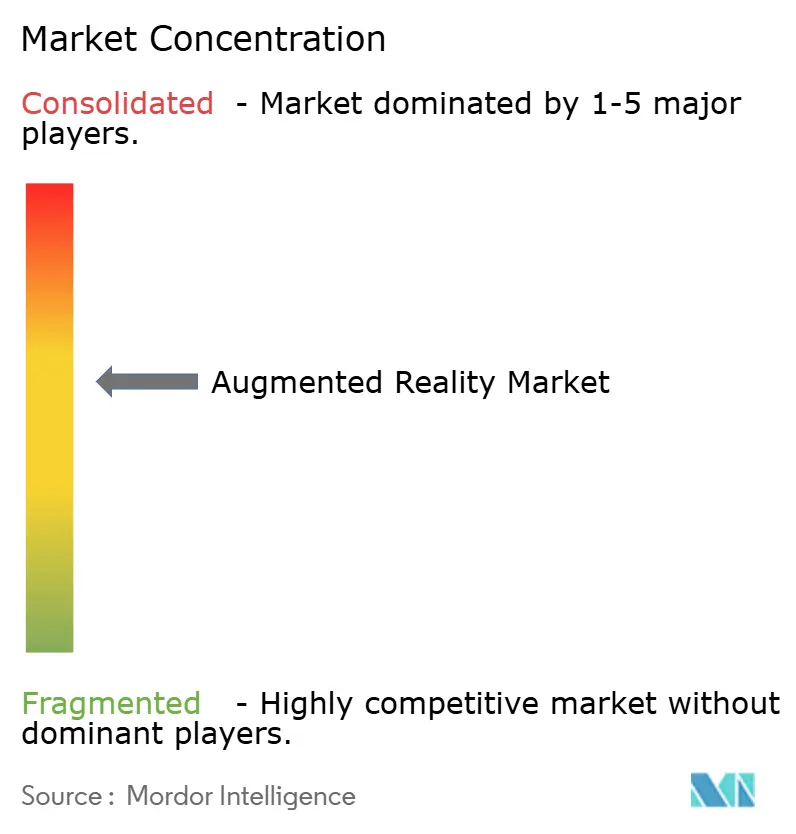
| Market Concentration | Medium |
Major Players*Disclaimer: Major Players sorted in no particular order Image © Mordor Intelligence. Reuse requires attribution under CC BY 4.0. |
|

Augmented Reality Market Analysis by Mordor Intelligence
The Augmented Reality market size reached USD 94.82 billion in 2025 and is projected to climb to USD 511.75 billion by 2030, reflecting a 40.1% CAGR. Demand accelerates as 5G networks remove latency barriers, sovereign AI policies push on-device inference, and Apple’s Vision Pro validates spatial-computing use cases. Enterprises in manufacturing, healthcare, and energy are standardizing digital-twin overlays to shorten decision cycles, while generative-AI tools shrink content-development time from months to days. Hardware innovation in waveguides and MicroLEDs continues, yet cloud-centric software platforms are growing even faster, enabling organizations to scale pilots across global plants without heavy infrastructure. Security-hardened AR stacks and edge-optimized rendering are becoming default requirements as companies move sensitive data off consumer smartphones and into managed industrial endpoints.
Key Report Takeaways
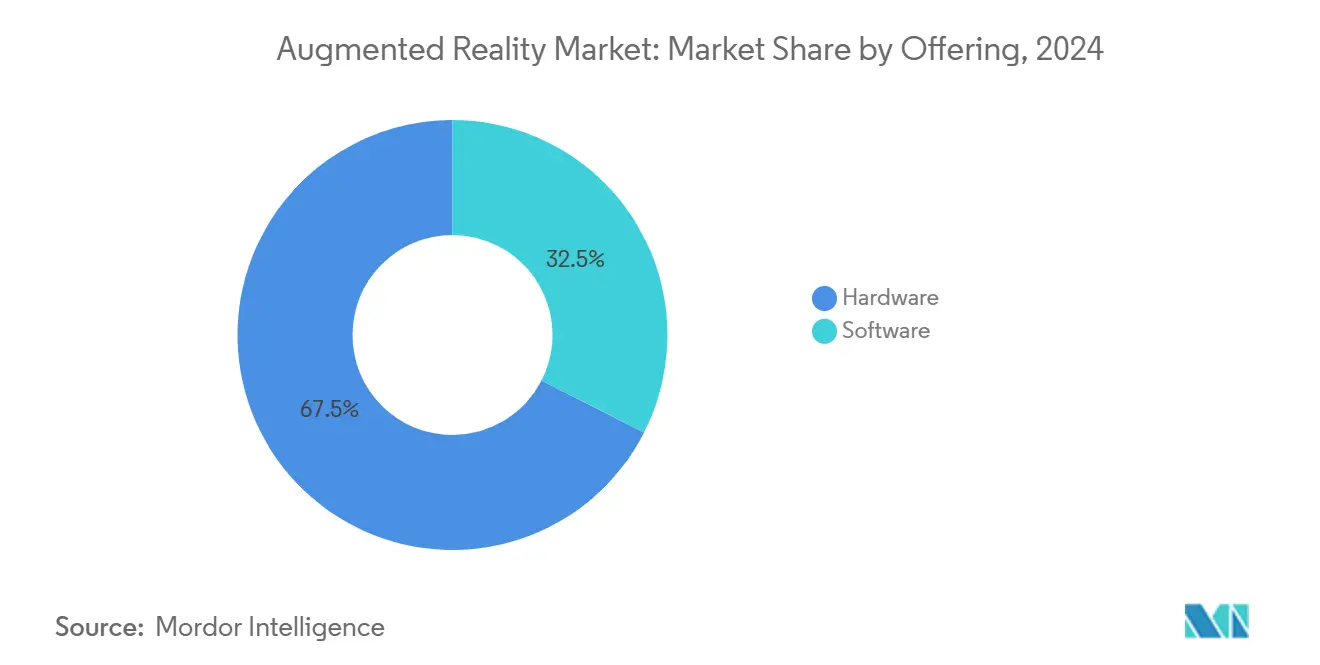
- By offering, hardware led with 67.5% of Augmented Reality market share in 2024, while software is forecast to expand at a 42.0% CAGR through 2030.
- By core technology, waveguide and diffractive optics held 51.3% revenue share in 2024; MicroLED is set to grow at 41.7% CAGR to 2030.
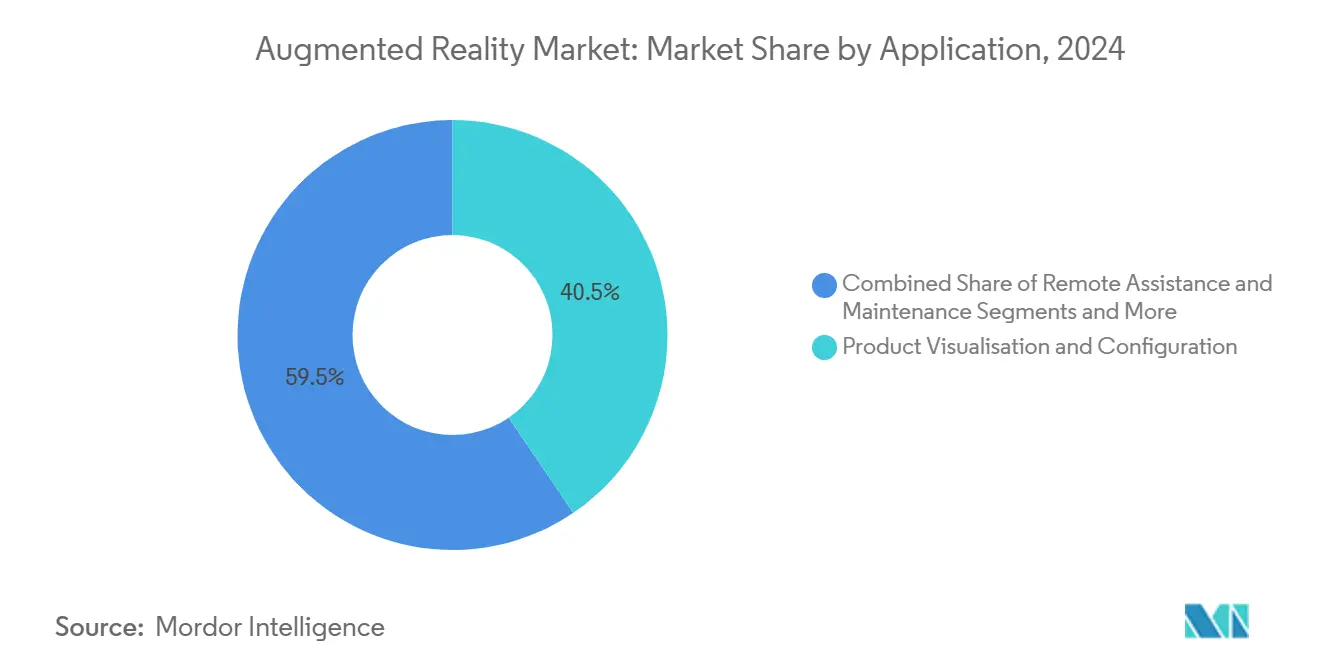
- By application, product visualization accounted for 40.5% of the Augmented Reality market size in 2024 and remote assistance is advancing at a 41.3% CAGR.
- By end-user vertical, gaming and entertainment commanded 32.4% share of the Augmented Reality market size in 2024, while healthcare is expanding at 40.5% CAGR.
- By geography, North America held 38.6% revenue share in 2024; Asia-Pacific is projected to rise at a 40.8% CAGR to 2030.
Global Augmented Reality Market Trends and Insights
Drivers Impact Analysis
| Driver | (~) % Impact on CAGR Forecast | Geographic Relevance | Impact Timeline |
|---|---|---|---|
| 5G-enabled low-latency mobile networks | +8.2% | Global, strongest in North America, China, South Korea | Medium term (2-4 years) |
| Rising smartphone penetration and AR-ready apps | +6.8% | Asia-Pacific core, spill-over to MEA and Latin America | Short term (≤ 2 years) |
| Enterprise training and field-service gains | +7.4% | North America & EU, expanding to APAC manufacturing hubs | Medium term (2-4 years) |
| Generative-AI tools for rapid content | +5.9% | Global, concentrated in tech innovation centers | Long term (≥ 4 years) |
| Industrial digital-twin overlays | +4.3% | Germany, Japan, China, US Midwest | Long term (≥ 4 years) |
| Apple Vision-Pro ecosystem push | +3.8% | North America, Western Europe, Japan | Short term (≤ 2 years) |
Source: Mordor Intelligence
5G-enabled Low-latency Mobile Networks
Sub-20 millisecond round-trip times now achievable on standalone 5G allow real-time positional updates for shared holograms. Ericsson reports higher AR session durations when devices connect through edge-computing slices that prioritize spatial data traffic[1]Ericsson AB, “Harnessing 5G for Immersive Realities,” ericsson.com. Manufacturing sites adopting private 5G—such as nuclear plants in the Czech Republic—have documented efficiency lifts and safety gains during guided inspections. Operators view the Augmented Reality market as a premium upsell that offsets shrinking voice revenues, prompting investment in network APIs that expose quality-of-service tiers to developers. Preparations for 6G, targeting terabit throughput, will enable lightweight glasses to stream volumetric video without tethering, reinforcing double-digit growth forecasts.
Rising Smartphone Penetration and AR-ready Apps
Asia-Pacific added 130 million mobile subscribers in 2024, bringing penetration to 51% and creating a fertile install base for AR commerce. Retail pilots from IKEA and L’Oréal show dwell-time gains exceeding 10 minutes when customers visualize products in real scale. Smartphone optics still struggle in indoor navigation, where Osaka University observed drift-induced motion sickness; research points to ultra-wideband anchors as a remedy. Nevertheless, the handset remains the on-ramp for many first-time AR users, nurturing developer ecosystems ahead of mass-market glasses.
Enterprise Training and Field-service Efficiency Gains
AR-guided workflows help manufacturers close skills gaps. Howden recorded 19% faster assemblies and Fujitsu saw 42% quicker installations after deploying step-by-step holographic instructions. A Forrester audit found HoloLens-based training trimmed downtime 23.5% and slashed paper manual costs by one-third. The U.S. Air Force validated zero-error outcomes for aircraft maintenance, underscoring mission-critical reliability. Productivity proof points like these turn pilot projects into multi-plant rollouts and feed sustained demand across the Augmented Reality market.
Generative-AI Tools for Rapid AR Content Creation
Low-code editors backed by diffusion models now draft complete 3D scenes from text prompts. Google Cloud’s alliance with Infinite Reality targets retail and sports brands that seek near-instant virtual merchandising. NYU researchers demonstrated foveated streaming that drops data loads sevenfold while maintaining fidelity, allowing richer assets on consumer bandwidths. In manufacturing, AI converts CAD drawings into annotated holograms, cutting authoring cycles by 60%. As toolkits mature, creative bottlenecks diminish and the Augmented Reality market scales beyond expert-only development teams.
Restraints Impact Analysis
| Restraint | (~) % Impact on CAGR Forecast | Geographic Relevance | Impact Timeline |
|---|---|---|---|
| Battery-life and ergonomics of HMDs | -4.7% | Global, most pronounced in consumer segments | Short term (≤ 2 years) |
| Privacy and data-security concerns | -3.2% | EU and California lead regulatory scrutiny | Medium term (2-4 years) |
| Optical-waveguide glass supply bottlenecks | -2.8% | Germany, Japan, Malaysia supply clusters | Medium term (2-4 years) |
| Fragmented developer standards | -2.1% | Higher impact in multivendor enterprise rollouts | Long term (≥ 4 years) |
Source: Mordor Intelligence
Battery-life and Ergonomics of Head-mounted Displays
Current devices weigh near 100 grams and seldom exceed two hours of operation. Apple’s Vision Pro highlights the trade-off: high micro-OLED brightness drains batteries quickly. University of Tokyo researchers propose off-board “beaming displays” to shift power draw away from the headset. Energy profiling of HoloLens 2 shows display brightness accounts for 62% of consumption, implying software dimming and scene-aware rendering can stretch sessions by one-fifth. Industrial users accept heavier gear for limited tasks, yet mass-consumer uptake hinges on true all-day wearables.
Privacy and Data-security Concerns
Headsets record surroundings continuously, triggering tough questions under California’s Consumer Privacy Act, which now mandates explicit notice for AR data harvesting. The EU’s GDPR fines have steered developers toward on-device inference to minimize cloud exposure. An FDA workshop cited privacy alongside cybersickness as top AR safety issues for surgical guidance systems. Transparent data-handling policies and secure hardware enclaves are becoming competitive differentiators.
Segment Analysis
By Offering: Hardware Dominates, Software Accelerates
Hardware captured 67.5% of Augmented Reality market revenue in 2024 on the strength of stand-alone and tethered head-mounted displays. Component vendors push waveguide efficiency and MicroLED brightness to extend battery life and enable outdoor use. Samsung’s LEDoS roadmap targets mass production before 2027, promising slimmer optics that suit both enterprise and lifestyle glasses. While hardware remains indispensable, cloud-first platforms now let firms pilot AR with existing mobile devices, lowering barriers for smaller factories and clinics. As a result, software is set to post a 42.0% CAGR and will narrow the revenue gap by 2030. Licensing strategies that let third-party OEMs preload mature operating systems mirror the PC ecosystem and accelerate application portability across devices.
Cloud orchestration tools embed generative-AI modules that auto-convert CAD assemblies into sequenced holographic instructions, trimming deployment time by two-thirds. Subscription pricing shifts investment from capital expenditure to operating budgets, aligning with enterprise digitization mandates. This blend of falling device costs and rising platform sophistication underpins sustained expansion across the Augmented Reality market.
Note: Segment shares of all individual segments available upon report purchase
By Core Technology: MicroLED Disrupts Waveguide Leadership
Waveguide and diffractive optics controlled 51.3% market revenue in 2024, reflecting incumbent manufacturing depth. SCHOTT’s new Kulim facility lifts glass-blank capacity, yet MicroLED innovations are eroding incumbent share. Mojo Vision’s monolithic RGB array delivered 6,350 PPI while halving power draw, marking a leap over traditional displays. Foxconn’s partnership with Porotech to start wafer processing in 2025 signals that supply chains are preparing for volume. As yields improve, MicroLED modules will move from developer kits into consumer eyewear, shifting cost structures and brightening outdoor legibility.
Manufacturers pair MicroLED panels with pancake lenses and multilayer coatings to enhance contrast. Liquid-Crystal-on-Silicon remains relevant for budget headsets, especially in training kiosks where compactness trumps daylight visibility. Over the forecast window, MicroLED’s rapid efficiency gains are expected to convert high-performance use cases first, then cascade into mid-tier products, reshaping technical roadmaps across the Augmented Reality market.
By Application: Remote Assistance Closes the Gap on Visualization
Product visualization retained 40.5% revenue in 2024 as automotive and machinery sellers rely on life-scale configurators to boost win rates. TVS Motor Company reported 10-15% sales lifts after embedding AR showrooms into dealerships. Simultaneously, remote assistance applications are set for a 41.3% CAGR. Peterbilt documented 20% faster repairs using tablet-based overlays of truck blueprints, validating the ROI for fleet operators. The shift aligns with talent shortages that plague industrial maintenance teams, making expert-over-the-shoulder support indispensable.
AI-driven analytics now flag anomalies and summon contextual repair instructions automatically, blending predictive maintenance with AR visualization. As algorithms mature, remote support will rival visualization revenues, cementing a dual-engine growth model for the broader Augmented Reality market.
Note: Segment shares of all individual segments available upon report purchase
By End-user Vertical: Healthcare Surges Ahead
Gaming and entertainment preserved leadership at 32.4% share in 2024, buoyed by smartphone filters and location-based experiences. Yet healthcare outpaces all verticals with a 40.5% CAGR. The FDA has cleared 69 AR-enabled devices, ranging from surgical navigation to rehabilitation aids[2]U.S. Food and Drug Administration, “AR/VR Medical Device Workshop,” fda.gov. UC Davis surgeons overlay CT imagery during complex procedures, reducing incision times and improving clarity during teaching rounds. Hospitals value sterile, voice-controlled interfaces that free hands and eyes. Budget reallocations from conventional training simulators to AR-guided systems reveal cost-effectiveness, pushing other medical centers to pilot similar solutions.
Insurance carriers explore outcome-based reimbursement for AR-assisted surgeries, potentially unlocking new revenue streams. As clinical evidence grows, healthcare’s contribution to the Augmented Reality market will expand rapidly and diversify beyond flagship spine procedures to cardiology, neurology, and interventional radiology.
Geography Analysis
North America dominated with 38.6% Augmented Reality market revenue in 2024 owing to deep enterprise adoption and robust 5G coverage. Government contracts from defense and public-safety agencies provide steady demand for ruggedized headsets, while the FDA’s predictable approval pathway accelerates medical deployments. Venture investment concentrates in Silicon Valley and Seattle, funding platform startups that later expand manufacturing partnerships in Mexico and Canada, reinforcing the regional ecosystem.
Asia-Pacific posted the highest 40.8% CAGR outlook, fueled by China’s 3.33 trillion-yuan R&D pool that subsidizes component foundries and software labs[3]National Development and Reform Commission, “China’s R&D Spending 2024,” ndrc.gov.cn. Japan’s Fugaku supercomputer supports algorithm training for real-time spatial mapping, benefitting domestic optical suppliers. South Korea’s metaverse blueprint aims to nurture 220 immersive-tech firms by 2026, backed by 5.5 billion won in incentives. The region’s mobile economy, adding USD 880 billion in GDP impact, ensures massive consumer addressable markets, smoothing hardware scale-up across the Augmented Reality market.
Europe maintains a balanced trajectory. Germany leverages AR to optimize automotive and machinery assembly lines, achieving double-digit quality gains. The EU’s GDPR compliance pressure forces vendors to embed privacy-preserving designs that later become global norms. Smart-city funds in France and the Netherlands finance AR navigation pilots for public transportation, expanding citizen familiarity. Though growth lags Asia-Pacific, European manufacturing rigor sustains a sizable slice of the Augmented Reality market and shapes safety standards adopted worldwide.
Competitive Landscape
The Augmented Reality market remains moderately fragmented, yet consolidation pressures are visible. Microsoft’s enterprise-first playbook secures automotive, aerospace, and defense deals with HoloLens, reinforcing services pull-through. Google bundles ARServices APIs with Android to capture developer mindshare, while Apple’s vertically integrated Vision Pro defines the premium tier. Meta pivots to platform licensing, opening Horizon OS to Lenovo and Asus to reach price-sensitive segments without scaling hardware in-house.
Component specialists race to secure long-term supply agreements. SCHOTT’s capacity expansion enables guaranteed glass delivery for tier-1 OEMs, while Jade Bird Display leads green-only MicroLED shipments for low-power monocular viewers. Foxconn’s foray into MicroLED backplanes positions the company at the center of next-generation display supply chains. Semiconductor vendors compete on AI inference efficiency: Qualcomm samples its XR2+ Gen 2 SoC with integrated eye tracking, while MediaTek touts 5G modem-on-chip designs to cut latency.
White-space persists in sub-USD 800 consumer glasses. Xreal’s USD 199 Beam Pro underlines latent demand for affordable companion devices, though such products sacrifice onboard compute. Industrial niches—such as hazardous-area headsets certified for oil-and-gas rigs—remain underserved, offering entry points for specialized startups. Over the forecast span the market is expected to shift from feature checklists toward ecosystem depth, wherein content libraries, security attestations, and cross-device continuity decide procurement.
Augmented Reality Industry Leaders
-
Microsoft Corporation
-
Meta Platforms Inc.
-
Apple Inc.
-
Qualcomm Technologies Inc.
-
Google LLC (Alphabet)
- *Disclaimer: Major Players sorted in no particular order
Recent Industry Developments
- May 2025: Samsung and Google confirmed a joint AR glasses program built on an Android XR stack and Gemini AI services, targeting hands-free translation and navigation features.
- December 2024: Foxconn partnered with Porotech to open a MicroLED wafer line in Taichung, with mass output slated for Q4 2025.
- September 2024: SCHOTT inaugurated a waveguide glass facility in Kulim, Malaysia, adding 400 skilled positions and doubling capacity.
- September 2024: Infinite Reality entered a 5-year collaboration with Google Cloud to deliver AI-generated 3D commerce and fan-engagement venues.
Global Augmented Reality Market Report Scope
Objects in the actual world are enhanced by computer-generated image characteristics in augmented reality (AR), which can sometimes span many senses like aural, visual, somatosensory, haptic, and olfactory. A system that reliably registers virtual and real items in 3D merges the real and virtual worlds and enables real-time interaction is known as augmented reality (AR).
The augmented reality market is segmented by type (hardware and software), end-user vertical (gaming, education, healthcare, retail and advertising, automotive, and military and defense), and geography.
The market sizes and forecasts are provided in terms of value (USD billion) for all the above segments.
| By Offering | Hardware | Stand-alone HMDs | ||
| Tethered HMDs | ||||
| Screenless Viewers | ||||
| Software | ||||
| By Core Technology | OLED / Micro-OLED | |||
| MicroLED | ||||
| Waveguide and Diffractive Optics | ||||
| Liquid-Crystal-on-Silicon (LCOS) | ||||
| By Application | Remote Assistance and Maintenance | |||
| Product Visualisation and Configuration | ||||
| Navigation and Mapping | ||||
| Social and Communication Filters | ||||
| Other Applications | ||||
| By End-user Vertical | Gaming and Entertainment | |||
| Education | ||||
| Healthcare | ||||
| Retail | ||||
| Automotive and Transportation | ||||
| Other End-User Verticals | ||||
| By Geography | North America | United States | ||
| Canada | ||||
| Mexico | ||||
| Europe | Germany | |||
| United Kingdom | ||||
| France | ||||
| Italy | ||||
| Spain | ||||
| Rest of Europe | ||||
| Asia-Pacific | China | |||
| Japan | ||||
| India | ||||
| South Korea | ||||
| Australia | ||||
| Rest of Asia-Pacific | ||||
| South America | Brazil | |||
| Argentina | ||||
| Rest of South America | ||||
| Middle East and Africa | Middle East | Saudi Arabia | ||
| United Arab Emirates | ||||
| Turkey | ||||
| Rest of Middle East | ||||
| Africa | South Africa | |||
| Egypt | ||||
| Nigeria | ||||
| Rest of Africa | ||||
| Hardware | Stand-alone HMDs |
| Tethered HMDs | |
| Screenless Viewers | |
| Software |
| OLED / Micro-OLED |
| MicroLED |
| Waveguide and Diffractive Optics |
| Liquid-Crystal-on-Silicon (LCOS) |
| Remote Assistance and Maintenance |
| Product Visualisation and Configuration |
| Navigation and Mapping |
| Social and Communication Filters |
| Other Applications |
| Gaming and Entertainment |
| Education |
| Healthcare |
| Retail |
| Automotive and Transportation |
| Other End-User Verticals |
| North America | United States | ||
| Canada | |||
| Mexico | |||
| Europe | Germany | ||
| United Kingdom | |||
| France | |||
| Italy | |||
| Spain | |||
| Rest of Europe | |||
| Asia-Pacific | China | ||
| Japan | |||
| India | |||
| South Korea | |||
| Australia | |||
| Rest of Asia-Pacific | |||
| South America | Brazil | ||
| Argentina | |||
| Rest of South America | |||
| Middle East and Africa | Middle East | Saudi Arabia | |
| United Arab Emirates | |||
| Turkey | |||
| Rest of Middle East | |||
| Africa | South Africa | ||
| Egypt | |||
| Nigeria | |||
| Rest of Africa | |||
Key Questions Answered in the Report
What is the current value of the Augmented Reality market?
The Augmented Reality market reached USD 94.82 billion in 2025 and is on track to exceed USD 511 billion by 2030 at a 40.1% CAGR.
Which region will grow the fastest between 2025 and 2030?
Asia-Pacific is projected to lead growth with a 40.8% CAGR, driven by China’s industrial policies, Japanese research infrastructure, and South Korean metaverse initiatives.
Why is healthcare gaining share in the Augmented Reality market?
Regulatory clearances for surgical navigation and training systems, coupled with measurable gains in procedure accuracy and clinician efficiency, give healthcare a 40.5% CAGR outlook.
What technologies will replace traditional displays in AR headsets?
MicroLED panels achieving pixel densities above 6,000 PPI and lower power draw are expected to displace waveguide-OLED combinations in premium devices after 2026.
How are 5G networks influencing enterprise AR adoption?
Sub-20 ms latency and edge-computing slices let companies stream real-time telemetry to headsets, enabling digital-twin overlays that cut assembly errors and maintenance downtime.
What factors limit consumer uptake of AR glasses today?
Battery life, headset weight, and privacy concerns remain key barriers; ongoing research into off-board rendering and low-power optics aims to deliver all-day wearable form factors.
Page last updated on: June 30, 2025

