
Market Overview
| Study Period | 2021 - 2031 |
|---|---|
| Forecast Data Period | 2026 - 2031 |
| Base Year Market Size (2025) | 22.49 gigawatt |
| Market Volume (2026) | 24.8 gigawatt |
| Market Volume (2031) | 40.45 gigawatt |
| Growth Rate (2026 - 2031) | 10.28 % |
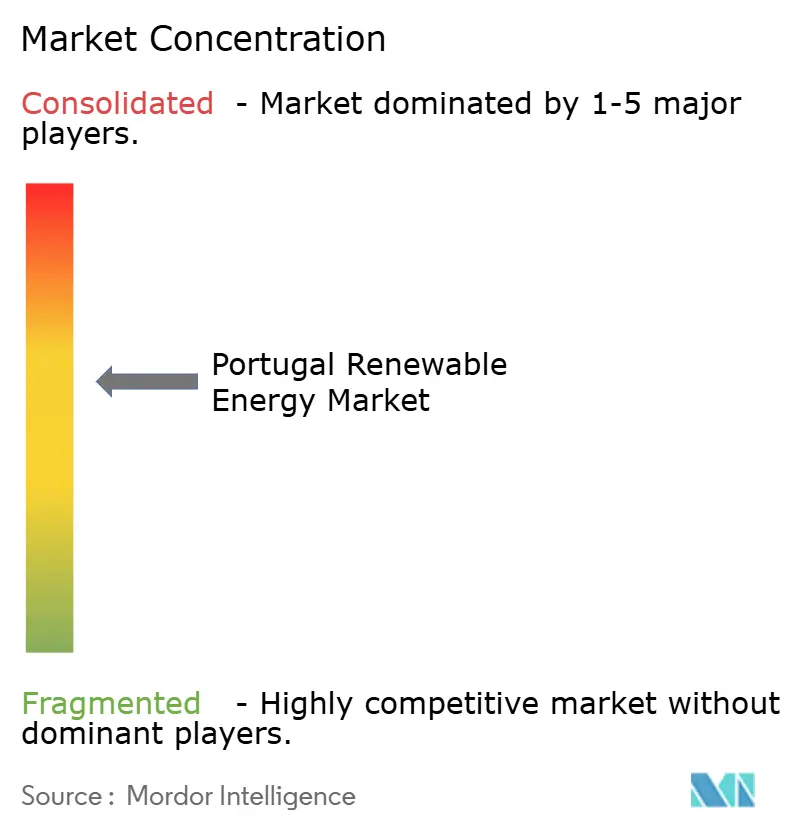
| Market Concentration | Medium |
Major Players *Disclaimer: Major Players sorted in no particular order Image © Mordor Intelligence. Reuse requires attribution under CC BY 4.0. | |
Portugal Renewable Energy Market Analysis by Mordor Intelligence
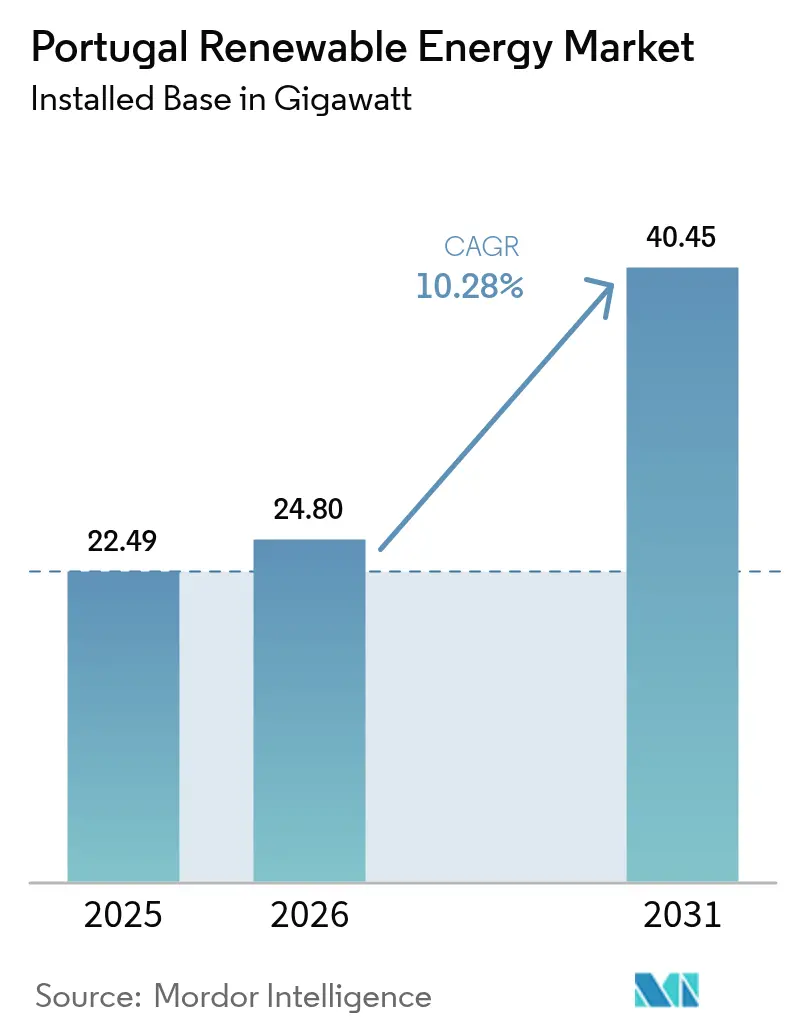
The Portugal Renewable Energy Market size is expected to grow from 22.49 gigawatt in 2025 to 24.8 gigawatt in 2026 and is forecast to reach 40.45 gigawatt by 2031 at 10.28% CAGR over 2026-2031.
Hydropower continues to anchor capacity, yet fast-falls in solar-auction clearing prices, robust EU Recovery and Resilience funding, and an ambitious 51% renewables-in-final-energy target collectively accelerate technology diversification. Policy measures such as reduced VAT on rooftop panels, streamlined permitting for hybrids, and a doubling of the offshore-wind goal to 10 GW intensify capital inflows and heighten enterprise activity.[1]European Commission Recovery Plan, “Portugal Climate Allocation,” bbva.com Record-high 71% renewable electricity penetration in 2024 verified system flexibility but also exposed grid congestion on the north–south backbone, prompting a EUR 611 million transmission upgrade program. Competitive intensity has sharpened as incumbents integrate technologies and independent developers monetize greenfield pipelines, positioning the Portugal renewable energy market as a continental benchmark for rapid clean-power scaling.
Key Report Takeaways
- By technology, hydropower led with 38.65% Portugal's renewable energy market share in 2025; solar is forecast to expand at a 20.1% CAGR through 2031.
- By end-user, utilities commanded 84.55% of the Portugal renewable energy market size in 2025, while the residential segment is projected to grow at a 20.6% CAGR to 2031.
Note: Market size and forecast figures in this report are generated using Mordor Intelligence’s proprietary estimation framework, updated with the latest available data and insights as of 2026.
Portugal Renewable Energy Market Trends and Insights
Drivers Impact Analysis*
| Driver | (~) % Impact on CAGR Forecast | Geographic Relevance | Impact Timeline |
|---|---|---|---|
| Aggressive solar auction pipeline lowering LCOE | +2.1% | Alentejo, Algarve | Medium term (2-4 years) |
| EU Recovery & Resilience funding accelerating grid upgrades | +1.8% | Transmission corridors nationwide | Short term (≤ 2 years) |
| Doubling of offshore-wind target to 10 GW by 2030 opens new capex cycle | +2.4% | Viana do Castelo, Sines coast | Long term (≥ 4 years) |
| Corporate PPAs from data-centres & green-hydrogen projects create bankable demand | +1.6% | Sines cluster, Lisbon metro | Medium term (2-4 years) |
| Battery-storage co-location rules enabling higher renewable capacity factors | +1.2% | Grid-constrained zones | Medium term (2-4 years) |
| Fast-track permitting for agrivoltaics in drought-hit Alentejo | +0.6% | Alentejo agricultural belt | Short term (≤ 2 years) |
| Source: Mordor Intelligence | |||
Aggressive Solar Auction Pipeline Lowering LCOE
Portugal’s latest 670 MW solar tender cleared below EUR 15/MWh, cementing PV as the cheapest marginal supply in Iberia.[2]Renewables Now, “670 MW Solar Tender Sets Record,” renewablesnow.com Deadline extensions for 2019-2021 winners avoid defaults and keep 2.1 GW of pre-contracted projects on track. Developers added 1.77 GW of PV in 2024, 86% of all new renewables, and a EUR 1 billion EU-approved grant program now backs domestic component factories. Residential VAT relief at 6% through June 2025 cuts rooftop payback below six years, fueling a pipeline that supports the segment’s 20.8% CAGR. Utilities, capitalizing on auction tariffs, lock in 15-year PPAs that underpin finance at sub-150 bps spreads.
EU Recovery & Resilience Funding Accelerating Grid Upgrades
The European Council released EUR 3.059 billion to Portugal for climate action, of which EUR 611 million targets new 400 kV lines relieving Sines and northeast bottlenecks.[3]European Council, “Amended RRP Approved,” consilium.europa.eu Grid operator REN projects load rising to 57 TWh by 2031, necessitating faster connection approvals to accommodate 23 GW in renewable additions. A EUR 700 million EIB loan to EDP digitizes 1.3 million smart meters and automates substations, boosting hosting capacity for small producers. EU auditors view Portugal’s flexible hydro and demand-response pilots as models for member-state replication. Collectively, funding streams raise system robustness and lift the Portugal renewable energy market’s growth profile.
Doubling of Offshore-Wind Target to 10 GW by 2030 Opens New Capex Cycle
The Marine Spatial Allocation Plan earmarks 9.4 GW for floating turbines, and the first auction is slated for 2025. WindFloat Atlantic has produced 345 GWh since 2019, validating resource quality and de-risking upcoming bids. Vessel scarcity looms, with only 20 capable ships globally and day-rates at USD 350,000, risking cost inflation. Iberian yard upgrades remain under negotiation, but early turbine-slot reservations by Ocean Winds and Iberdrola mitigate timetable slippage. If realized, offshore additions will expand the Portugal renewable energy market size by roughly 27% between 2027-2030.
Corporate PPAs from Data-Centres & Green-Hydrogen Projects Create Bankable Demand
The 1.2 GW Sines DC campus commits to 100% renewable supply via long-tenor PPAs, creating Portugal’s largest single offtake contract. Galp’s EUR 650 million electrolyzer and biofuel projects require 1.2 TWh of clean power annually, financed partly by a EUR 430 million EIB facility. Fusion Fuel’s 630 MW HEVO-Portugal adds further baseload demand, while Iberdrola’s 410 GWh PPA with Vodafone underscores corporates’ appetite for price-stable green electricity. The emerging H2Med corridor links Portuguese generation to Northern Europe, broadening PPA liquidity.
Restraints Impact Analysis*
| Restraint | (~) % Impact on CAGR Forecast | Geographic Relevance | Impact Timeline |
|---|---|---|---|
| Grid congestion in north–south transmission corridor | -1.9% | National backbone | Short term (≤ 2 years) |
| Rising curtailment risk from midday solar spikes | -1.4% | Alentejo, Algarve | Medium term (2-4 years) |
| Offshore-wind supply-chain bottlenecks at Iberian yards | -1.6% | Coastal zones | Long term (≥ 4 years) |
| Social opposition to utility-scale solar in ecologically sensitive areas | -1.0% | Protected landscapes | Medium term (2-4 years) |
| Source: Mordor Intelligence | |||
Grid Congestion in North–South Transmission Corridor
The April 2025 Iberian blackout, triggered by sequential PV trips totaling 600 MW, exposed Portugal’s limited inertia and reactive-power deficit.[4]Baker Institute, “Iberian Blackout Forensics,” bakerinstitute.org Redispatch costs doubled to EUR 146 million in 2024, and the Joint Research Centre projects volumes could increase sixfold by 2040, absent upgrades.[5]European Commission Joint Research Centre, “Grid Congestion Outlook,” joint-research-centre.ec.europa.eu REN tested 100 MVA grid-forming inverters at Valeira, but nationwide rollout is two years away. Connection caps south of Lisbon now limit new approvals to 800 MW per quarter, temporarily throttling the Portugal renewable energy market.
Rising Curtailment Risk from Midday Solar Spikes
PV covered 10% of consumption in 2024 with production up 37% year-on-year, creating frequent negative noon prices. Four proposed Alqueva arrays totaling 1.3 GW would exceed local reverse-flow limits without another 220 kV circuit. Curtailment rose to 182 GWh in 2024 and could triple by 2027 if storage lags. The 500 MW battery program targets relief, yet may miss the solar commissioning pace. Stakeholders push for regional pricing or accelerated grid builds to safeguard the Portugal renewable energy market.
*Our forecasts treat driver/restraint impacts as directional, not additive. The impact forecasts reflect baseline growth, mix effects, and variable interactions.
Segment Analysis
By Technology: Hydropower Leadership Faces Solar Disruption
Hydropower retained 38.65% Portugal's renewable energy market share in 2025 on 8.45 GW installed, with the 1,158 MW Alto Tâmega complex providing up to 1.76 TWh annually and 40 GWh of pumped-storage capacity. Wind contributed 27% of generation, largely from 5.9 GW onshore fleets, while bioenergy held a stable 6%. Solar added 1.77 GW in 2024, lifting cumulative PV to 3.8 GW and delivering a record 37% annual growth. The Portugal renewable energy market size for solar is forecast to reach 14.9 GW by 2031, tripling 2024 levels as auction pipelines mature.
Cost declines and flexible permitting spur hybridization. Wind-solar hybrids in Guarda province achieve 43% capacity factors by sharing one grid point, while co-located batteries secure dispatch rights. Emerging geothermal and wave pilots receive EUR 35 million in Horizon Europe grants, adding long-run diversification optionality. Hydropower's reliability and pumped-storage remain critical; reservoir inflows in 2024 enabled 24% year-on-year generation growth, cushioning PV variability. By 2031, the technology mix shifts toward a balanced triad where hydropower, wind, and solar each hold roughly one-third capacity, reinforcing the Portugal renewable energy market's resilience.




By End-User: Utilities Dominance Challenged by Residential Growth
Utilities controlled 84.55% capacity in 2025, reflecting historic central-PPA structures, yet residential rooftop systems logged 48% install growth thanks to 6% VAT and subsidies covering up to 85% capex. A 5 kWp home array yields about 7,000 kWh annually, saving EUR 805-1,500 on bills and delivering five-year paybacks. The Portugal renewable energy market size for residential PV could exceed 2.2 GW by 2031, supported by virtual-power-plant aggregators who pool excess into ancillary-service bids.
Commercial and industrial users leverage Decree-Law 15/2022 to net-meter at wholesale prices, pushing C&I rooftops above 620 MW in 2025. Utility IPPs still dominate scale: Neoen’s 272 MWp Ourique park supplies 110,000 households under 15-year tariffs. EDP Renováveis targets 1 GW of additional utility capacity by 2026 through solar-wind-storage clusters. As self-consumption broadens, utilities pivot to service models, offering bundled storage leases and maintenance contracts, signalling a gradual structural shift in the Portugal renewable energy industry.

Geography Analysis
Alentejo and Algarve lead solar development, each boasting global horizontal irradiation of 1,600-2,200 kWh/m² and more than 300 sunny days. Alentejo alone hosted 38% of PV commissioned in 2024 and is on track for another 5.4 GW by 2031. REN accelerates a 220 kV loop to double south-north transfer capacity, vital for absorbing midday exports. Floating PV at Cabril (47.77 MWp) illustrates creative land-use solutions in water reservoirs.
Northern Portugal capitalizes on abundant hydro resources. The Alto Tâmega cascade bolsters voltage stability and supports the region’s paper and metallurgy industries. Trás-os-Montes run-of-river plants complement winter demand peaks. The Lisbon metropolitan zone, facing retail tariffs averaging EUR 0.23/kWh, sees rising rooftop and community-solar schemes.
Coastal regions prepare for offshore wind. Viana do Castelo’s 3-GW zoned block and Sines’ deep-water harbor position them as assembly hubs. Port authorities plan 600 m quays and heavy-lift cranes to handle 15 MW nacelles, anticipating final-investment decisions post-auction. Hydrogen clusters at Sines integrate electrolyzers and ammonia export terminals, linking inland solar with maritime users.
Comparing 2019-2024 trends to 2026-2031 forecasts, geographic specialization intensifies: Alentejo becomes the PV heartland, the north retains hydropower dominance, and the coast emerges as an offshore-wind frontier. This spatial balance mitigates weather risk and distributes investment, solidifying the Portugal renewable energy market’s national footprint.
Regulatory Landscape
Portugal's renewable power market is governed under the National Electricity System (SEN) framework, anchored by Decree-Law No. 15/2022 (as amended). ERSE regulates market oversight, tariffs, and network access, while DGEG is responsible for licensing and operational control of renewable generation facilities. In June 2026, Decree-Law No. 130/2026 (29 June 2026) strengthened alignment with EU electricity market design reforms, adding regulatory clarity for contracting structures and the integration of flexibility resources such as storage.
Distributed generation and faster permitting have been reinforced through Lei n. 29/2026 (23 June 2026), which introduced the Renewable Energy Utilization Contract (CAER) and established tacit approval (deferimento tacito) for self-consumption (UPAC) licensing, alongside a mandate for a comparison platform for aggregator offers. On the administrative side, the Mission Structure for Licensing Renewable Energy Projects 2030 (EMER 2030), created by Resolution of the Council of Ministers No. 50/2024, continues to focus on simplifying licensing for renewables and storage, while national planning under PNEC 2030 supports an expanded role for renewable hydrogen and biomethane in the energy transition.
Competitive Landscape
EDP Renováveis remains the largest integrated player, commissioning the 202 MW Cerca solar facility and planning 1 GW of additional capacity by 2026. Iberdrola channels part of its EUR 41 billion global plan into Alto Tâmega hydro and Montechoro solar, while locking turbine slots for upcoming offshore bids. Neoen, Acciona Energía, and Brookfield Renewable expand through greenfield builds and asset acquisitions; Neoen’s 272 MWp project is now Portugal’s largest PV site.
Technological edge shapes competition. Hybrid plants combining wind, solar, and 2-hour batteries reach 45% capacity factors and earn balancing-market premiums. Developers monetize mature assets to recycle capital, illustrated by Exus Renewables buying Lightsource bp’s 130 MWp Cibele farm. Offshore-wind consortia race to pre-secure towers, cables, and vessel charters amid supply-chain tightness. Service differentiation grows: Iberdrola’s 410 GWh Vodafone PPA showcases tailored corporate offerings. Capital access proves decisive; Galp’s EUR 430 million EIB loan for a 100 MW electrolyzer exemplifies concessional financing advantages. Overall, the Portugal renewable energy market shows moderate concentration, yet agile mid-caps and foreign investors intensify rivalry and innovation.
Portugal Renewable Energy Industry Leaders
Energias de Portugal (EDP Renováveis)
Iberdrola SA
Finerge
Brookfield Renewable Partners LP
Acciona Energía
- *Disclaimer: Major Players sorted in no particular order

Market Opportunities and Future Outlook
Grid-constrained solar buildout, rising midday curtailment, and corporate offtake growth are creating an opportunity set around flexibility, hybridization, and faster project delivery. Storage co-location is moving from policy intent to execution, illustrated by Akuo starting construction of the 80 MW/220 MWh SantasBAT BESS in March 2026, co-located with the existing 181 MW Santas solar plant in Borba. The project is positioned to manage solar peak output and preserve connection value. Hybrid projects are also expanding usable output from existing grid points, with EDP placing into operation the Pracana hydro plus onshore solar hybrid (89 MW total) as a first-of-its-kind configuration in Portugal.
Permitting and siting reforms create whitespace for developers that can systematize project origination and community-facing execution. In June 2026, the Government advanced new market rules through Decreto-Lei n. 130/2026 and Lei n. 29/2026, including tacit approvals for UPAC, and announced the rollout of ZAER "Green Zones" to simplify and accelerate renewable installations, widening the pipeline for both utility-scale and decentralized assets. Demand-side evidence remains supportive of incremental capacity absorption: Portugal recorded 80.7% renewable incorporation in national electricity production during Q1 2026, while major electrification loads tied to data centers and green hydrogen continue to underpin long-tenor contracting, particularly around the Sines cluster.
Recent Industry Developments
- May 2026: Iberdrola started commissioning the 195 MW Tamega Norte wind farm in Portugal. The project adds incremental onshore wind capacity in a system increasingly shaped by solar-driven price and congestion patterns. Progress at the Tamega cluster also reinforces the strategic role of hybrid-ready renewable hubs linked to grid upgrade programs.
- April 2026: Finerge secured EUR 115 million in construction financing from Caixa Geral de Depositos, BCP, and Sabadell for a 257 MWp solar PV portfolio. The transaction points to continued bankability for Portuguese utility-scale solar amid connection constraints, with multi-project financing supporting faster buildout across several sites. It also highlights the need for well-structured pipelines and permitting readiness to convert capital into commissioned capacity.
- January 2026: EDP began operation of the Pracana hybrid project, combining hydroelectric generation with onshore solar for a total of 89 MW and an estimated 87 GWh of annual solar production. The hybrid configuration shows how renewable output can be increased while leveraging existing infrastructure and system flexibility. It also provides a practical reference for developers seeking to maximize grid access value in constrained corridors.


Research Methodology Framework and Report Scope
Market Definition and Coverage
This market is defined as Portugal's installed renewable power capacity measured in gigawatts, covering grid-connected and distributed additions that are commissioned and available for operation in the country.
Scope exclusions: We exclude fossil-based generation, standalone grid infrastructure, and pure electricity trading activity when it is not linked to renewable capacity additions.
Segmentation Overview
- By Technology
- Solar Energy (PV and CSP)
- Wind Energy (Onshore and Offshore)
- Hydropower (Small, Large, PSH)
- Bioenergy
- Geothermal
- Ocean Energy (Tidal and Wave)
- By End-User
- Utilities
- Commercial and Industrial
- Residential
Data Sources, Market Sizing, and Validation
Desk Research
Desk research was used to build the base map of Portugal's renewable capacity and the policy and grid context that shapes project commissioning. We referenced public sources such as DGEG energy statistics, REN grid and system data, Eurostat energy balances, IEA country energy data, and IRENA capacity time series to keep the definition consistent and avoid mixing capacity with generation.
To make the model practical, we also reviewed company annual reports, regulated filings, project press releases, and reputable industry press to identify commissioning timelines and technology mix shifts. Patent databases were checked selectively to understand the direction of equipment improvements that can change capacity factors over time. We used a shipment-level import and export database in a limited way to sanity-check major equipment flows where public capacity updates lagged. These examples are not exhaustive, and many other public sources were also consulted for data collection, validation, and clarification.
Primary Interviews and Surveys
Primary interviews and structured surveys were used to validate project pipelines, expected commissioning slippage, and the practical split between utility-scale and smaller installations across Portugal. We spoke with a mix of developers, EPC and O&M participants, utilities, and informed stakeholders to cross-check the desk view and confirm realistic assumptions for annual net additions and retirements.
Distribution of primary research fieldwork respondents
| Company type | Respondent position |
|---|---|
| Top tier: 27% | CXOs: 19% |
| Mid tier: 52% | Functional/Unit leaders: 28% |
| Smaller Players: 21% | Managers: 53% |
Market-Sizing & Forecasting
Sizing starts with a top-down reconstruction of installed renewable capacity by technology using official time series and grid disclosures, then it is rolled forward year by year using additions, retirements, and known project commissioning schedules. Where public updates are delayed, we fill gaps by applying conservative commissioning profiles that were validated in calls, and then we revisit assumptions once new official releases appear.
We also use selective bottom-up approximations to corroborate totals, mainly through sampled project roll-ups, tender awards, and channel checks around equipment deliveries and typical build times. In Portugal, the inputs that move the year-to-year picture most include annual auction awards and awarded MW, grid connection availability and curtailment signals, permitting timelines, repowering activity in wind, and the pace of utility-scale solar buildout versus smaller systems. For forecasting, scenario analysis is applied around policy targets and connection constraints, and then scenario weights are adjusted using the consensus view from industry experts so the growth path stays realistic for each technology.
Data Validation & Update Cycle
Outputs are checked against independent signals such as published national capacity totals, grid operator updates, and major commissioning announcements to ensure year-to-year movements make sense. When a variance is found, we rerun the calculations, review the drivers, and re-contact sources if the gap is material and linked to a specific project pipeline change.
Before sign-off, the model goes through multi-step analyst review, including logic checks on technology shares, growth rates, and unusual step-changes that may reflect a definition mismatch. The report is refreshed annually, and interim updates are made when policy changes, auctions, or large project delays create a meaningful shift. Right before delivery, we do a fresh scan so clients receive the latest updated view.
Mordor Intelligence's Portugal Renewable Energy Market Size Measured Against Other Published Estimates
Published market sizes for Portugal renewable energy often do not line up because teams measure different things and then label them similarly. Some figures are stated in money terms, while others are stated in capacity terms, and the forecast windows and base years are also not always the same.
The main gap comes from mixing installed capacity with revenue, where Mordor Intelligence keeps the total strictly as commissioned renewable capacity in GW and avoids folding in electricity sales value, EPC spend, or broader clean-energy services that can inflate a USD estimate. Differences can also come from how delayed grid connections are treated, whether repowering is counted as net new capacity, and what currency year and inflation logic is applied when a value-based model is used.
Benchmark comparison
| Source | Market Size | Gaps in Research Methodology |
|---|---|---|
| Mordor Intelligence | USD 22.49 B (2025) | |
| Industry Publisher A | USD 4.10 B (2025) | Uses a value-based definition that typically reflects revenue or investment associated with renewables, which makes the number not comparable to an installed-capacity total. The scope can also vary by whether grid upgrades and service spend are included in the market value. |
| Energy Briefing B | USD 7.60 B (2034) | Reports a longer-horizon value forecast, and the year is not aligned with a capacity snapshot year. Results can shift based on assumed price inflation, exchange-rate timing, and whether the forecast leans aggressive on project execution. |
The spread in the table is mainly explained by the unit and scope choice, since one view tracks gigawatts on the ground and the other views track money flows around renewables. By keeping the capacity definition consistent and then validating year-by-year movements with grid and project signals, our estimate stays traceable to clear inputs and repeatable steps.


Key Questions Answered in the Report
What capacity does the Portugal renewable energy market currently hold?
Installed capacity stood at 24.8 GW in 2026 and is forecast to reach 40.45 GW by 2031 at a 10.28% CAGR.
Which technology segment is expanding fastest?
Solar photovoltaic is projected to grow at a 20.1% CAGR through 2031, driven by record-low auction prices and tax incentives.
How large is hydropower’s role in Portugal?
Hydropower accounted for 38.65% Portugal renewable energy market share in 2025 and continues to provide critical pumped-storage flexibility.
What fuels corporate demand for clean electricity?
Data-centre campuses, green-hydrogen refineries and multinational PPAs drive long-tenor contracts that underpin new capacity additions.
Where are future offshore-wind projects concentrated?
Designated zones near Viana do Castelo and Sines total 9.4 GW and will be allocated via auctions beginning in 2025.
What is the chief barrier to faster rollout?
Grid congestion on the north–south corridor and limited installation-vessel availability are the primary constraints on near-term growth.
Page last updated on:





